![]() | |
Continent | Australia |
---|---|
Coordinates | 30°S135°E / 30°S 135°E |
Area | Ranked 4th among states and territories [1] |
• Total | 984,321 [2] km2 (380,048 sq mi) |
• Land | 94.25% |
• Water | 5.75% |
Coastline | 3,815 [3] km (2,371 mi) |
Borders | Land borders: Western Australia, Northern Territory, Queensland, New South Wales, Victoria |
Highest point | Mount Woodroffe 1,435 m (4,708 ft) |
Lowest point | Lake Eyre -15 m (49 ft) |
Longest river | Murray River 683 km (424 mi) |
Largest lake | Lake Eyre 9690 km2 |
The geography of South Australia incorporates the south central part of the continent of Australia. It is one of the six states of Australia. South Australia is bordered on the west by Western Australia, to the north by the Northern Territory, Queensland to the northeast, and both New South Wales and Victoria to the east. South Australia's south coast is flanked by the Great Australian Bight and the Southern Ocean. [4]
The northern and western parts of the state are extremely arid, in central Australia, dominated by Lake Eyre and Lake Torrens, mostly dry salt lakes. This arid area is sparsely populated, with many large cattle stations, and significant areas protected as national parks, or as Aboriginal lands. The only significant roads through these areas are the Stuart Highway north from Port Augusta to the Northern Territory, the Eyre Highway across the Nullarbor Plain to Western Australia, and the Barrier Highway east to Broken Hill in New South Wales. These highways have corresponding railways: the Trans-Australian Railway going west and east, and the Adelaide–Darwin railway going north.
The coastline includes cliffs against the Great Australian Bight including the western side of Eyre Peninsula. The coast is less rugged on Spencer Gulf and Gulf St Vincent (separated by Yorke Peninsula), Fleurieu Peninsula, Encounter Bay and The Coorong. Bordering the east of Gulf St Vincent is the Temperate Grassland of South Australia.
The highest point in the state is Mount Woodroffe at 1,435 metres (4,708 ft) in the Musgrave Ranges in the northwest corner of the state. [5] The main range is the Mount Lofty Ranges and Flinders Ranges extending approximately 800 kilometres (497 mi) from Fleurieu Peninsula along the eastern sides of Gulf St Vincent and Spencer Gulf respectively. About half the state is less than 150 m above sea level. [6]
The arid north is delineated from the more fertile southeast by Goyder's Line, first surveyed in the 1860s, and which has proven to be a remarkably accurate northern boundary marking where sustainable agriculture can be carried out. Three deserts are contained within South Australia's borders: Great Victoria Desert, Strzelecki Desert and Sturt Stony Desert. [7]
East of the Mount Lofty Ranges, the Murray River flows west from New South Wales and Victoria, then south adjacent to the ranges. The Murray River is the only large, permanent river in the state, [6] and is a major water source for the state's primary city, Adelaide, and its surrounding regional communities. [8]
Southern areas of South Australia have a Mediterranean climate, while the rest of the state has a drier arid climate and semi-arid climate. [9] The state's mean temperature range is 29 °C in January and 15 °C in July. Daily temperatures in parts of the state in January & February can be as high as 48 °C. The highest maximum temperature in that state 50.7 °C (123.3 °F), was recorded at Oodnadatta on 2 January 1960. This is also the highest official temperature recorded in the whole of Australia. [10] The lowest minimum temperature recorded in South Australia was -8.2 °C (17.2 °F), at Yongala on 20 July 1976. [11]
Climate data for Adelaide (Köppen Csa) | |||||||||||||
---|---|---|---|---|---|---|---|---|---|---|---|---|---|
Month | Jan | Feb | Mar | Apr | May | Jun | Jul | Aug | Sep | Oct | Nov | Dec | Year |
Record high °C (°F) | 47.7 (117.9) | 44.7 (112.5) | 42.2 (108.0) | 36.9 (98.4) | 31.1 (88.0) | 25.4 (77.7) | 23.1 (73.6) | 30.4 (86.7) | 34.3 (93.7) | 39.0 (102.2) | 43.0 (109.4) | 45.2 (113.4) | 47.7 (117.9) |
Mean daily maximum °C (°F) | 30.0 (86.0) | 29.7 (85.5) | 26.6 (79.9) | 23.0 (73.4) | 19.0 (66.2) | 16.2 (61.2) | 15.6 (60.1) | 16.7 (62.1) | 19.3 (66.7) | 22.5 (72.5) | 25.4 (77.7) | 27.6 (81.7) | 22.6 (72.7) |
Daily mean °C (°F) | 23.8 (74.8) | 23.6 (74.5) | 21.0 (69.8) | 17.9 (64.2) | 14.6 (58.3) | 12.3 (54.1) | 11.7 (53.1) | 12.4 (54.3) | 14.6 (58.3) | 17.1 (62.8) | 19.8 (67.6) | 21.7 (71.1) | 17.5 (63.5) |
Mean daily minimum °C (°F) | 17.6 (63.7) | 17.5 (63.5) | 15.3 (59.5) | 12.7 (54.9) | 10.2 (50.4) | 8.3 (46.9) | 7.7 (45.9) | 8.1 (46.6) | 9.9 (49.8) | 11.7 (53.1) | 14.1 (57.4) | 15.8 (60.4) | 12.4 (54.3) |
Record low °C (°F) | 9.2 (48.6) | 9.5 (49.1) | 7.2 (45.0) | 4.3 (39.7) | 1.5 (34.7) | −0.4 (31.3) | 0.4 (32.7) | 0.9 (33.6) | 2.6 (36.7) | 4.7 (40.5) | 5.3 (41.5) | 7.9 (46.2) | −0.4 (31.3) |
Average rainfall mm (inches) | 21.2 (0.83) | 20.0 (0.79) | 24.9 (0.98) | 37.6 (1.48) | 59.3 (2.33) | 77.7 (3.06) | 71.1 (2.80) | 66.9 (2.63) | 59.6 (2.35) | 40.0 (1.57) | 31.0 (1.22) | 28.3 (1.11) | 536.5 (21.12) |
Average precipitation days (≥ 0.2 mm) | 5.0 | 3.8 | 5.9 | 8.2 | 12.7 | 14.4 | 16.0 | 15.6 | 13.6 | 9.6 | 8.3 | 7.4 | 120.5 |
Average afternoon relative humidity (%) | 36 | 36 | 40 | 45 | 55 | 61 | 59 | 54 | 50 | 44 | 40 | 38 | 47 |
Mean monthly sunshine hours | 325.5 | 285.3 | 266.6 | 219.0 | 167.4 | 138.0 | 148.8 | 186.0 | 204.0 | 257.3 | 273.0 | 294.5 | 2,765.4 |
Source: Australian Bureau of Meteorology. [12] [13] |
Climate data for Mount Gambier (Köppen Csb/Cfb) | |||||||||||||
---|---|---|---|---|---|---|---|---|---|---|---|---|---|
Month | Jan | Feb | Mar | Apr | May | Jun | Jul | Aug | Sep | Oct | Nov | Dec | Year |
Record high °C (°F) | 44.1 (111.4) | 44.9 (112.8) | 41.3 (106.3) | 35.8 (96.4) | 28.5 (83.3) | 21.6 (70.9) | 22.4 (72.3) | 26.6 (79.9) | 32.2 (90.0) | 34.4 (93.9) | 41.2 (106.2) | 45.9 (114.6) | 45.9 (114.6) |
Mean maximum °C (°F) | 35.2 (95.4) | 34.5 (94.1) | 31.3 (88.3) | 26.0 (78.8) | 19.9 (67.8) | 16.1 (61.0) | 15.4 (59.7) | 17.2 (63.0) | 20.6 (69.1) | 24.4 (75.9) | 28.6 (83.5) | 32.1 (89.8) | 35.2 (95.4) |
Mean daily maximum °C (°F) | 25.9 (78.6) | 26.0 (78.8) | 23.6 (74.5) | 20.0 (68.0) | 16.4 (61.5) | 14.1 (57.4) | 13.5 (56.3) | 14.5 (58.1) | 16.2 (61.2) | 18.7 (65.7) | 21.4 (70.5) | 23.7 (74.7) | 19.5 (67.1) |
Daily mean °C (°F) | 19.0 (66.2) | 19.2 (66.6) | 17.3 (63.1) | 14.5 (58.1) | 12.0 (53.6) | 10.1 (50.2) | 9.6 (49.3) | 10.2 (50.4) | 11.5 (52.7) | 13.1 (55.6) | 15.2 (59.4) | 17.1 (62.8) | 14.1 (57.3) |
Mean daily minimum °C (°F) | 12.0 (53.6) | 12.3 (54.1) | 11.0 (51.8) | 9.0 (48.2) | 7.6 (45.7) | 6.1 (43.0) | 5.6 (42.1) | 5.9 (42.6) | 6.7 (44.1) | 7.5 (45.5) | 9.0 (48.2) | 10.4 (50.7) | 8.6 (47.5) |
Mean minimum °C (°F) | 6.7 (44.1) | 7.2 (45.0) | 6.1 (43.0) | 4.4 (39.9) | 3.0 (37.4) | 1.5 (34.7) | 1.4 (34.5) | 1.8 (35.2) | 2.3 (36.1) | 2.9 (37.2) | 4.1 (39.4) | 5.8 (42.4) | 1.4 (34.5) |
Record low °C (°F) | 1.4 (34.5) | 2.8 (37.0) | 0.0 (32.0) | −1.8 (28.8) | −2.8 (27.0) | −3.9 (25.0) | −3.9 (25.0) | −2.6 (27.3) | −3.4 (25.9) | −1.6 (29.1) | −0.8 (30.6) | 1.2 (34.2) | −3.9 (25.0) |
Average precipitation mm (inches) | 31.2 (1.23) | 25.7 (1.01) | 34.8 (1.37) | 49.7 (1.96) | 72.2 (2.84) | 91.5 (3.60) | 99.3 (3.91) | 100.4 (3.95) | 75.8 (2.98) | 54.2 (2.13) | 46.0 (1.81) | 40.2 (1.58) | 721 (28.37) |
Average precipitation days (≥ 1.0 mm) | 4.5 | 3.5 | 6.0 | 8.7 | 11.9 | 13.3 | 15.3 | 15.5 | 12.8 | 9.7 | 7.3 | 6.7 | 115.2 |
Average relative humidity (%) | 54.0 | 56.0 | 60.5 | 64.5 | 76.0 | 80.5 | 79.0 | 73.5 | 69.5 | 62.5 | 59.5 | 55.5 | 65.9 |
Average dew point °C (°F) | 9.8 (49.6) | 10.4 (50.7) | 9.7 (49.5) | 8.7 (47.7) | 8.7 (47.7) | 7.6 (45.7) | 6.8 (44.2) | 6.5 (43.7) | 7.3 (45.1) | 7.5 (45.5) | 8.4 (47.1) | 8.8 (47.8) | 8.4 (47.0) |
Mean monthly sunshine hours | 282.1 | 243.0 | 217.0 | 171.0 | 136.4 | 123.0 | 136.4 | 164.3 | 170.5 | 220.1 | 234.0 | 260.4 | 2,358.2 |
Mean daily sunshine hours | 9.1 | 8.6 | 7.0 | 5.7 | 4.4 | 4.1 | 4.4 | 5.5 | 6.0 | 7.1 | 7.8 | 8.4 | 6.5 |
Source 1: Australian Bureau of Meteorology (1991-2020 normals) [14] | |||||||||||||
Source 2: Australian Bureau of Meteorology (1941-present extremes) [15] |
Climate data for Port Lincoln (Köppen Csb) | |||||||||||||
---|---|---|---|---|---|---|---|---|---|---|---|---|---|
Month | Jan | Feb | Mar | Apr | May | Jun | Jul | Aug | Sep | Oct | Nov | Dec | Year |
Record high °C (°F) | 48.3 (118.9) | 44.4 (111.9) | 43.3 (109.9) | 39.5 (103.1) | 32.7 (90.9) | 27.3 (81.1) | 24.1 (75.4) | 31.2 (88.2) | 34.0 (93.2) | 40.8 (105.4) | 45.8 (114.4) | 45.6 (114.1) | 48.3 (118.9) |
Mean maximum °C (°F) | 33.4 (92.1) | 32.0 (89.6) | 30.5 (86.9) | 27.6 (81.7) | 24.0 (75.2) | 19.1 (66.4) | 18.6 (65.5) | 20.7 (69.3) | 24.8 (76.6) | 29.0 (84.2) | 30.6 (87.1) | 32.3 (90.1) | 33.4 (92.1) |
Mean daily maximum °C (°F) | 26.2 (79.2) | 25.8 (78.4) | 24.4 (75.9) | 22.4 (72.3) | 19.5 (67.1) | 16.8 (62.2) | 16.1 (61.0) | 16.8 (62.2) | 18.7 (65.7) | 21.0 (69.8) | 23.1 (73.6) | 24.8 (76.6) | 21.3 (70.3) |
Daily mean °C (°F) | 21.0 (69.8) | 21.0 (69.8) | 19.5 (67.1) | 17.4 (63.3) | 15.0 (59.0) | 12.6 (54.7) | 11.8 (53.2) | 12.0 (53.6) | 13.4 (56.1) | 15.3 (59.5) | 17.6 (63.7) | 19.4 (66.9) | 16.3 (61.4) |
Mean daily minimum °C (°F) | 15.8 (60.4) | 16.1 (61.0) | 14.6 (58.3) | 12.2 (54.0) | 10.4 (50.7) | 8.4 (47.1) | 7.4 (45.3) | 7.1 (44.8) | 8.0 (46.4) | 9.6 (49.3) | 12.0 (53.6) | 13.9 (57.0) | 11.3 (52.3) |
Mean minimum °C (°F) | 12.6 (54.7) | 13.0 (55.4) | 11.1 (52.0) | 8.6 (47.5) | 7.0 (44.6) | 5.5 (41.9) | 4.7 (40.5) | 4.2 (39.6) | 4.8 (40.6) | 5.7 (42.3) | 8.1 (46.6) | 10.4 (50.7) | 4.2 (39.6) |
Record low °C (°F) | 8.5 (47.3) | 6.8 (44.2) | 7.1 (44.8) | 5.1 (41.2) | 3.0 (37.4) | 0.7 (33.3) | −0.3 (31.5) | 1.3 (34.3) | 0.1 (32.2) | 2.3 (36.1) | 4.1 (39.4) | 5.2 (41.4) | −0.3 (31.5) |
Average precipitation mm (inches) | 18.1 (0.71) | 16.6 (0.65) | 17.0 (0.67) | 21.0 (0.83) | 43.3 (1.70) | 60.3 (2.37) | 56.8 (2.24) | 51.0 (2.01) | 39.2 (1.54) | 28.0 (1.10) | 19.2 (0.76) | 17.3 (0.68) | 387.8 (15.26) |
Average precipitation days (≥ 1.0 mm) | 2.3 | 2.0 | 2.3 | 3.9 | 7.9 | 9.9 | 10.4 | 9.5 | 7.4 | 4.6 | 3.1 | 3.2 | 66.5 |
Average relative humidity (%) | 57.5 | 59.5 | 61.5 | 62.0 | 68.5 | 73.5 | 73.5 | 70.5 | 67.0 | 60.0 | 58.5 | 57.0 | 64.1 |
Average dew point °C (°F) | 12.6 (54.7) | 13.2 (55.8) | 12.3 (54.1) | 11.0 (51.8) | 9.9 (49.8) | 8.8 (47.8) | 8.0 (46.4) | 8.0 (46.4) | 8.8 (47.8) | 8.8 (47.8) | 10.2 (50.4) | 11.2 (52.2) | 10.2 (50.4) |
Source: Australian Bureau of Meteorology (1992-present normals and extremes) [16] |
Climate data for Oodnadatta (Köppen BWh) | |||||||||||||
---|---|---|---|---|---|---|---|---|---|---|---|---|---|
Month | Jan | Feb | Mar | Apr | May | Jun | Jul | Aug | Sep | Oct | Nov | Dec | Year |
Record high °C (°F) | 50.7 (123.3) | 46.8 (116.2) | 44.9 (112.8) | 42.1 (107.8) | 35.0 (95.0) | 32.8 (91.0) | 32.2 (90.0) | 36.5 (97.7) | 40.7 (105.3) | 45.4 (113.7) | 47.3 (117.1) | 48.3 (118.9) | 50.7 (123.3) |
Mean daily maximum °C (°F) | 38.4 (101.1) | 37.1 (98.8) | 33.8 (92.8) | 29.0 (84.2) | 23.7 (74.7) | 20.0 (68.0) | 19.8 (67.6) | 22.9 (73.2) | 27.6 (81.7) | 30.5 (86.9) | 34.1 (93.4) | 36.4 (97.5) | 29.4 (84.9) |
Daily mean °C (°F) | 31.1 (88.0) | 30.0 (86.0) | 26.6 (79.9) | 21.8 (71.2) | 16.9 (62.4) | 13.2 (55.8) | 12.9 (55.2) | 15.5 (59.9) | 20.0 (68.0) | 22.9 (73.2) | 26.7 (80.1) | 29.1 (84.4) | 22.2 (72.0) |
Mean daily minimum °C (°F) | 23.7 (74.7) | 22.9 (73.2) | 19.3 (66.7) | 14.9 (58.8) | 10.0 (50.0) | 6.3 (43.3) | 6.0 (42.8) | 8.0 (46.4) | 12.4 (54.3) | 15.3 (59.5) | 19.3 (66.7) | 21.8 (71.2) | 15.0 (59.0) |
Record low °C (°F) | 11.7 (53.1) | 12.8 (55.0) | 9.5 (49.1) | 3.8 (38.8) | 0.9 (33.6) | −2.6 (27.3) | −2.2 (28.0) | −0.3 (31.5) | 2.2 (36.0) | 5.1 (41.2) | 9.6 (49.3) | 11.3 (52.3) | −2.6 (27.3) |
Average precipitation mm (inches) | 29.2 (1.15) | 32.8 (1.29) | 10.4 (0.41) | 10.0 (0.39) | 7.1 (0.28) | 9.8 (0.39) | 9.4 (0.37) | 5.5 (0.22) | 9.9 (0.39) | 15.4 (0.61) | 17.8 (0.70) | 27.2 (1.07) | 185.2 (7.29) |
Average precipitation days (≥ 0.2 mm) | 2.8 | 3.2 | 2.4 | 2.1 | 2.4 | 2.9 | 2.8 | 1.8 | 3.1 | 4.1 | 4.1 | 4.7 | 36.3 |
Mean monthly sunshine hours | 337.9 | 315.0 | 313.1 | 273.0 | 244.9 | 231.0 | 254.2 | 275.9 | 291.0 | 316.2 | 321.0 | 341.0 | 3,514.2 |
Source: Australian Bureau of Meteorology [17] |
Climate data for Port Augusta (Köppen BWh/BSh) | |||||||||||||
---|---|---|---|---|---|---|---|---|---|---|---|---|---|
Month | Jan | Feb | Mar | Apr | May | Jun | Jul | Aug | Sep | Oct | Nov | Dec | Year |
Record high °C (°F) | 49.5 (121.1) | 48.1 (118.6) | 43.1 (109.6) | 40.3 (104.5) | 32.2 (90.0) | 27.0 (80.6) | 26.9 (80.4) | 32.8 (91.0) | 38.2 (100.8) | 42.9 (109.2) | 46.3 (115.3) | 48.5 (119.3) | 49.5 (121.1) |
Mean maximum °C (°F) | 43.3 (109.9) | 41.2 (106.2) | 37.4 (99.3) | 33.1 (91.6) | 26.1 (79.0) | 21.3 (70.3) | 21.7 (71.1) | 25.1 (77.2) | 31.5 (88.7) | 35.6 (96.1) | 39.6 (103.3) | 41.8 (107.2) | 43.3 (109.9) |
Mean daily maximum °C (°F) | 34.2 (93.6) | 32.9 (91.2) | 30.5 (86.9) | 26.8 (80.2) | 21.6 (70.9) | 18.0 (64.4) | 18.0 (64.4) | 20.0 (68.0) | 24.0 (75.2) | 27.2 (81.0) | 30.2 (86.4) | 32.3 (90.1) | 26.3 (79.4) |
Daily mean °C (°F) | 26.9 (80.4) | 25.8 (78.4) | 23.6 (74.5) | 19.9 (67.8) | 15.2 (59.4) | 11.9 (53.4) | 11.3 (52.3) | 12.7 (54.9) | 16.2 (61.2) | 19.5 (67.1) | 22.8 (73.0) | 24.9 (76.8) | 19.2 (66.6) |
Mean daily minimum °C (°F) | 19.5 (67.1) | 18.7 (65.7) | 16.7 (62.1) | 13.0 (55.4) | 8.7 (47.7) | 5.8 (42.4) | 4.6 (40.3) | 5.3 (41.5) | 8.4 (47.1) | 11.8 (53.2) | 15.3 (59.5) | 17.4 (63.3) | 12.1 (53.8) |
Mean minimum °C (°F) | 15.3 (59.5) | 14.8 (58.6) | 12.2 (54.0) | 8.5 (47.3) | 4.4 (39.9) | 0.6 (33.1) | 0.4 (32.7) | 1.0 (33.8) | 4.2 (39.6) | 7.3 (45.1) | 10.8 (51.4) | 13.0 (55.4) | 0.4 (32.7) |
Record low °C (°F) | 11.7 (53.1) | 6.8 (44.2) | 6.6 (43.9) | 4.2 (39.6) | −1.9 (28.6) | −4 (25) | −4.1 (24.6) | −4.5 (23.9) | 0.0 (32.0) | 2.2 (36.0) | 6.9 (44.4) | 7.7 (45.9) | −4.5 (23.9) |
Average precipitation mm (inches) | 14.1 (0.56) | 20.1 (0.79) | 12.6 (0.50) | 20.3 (0.80) | 16.9 (0.67) | 24.5 (0.96) | 17.0 (0.67) | 15.4 (0.61) | 17.6 (0.69) | 16.8 (0.66) | 22.1 (0.87) | 23.1 (0.91) | 220.5 (8.69) |
Average precipitation days (≥ 1.0 mm) | 1.7 | 1.5 | 2.0 | 2.0 | 3.6 | 4.4 | 3.6 | 3.7 | 2.9 | 2.6 | 3.1 | 2.8 | 33.9 |
Source: Australian Bureau of Meteorology (2001-present normals extremes) [18] |
The population of South Australia is over 1.7 million as of 2024, [19] with over 75% of the population concentrated in its capital city, Adelaide. [20] Other regional towns in the State include Mount Gambier, Whyalla, Victor Harbor and Murray Bridge. The indigenous population in South Australia amounts to around 43,000, as of the 2021 census, accounting for around 2.4% of the population, lower than the national percentage of 3.2%. [21] [22] Over 70% of the population were born in Australia, with other top responses being England, India and China, respectively. [23]
In federal elections, South Australia is split into 10 electoral districts, each nominating a House of Representatives member. [24] In state elections, South Australia is split into 47 electoral districts. [25]
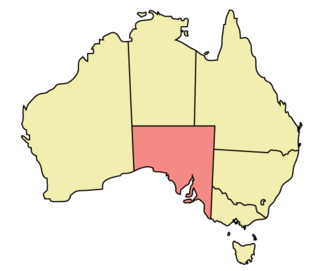
South Australia is a state in the southern central part of Australia. With a total land area of 984,321 square kilometres (380,048 sq mi), it is the fourth-largest of Australia's states and territories by area, which includes some of the most arid parts of the continent, and with 1.8 million people it is the fifth-largest of the states and territories by population. This population is the second-most highly centralised in the nation after Western Australia, with more than 77% of South Australians living in the capital Adelaide or its environs. Other population centres in the state are relatively small; Mount Gambier, the second-largest centre, has a population of 26,878.
Port Lincoln is a city on the Lower Eyre Peninsula in the Australian state of South Australia. Known as Galinyala by the traditional owners, the Barngarla people, it is situated on the shore of Boston Bay, which opens eastward into Spencer Gulf. It is the largest city in the West Coast region, and is located approximately 280 km (170 mi) from the state's capital city of Adelaide.
Port Augusta is a coastal city in South Australia about 310 kilometres (190 mi) by road from the state capital, Adelaide. Most of the city is on the eastern shores of Spencer Gulf, immediately south of the gulf's head, comprising the city's centre and surrounding suburbs, Stirling North, and seaside homes at Commissariat Point, Blanche Harbor and Miranda. The suburb of Port Augusta West is on the western side of the gulf on the Eyre Peninsula. Together, these localities had a population of 13,515 people in the 2021 census.
Farina, formerly Farina Town and originally Government Gums, is an abandoned town in the Australian state of South Australia. The name also applies to an area of about 8500 square kilometres in which the town is located. At the 2006 census, 55 people lived in the larger area; by the 2021 census, the population had fallen to 15.
William Creek, in the Outback region of the Australian state of South Australia, is an isolated township with a population of fewer than 20. It is located about half-way along the Oodnadatta Track, 210 km (130 mi) north-west of Marree and 166 km (103 mi) east of Coober Pedy.
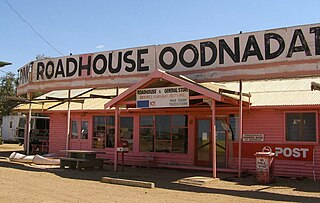
Oodnadatta is a small, remote outback town and locality in the Australian state of South Australia, located 1043 kilometres north-north-west of the state capital of Adelaide by road or 873 km (542 mi) direct, at an altitude of 112 metres. The unsealed Oodnadatta Track, an outback road popular with tourists, runs through the town.
Kimba is a rural service town on the Eyre Highway at the top of Eyre Peninsula in the Australian state of South Australia. There is an 8-metre (26 ft) tall statue of a galah beside the highway, marking halfway between the east and west coasts of Australia. The Gawler Ranges are north of the highway near the town.
Minlaton is a town in central Yorke Peninsula, South Australia. It is known as the "Barley capital of the world", due to the rich Barley production in the region.
Wudinna is a town of about 500 people on the Eyre Highway in the wheat-growing region of Eyre Peninsula, South Australia.
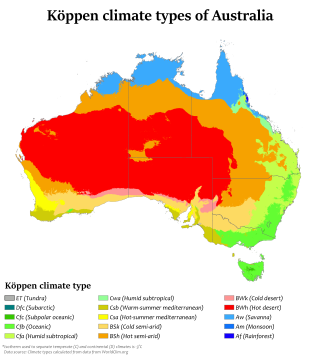
Australia's climate is governed mostly by its size and by the hot, sinking air of the subtropical high pressure belt. This moves north-west and north-east with the seasons. The climate is variable, with frequent droughts lasting several seasons, thought to be caused in part by the El Niño-Southern Oscillation. Australia has a wide variety of climates due to its large geographical size. The largest part of Australia is desert or semi-arid. Only the south-east and south-west corners have a temperate climate and moderately fertile soil. The northern part of the country has a tropical climate, varying between grasslands and desert. Australia holds many heat-related records: the continent has the hottest extended region year-round, the areas with the hottest summer climate, and the highest sunshine duration.
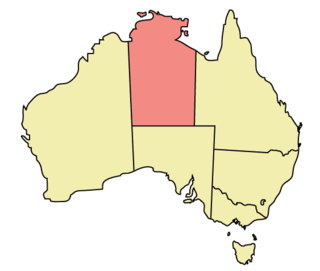
The Northern Territory (NT) occupies the north central part of the continent of Australia. The Northern Territory borders are to the west with Western Australia, the Western Australia border being near the 129° east longitude. The NT to the south with the South Australian border being the 26th parallel south latitude. To the east the NT with the Queensland border along the 138° east longitude.
Allendale East is a town and locality in the Australian state of South Australia located in the state's south-east about 391 kilometres (243 mi) south-east of the state capital of Adelaide and about 20 kilometres (12 mi) south of the municipal seat of Mount Gambier.
Nangwarry is a town and a locality in the Australian state of South Australia located about 352 kilometres (219 mi) south-east of the state capital of Adelaide and about 32 kilometres (20 mi) north-west of the regional centre of Mount Gambier.
Port Augusta West is a suburb of Port Augusta, South Australia.
The geography of Queensland in the north-east of Australia, is varied. It includes tropical islands, sandy beaches, flat river plains that flood after monsoon rains, tracts of rough, elevated terrain, dry deserts, rich agricultural belts and densely populated urban areas.
South Australia is an Australian state, situated in the southern central part of the country, and featuring some low-lying mountain ranges, the most significant being the Mount Lofty Ranges, which extend into the state's capital city, Adelaide, which comprises most of the state's population. Adelaide is situated on the eastern shores of Gulf St Vincent, on the Adelaide Plains, north of the Fleurieu Peninsula, between Gulf St Vincent and the low-lying Mount Lofty Ranges. The state of South Australia, which stretches along the coast of the continent and has boundaries with every other state in Australia, with the exception of the Australian Capital Territory and Tasmania. The Western Australia border has a history with South Australia, involving the South Australian Government Astronomer, Dodwell and the Western Australian Government Astronomer, Curlewis in the 1920s to mark the border on the ground.
Wandilo is a north-western suburb of Mount Gambier in the Australian state of South Australia. It was named after the railway station on the Mount Gambier railway line, and is recorded to mean "a swamp where native companions resort".
In South Australia, one of the states of Australia, there are many areas which are commonly known by regional names. Regions are areas that share similar characteristics. These characteristics may be natural such as the Murray River, the coastline, desert or mountains. Alternatively, the characteristics may be cultural, such as common land use. South Australia is divided by numerous sets of regional boundaries, based on different characteristics. In many cases boundaries defined by different agencies are coterminous.
Allandale Station is a locality in the Australian state of South Australia located about 848 kilometres (527 mi) north of the state capital of Adelaide and about 20 kilometres (12 mi) south-east of the town of Oodnadatta.