From the Spanish period until the arrival of the Americans, the Municipality of Quezon was only a small barrio of Aliaga, Nueva Ecija. This area was once a dense forest, while the open lands were grasslands thickly covered with cogon. In earlier times, the barrio was called El Toro because the area served as a pasture for cattle owned by a man named Joaquin Samson.
Under the leadership of the gobernadorcillo of Aliaga, the name El Toro was changed, and the place came to be known as Barrio Santo Niño.
The first settlers of the area came from the province of Ilocos, including the families of Simplina, Cruz, Quitan, Zuner, Sajor, Tubay, Nicolas, Capalungan, Duldulao, Lagasca, and Ignacio. They were later followed by Tagalog families from towns in the south, namely the Joson, Villasan, Samson, Magno, Domingo, Tolentino, Evangelista, Garcia, Da Jose, and Quijano families. Through their hard work and perseverance, they cleared the forests and hills and transformed them into agricultural lands.
On 15 November 1915, several prominent residents of Barrio Santo Niño united and petitioned for the barrio to be converted into a municipality. These individuals were Tomas Joson, Martin Villasan, Jose Cruz, Ariston Cebrero, Victor Domingo, Gaudencio Tolentino, Jose Jacinto, Pedro Capalungan, Florentino Da Jose, and Romualdo Quijano. At that time, Don Isauro Gabaldon was the representative of the province of Nueva Ecija to the Philippine Legislature, and with his assistance, their request was granted.
As a result, on 17 November 1917, Barrio Santo Niño officially became a municipality. It was named Quezon in honor of Manuel L. Quezon, who was then the Philippine Resident Commissioner to the United States and who also helped in the barrio’s elevation to municipal status. The first municipal mayor of Quezon was Martin Villasan, followed by Pedro Capalungan as the second mayor.
In its early years, the town of Quezon was visited by the parish priest of Aliaga to attend to the spiritual needs of its residents. Quezon became a full-fledged parish in 1929 and had its first parish priest in the person of Father Emilio Guttierez. The parish was placed under the patronage of the Holy Family.
Geography
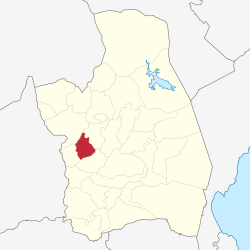
Quezon is located in the plains of Central Luzon, in the western portion of the province of Nueva Ecija. It is bounded by the municipalities of Aliaga to the south, Licab to the west, Guimba to the north, and Santo Domingo to the east.
Barangays
Quezon is politically subdivided into 16 barangays, as shown below. Each barangay consists of puroks and some have sitios.
A buffalo-drawn cart used for transporting farm goods in a rural community.
The primary source of livelihood in the Municipality of Quezon has traditionally been agriculture. Large portions of the town’s land are devoted to farming, with residents engaged in the cultivation of rice, corn, and other agricultural crops. Farming remains a major economic activity, providing both subsistence and income for many families.
In addition to crop production, some residents engage in livestock raising, including cattle, poultry, and swine, which supplement household income and support local food supply. Small-scale trading and retail businesses have also developed in the poblacion and nearby barangays, catering to the daily needs of the community.
Over time, employment opportunities expanded to include services, local government work, and labor in nearby municipalities. While agriculture continues to play a central role in the local economy, non-agricultural livelihoods have gradually increased as access to education, transportation, and markets improved.
Culture and Traditions
Festival
A Patimyas Ani Festival Dancer
The Municipality of Quezon celebrates the Patimyas Ani Festival annually on January 30 as part of the activities leading up to the town fiesta, which is observed on February 3. The festival forms an important component of the pre-fiesta celebrations of the municipality.
The Patimyas Ani Festival emphasizes the significance of agriculture in Quezon and honors the dedication of local farmers and agricultural workers. A major highlight of the celebration is the agriculture-inspired street dancing competition, participated in by students from various elementary schools in the municipality.
Participants wear colorful costumes and carry props made from indigenous and farm-related materials, representing the cultivation of rice, corn, and other agricultural products commonly grown in Quezon, Nueva Ecija. The performances portray both the richness of agricultural life and the challenges faced by the farming community.
The most recent titleholders of the street dancing competition have included Quezon Integrated School, San Andres I Integrated School, and Casanova Elementary School.
Roman Catholicism is the predominant religion in the Municipality of Quezon. The town is served by the Holy Family Parish, which is under the jurisdiction of the Diocese of San Jose (Nueva Ecija). Catholic beliefs and practices play a significant role in community life, closely tied to local traditions, celebrations, and social activities.
Immaculate Conception Chapel in Bertese
Several barangays also have notable patron saints and hold their own religious celebrations. For example, Saint Clare of Assisi is venerated in Brgy. Santa Clara, the Black Nazarene in Ilog Baliwag, and the Immaculate Conception in Bertese. These observances include fiestas, processions, and other devotional activities that strengthen community bonds.
The Quezon Schools District Office governs all educational institutions within the municipality. It oversees the management and operations of all private and public, from primary to secondary schools.[20]
Primary Schools
Bertese Elementary School
Casanova Elementary School
Doña Lucia Elementary School
Emmanuel Center of Learning Academy
Labong Elementary School
Osmena Elementary School
Pulong Bahay Elementary School
Ricardo L. Joson Elementary School
San Andres II Elementary School
San Manuel Elementary School
San Miguel Elementary School
Sta. Rita Elementary School
Sto. Cristo Elementary School
Sto. Tomas Feria Elementary School
Tomas Joson Elementary School
Secondary Schools
Eduardo L. Joson Memornial High School
Holy Family Academy of Quezon, Nueva Ecija, Inc.
Quezon Integrated School
San Alejandro Integrated School
San Andres I Integrated School
Solomon's Excellence Academy School
Gallery
Quezon Integrated SchoolHoly Family Academy of Quezon, Nueva Ecija, Inc.Tomas Joson Elementary School
This page is based on this Wikipedia article Text is available under the CC BY-SA 4.0 license; additional terms may apply. Images, videos and audio are available under their respective licenses.