This is a list of electoral district results for the 1924 Victorian state election.
Party | Candidate | Votes | % | ±% | |
---|---|---|---|---|---|
Labor | Gordon Webber | unopposed | |||
Labor hold | Swing | ||||
Party | Candidate | Votes | % | ±% | |
---|---|---|---|---|---|
Labor | Arthur Wallace | 7,262 | 61.6 | +8.3 | |
Nationalist | John Atkinson | 2,550 | 21.6 | −25.1 | |
Independent Liberal | Selwyn Neale | 1,748 | 14.8 | +14.8 | |
Independent Liberal | Thomas Craine | 2,550 | 1.9 | +1.9 | |
Total formal votes | 11,788 | 97.6 | −2.1 | ||
Informal votes | 286 | 2.4 | +2.1 | ||
Turnout | 12,074 | 59.1 | +5.8 | ||
Two-party-preferred result | |||||
Labor | Arthur Wallace | 63.3 | +10.0 | ||
Nationalist | John Atkinson | 36.7 | −10.0 | ||
Labor hold | Swing | +10.0 | |||
Party | Candidate | Votes | % | ±% | |
---|---|---|---|---|---|
Nationalist | Alexander Peacock | unopposed | |||
Nationalist hold | Swing | ||||
Party | Candidate | Votes | % | ±% | |
---|---|---|---|---|---|
Nationalist | Robert McGregor | 3,533 | 48.9 | −10.3 | |
Labor | William McAdam | 3,403 | 47.1 | +6.3 | |
Independent Labor | Alfred Elliott | 290 | 4.0 | +4.0 | |
Total formal votes | 7,226 | 98.7 | −0.5 | ||
Informal votes | 97 | 1.3 | +0.5 | ||
Turnout | 7,323 | 75.1 | +3.9 | ||
Two-party-preferred result | |||||
Labor | William McAdam | 3,613 | 50.0 | +9.2 | |
Nationalist | Robert McGregor | 3,609 | 50.0 | −9.2 | |
Labor gain from Nationalist | Swing | +9.2 | |||
Party | Candidate | Votes | % | ±% | |
---|---|---|---|---|---|
Nationalist | Matthew Baird | 4,286 | 57.5 | −9.7 | |
Labor | Mark Lazarus | 3,163 | 42.5 | +9.7 | |
Total formal votes | 7,449 | 99.4 | −0.2 | ||
Informal votes | 42 | 0.6 | +0.2 | ||
Turnout | 7,491 | 75.1 | +7.7 | ||
Nationalist hold | Swing | -9.7 | |||
Party | Candidate | Votes | % | ±% | |
---|---|---|---|---|---|
Nationalist | Edward Morley | 5,086 | 69.5 | +29.5 | |
Labor | Alicia Katz | 2,228 | 30.5 | +11.4 | |
Total formal votes | 7,314 | 99.3 | +0.8 | ||
Informal votes | 53 | 0.7 | −0.8 | ||
Turnout | 7,367 | 69.6 | +4.1 | ||
Nationalist hold | Swing | N/A | |||
Party | Candidate | Votes | % | ±% | |
---|---|---|---|---|---|
Country | John Carlisle | 2,397 | 61.6 | −3.2 | |
Nationalist | Alexander Mitchell | 1,494 | 38.4 | +3.2 | |
Total formal votes | 3,891 | 99.5 | +0.7 | ||
Informal votes | 19 | 0.5 | −0.7 | ||
Turnout | 3,910 | 55.0 | −2.4 | ||
Country hold | Swing | -3.2 | |||
Party | Candidate | Votes | % | ±% | |
---|---|---|---|---|---|
Nationalist | Henry Beardmore | 2,714 | 74.8 | −25.2 | |
Country | John Hall | 914 | 25.2 | +25.2 | |
Total formal votes | 3,627 | 99.3 | |||
Informal votes | 27 | 0.7 | |||
Turnout | 3,654 | 54.5 | |||
Nationalist hold | Swing | N/A | |||
Party | Candidate | Votes | % | ±% | |
---|---|---|---|---|---|
Labor | Luke Clough | 3,327 | 60.2 | +0.2 | |
Nationalist | John Michelsen | 2,202 | 39.8 | −0.2 | |
Total formal votes | 5,529 | 99.5 | +0.2 | ||
Informal votes | 28 | 0.5 | −0.2 | ||
Turnout | 5,557 | 67.7 | +5.8 | ||
Labor hold | Swing | +0.2 | |||
Party | Candidate | Votes | % | ±% | |
---|---|---|---|---|---|
Labor | Arthur Cook | 3,425 | 51.3 | +3.9 | |
Nationalist | Edwin Ham | 3,247 | 48.7 | −3.9 | |
Total formal votes | 6,672 | 99.1 | −0.4 | ||
Informal votes | 58 | 0.9 | +0.4 | ||
Turnout | 6,730 | 74.6 | +8.5 | ||
Labor gain from Nationalist | Swing | +3.9 | |||
Party | Candidate | Votes | % | ±% | |
---|---|---|---|---|---|
Nationalist | Edmund Greenwood | 17,670 | 63.1 | −36.9 | |
Independent Liberal | Philip Jacobs | 10,348 | 36.9 | +36.9 | |
Total formal votes | 28,018 | 99.6 | |||
Informal votes | 127 | 0.4 | |||
Turnout | 28,145 | 44.6 | |||
Nationalist hold | Swing | N/A | |||
Party | Candidate | Votes | % | ±% | |
---|---|---|---|---|---|
Country | David Allison | 1,901 | 51.2 | −1.4 | |
Country | Edwin Reseigh | 932 | 25.1 | +25.1 | |
Country | George Clyne | 878 | 23.7 | +23.7 | |
Total formal votes | 3,711 | 98.7 | −0.8 | ||
Informal votes | 51 | 1.3 | +0.8 | ||
Turnout | 3,762 | 47.9 | −23.9 | ||
Country hold | Swing | N/A | |||
Party | Candidate | Votes | % | ±% | |
---|---|---|---|---|---|
Australian Liberal | Oswald Snowball | 10,692 | 64.6 | +64.6 | |
Nationalist | Henry Crowther | 5,869 | 35.4 | −64.6 | |
Total formal votes | 16.561 | 99.5 | |||
Informal votes | 88 | 0.5 | |||
Turnout | 16,649 | 54.5 | |||
Member changed to Australian Liberal from Nationalist | Swing | N/A | |||
Party | Candidate | Votes | % | ±% | |
---|---|---|---|---|---|
Labor | James Jewell | unopposed | |||
Labor hold | Swing | ||||
Party | Candidate | Votes | % | ±% | |
---|---|---|---|---|---|
Labor | Ralph Hjorth | 3,301 | 45.6 | +45.6 | |
Nationalist | Andrew Robertson | 2,359 | 32.6 | −67.4 | |
Country | Henry Pickering | 1,577 | 21.8 | +21.8 | |
Total formal votes | 7,237 | 98.2 | |||
Informal votes | 133 | 1.8 | |||
Turnout | 7,370 | 62.4 | |||
Two-party-preferred result | |||||
Labor | Ralph Hjorth | 3,695 | 51.1 | +51.1 | |
Nationalist | Andrew Robertson | 3,542 | 48.9 | −51.1 | |
Labor gain from Nationalist | Swing | N/A | |||
Party | Candidate | Votes | % | ±% | |
---|---|---|---|---|---|
Labor | Robert Solly | unopposed | |||
Labor hold | Swing | ||||
Party | Candidate | Votes | % | ±% | |
---|---|---|---|---|---|
Nationalist | Harry Lawson | 3,075 | 68.0 | −6.2 | |
Labor | William Webber | 1,450 | 32.0 | +6.2 | |
Total formal votes | 4,525 | 99.8 | +0.3 | ||
Informal votes | 9 | 0.2 | −0.3 | ||
Turnout | 4,534 | 72.6 | +7.1 | ||
Nationalist hold | Swing | -6.2 | |||
Party | Candidate | Votes | % | ±% | |
---|---|---|---|---|---|
Labor | Tom Tunnecliffe | unopposed | |||
Labor hold | Swing | ||||
Party | Candidate | Votes | % | ±% | |
---|---|---|---|---|---|
Labor | Reg Pollard | 2,232 | 40.8 | +40.8 | |
Nationalist | Angus McNab | 1,796 | 32.9 | −67.1 | |
Country | Gerald McKenna | 1,438 | 26.3 | +26.3 | |
Total formal votes | 5,466 | 99.4 | |||
Informal votes | 36 | 0.6 | |||
Turnout | 5,502 | 82.1 | |||
Two-party-preferred result | |||||
Labor | Reg Pollard | 2,857 | 52.3 | +52.3 | |
Nationalist | Angus McNab | 2,609 | 47.7 | −52.3 | |
Labor gain from Nationalist | Swing | N/A | |||
Party | Candidate | Votes | % | ±% | |
---|---|---|---|---|---|
Nationalist | Frank Groves | 5,227 | 52.8 | −15.9 | |
Labor | Roy Beardsworth | 3,128 | 31.6 | +0.3 | |
Independent | Henry Harris | 1,545 | 15.6 | +15.6 | |
Total formal votes | 9,900 | 98.1 | −1.3 | ||
Informal votes | 193 | 1.9 | +1.3 | ||
Turnout | 10,093 | 51.7 | +6.0 | ||
Two-party-preferred result | |||||
Nationalist | Frank Groves | 60.6 | −8.1 | ||
Labor | Roy Beardsworth | 39.4 | +8.1 | ||
Nationalist hold | Swing | -8.1 | |||
Party | Candidate | Votes | % | ±% | |
---|---|---|---|---|---|
Labor | James McDonald | 2,668 | 52.3 | +10.4 | |
Nationalist | Roderick McLeod | 2,435 | 47.7 | −10.4 | |
Total formal votes | 5,103 | 99.7 | +0.1 | ||
Informal votes | 17 | 0.3 | −0.1 | ||
Turnout | 5,120 | 82.8 | +20.7 | ||
Labor gain from Nationalist | Swing | +10.4 | |||
Party | Candidate | Votes | % | ±% | |
---|---|---|---|---|---|
Labor | Bill Slater | 3,282 | 54.0 | −5.5 | |
Nationalist | Albert Borella | 2,795 | 46.0 | +5.5 | |
Total formal votes | 6,077 | 99.8 | +0.8 | ||
Informal votes | 15 | 0.2 | −0.8 | ||
Turnout | 6,092 | 73.8 | +4.9 | ||
Labor hold | Swing | -5.5 | |||
Party | Candidate | Votes | % | ±% | |
---|---|---|---|---|---|
Country | Albert Dunstan | 2,747 | 83.4 | +46.1 | |
Nationalist | Albert Hodsworth | 546 | 16.6 | −4.7 | |
Total formal votes | 3,293 | 99.5 | +1.4 | ||
Informal votes | 16 | 0.5 | −1.4 | ||
Turnout | 3,309 | 56.5 | −20.0 | ||
Country hold | Swing | N/A | |||
Party | Candidate | Votes | % | ±% | |
---|---|---|---|---|---|
Labor | George Hooper | 2,625 | 47.5 | +1.8 | |
Australian Liberal | Alfred Farthing | 2,542 | 46.0 | +46.0 | |
Independent | William Carnegie | 363 | 6.5 | +6.5 | |
Total formal votes | 5,530 | 97.2 | −2.2 | ||
Informal votes | 161 | 2.8 | +2.2 | ||
Turnout | 5,691 | 52.0 | +9.4 | ||
Two-candidate-preferred result | |||||
Australian Liberal | Alfred Farthing | 2,826 | 51.1 | +51.1 | |
Labor | George Hooper | 2,704 | 48.9 | +3.2 | |
Australian Liberal gain from Nationalist | Swing | N/A | |||
Party | Candidate | Votes | % | ±% | |
---|---|---|---|---|---|
Labor | Frank Keane | 12,375 | 55.0 | +10.9 | |
Nationalist | Thomas Ryan | 10,106 | 45.0 | −10.9 | |
Total formal votes | 22,481 | 99.6 | −0.1 | ||
Informal votes | 96 | 0.4 | +0.1 | ||
Turnout | 22,577 | 61.0 | +2.9 | ||
Labor gain from Nationalist | Swing | +10.9 | |||
Party | Candidate | Votes | % | ±% | |
---|---|---|---|---|---|
Australian Liberal | William Everard | 4,553 | 77.6 | +77.6 | |
Nationalist | Herbert Hewitt | 1,317 | 22.4 | −58.6 | |
Total formal votes | 5,870 | 99.4 | 0.0 | ||
Informal votes | 34 | 0.6 | 0.0 | ||
Turnout | 5,904 | 48.3 | +1.0 | ||
Australian Liberal gain from Nationalist | Swing | N/A | |||
Party | Candidate | Votes | % | ±% | |
---|---|---|---|---|---|
Labor | John Billson | unopposed | |||
Labor hold | Swing | ||||
Party | Candidate | Votes | % | ±% | |
---|---|---|---|---|---|
Labor | Edward Warde | unopposed | |||
Labor hold | Swing | ||||
Party | Candidate | Votes | % | ±% | |
---|---|---|---|---|---|
Labor | William Brownbill | 6,197 | 55.6 | +0.8 | |
Nationalist | Thomas Maltby | 4,943 | 44.4 | −0.8 | |
Total formal votes | 11,140 | 99.7 | +0.4 | ||
Informal votes | 37 | 0.3 | −0.4 | ||
Turnout | 11,177 | 72.5 | +7.3 | ||
Labor hold | Swing | +0.8 | |||
Party | Candidate | Votes | % | ±% | |
---|---|---|---|---|---|
Country | Albert Lind | unopposed | |||
Country hold | Swing | ||||
Party | Candidate | Votes | % | ±% | |
---|---|---|---|---|---|
Independent Labor | James McLachlan | 4,533 | 70.6 | −7.3 | |
Labor | David O'Donnell | 1,401 | 21.8 | −0.3 | |
Country | Matthew Boland | 484 | 7.5 | +7.5 | |
Total formal votes | 6,481 | 99.0 | −0.2 | ||
Informal votes | 68 | 1.0 | +0.2 | ||
Turnout | 6,486 | 68.0 | +8.8 | ||
Two-candidate-preferred result | |||||
Independent Labor | James McLachlan | 77.9 | 0.0 | ||
Labor | David O'Donnell | 22.1 | 0.0 | ||
Independent Labor hold | Swing | 0.0 | |||
Party | Candidate | Votes | % | ±% | |
---|---|---|---|---|---|
Nationalist | Walter West | unopposed | |||
Nationalist hold | Swing | ||||
Party | Candidate | Votes | % | ±% | |
---|---|---|---|---|---|
Country | Arthur Walter | 2,830 | 47.6 | +47.6 | |
Nationalist | Ernest Bremner | 1,602 | 27.0 | −73.0 | |
Labor | John McKellar | 1,510 | 25.4 | +25.4 | |
Total formal votes | 5,942 | 99.1 | |||
Informal votes | 53 | 0.9 | |||
Turnout | 5,995 | 63.9 | |||
Two-candidate-preferred result | |||||
Country | Arthur Walter | 3,966 | 66.8 | +66.8 | |
Nationalist | Ernest Bremner | 1,976 | 33.2 | −66.8 | |
Country gain from Nationalist | Swing | N/A | |||
Party | Candidate | Votes | % | ±% | |
---|---|---|---|---|---|
Labor | William Thomas | 3,465 | 50.9 | −2.2 | |
Nationalist | Hugh MacLeod | 2,555 | 37.5 | −9.4 | |
Country | Charles Waters | 787 | 11.6 | +11.6 | |
Total formal votes | 6,807 | 98.5 | −1.0 | ||
Informal votes | 106 | 1.5 | +1.0 | ||
Turnout | 6,913 | 76.6 | +1.3 | ||
Two-party-preferred result | |||||
Labor | William Thomas | 52.1 | −1.0 | ||
Nationalist | Hugh MacLeod | 47.9 | +1.0 | ||
Labor hold | Swing | -1.0 | |||
Party | Candidate | Votes | % | ±% | |
---|---|---|---|---|---|
Country | Murray Bourchier | unopposed | |||
Country hold | Swing | ||||
Party | Candidate | Votes | % | ±% | |
---|---|---|---|---|---|
Labor | Arthur Hughes | 1,735 | 54.8 | +10.2 | |
Country | David Gibson | 792 | 25.0 | +0.7 | |
Nationalist | George Burchett | 638 | 20.2 | −10.1 | |
Total formal votes | 3,165 | 98.5 | −0.5 | ||
Informal votes | 47 | 1.5 | +0.5 | ||
Turnout | 3,212 | 75.5 | +0.6 | ||
Two-party-preferred result | |||||
Labor | Arthur Hughes | 56.8 | +1.7 | ||
Country | David Gibson | 43.2 | +43.2 | ||
Labor hold | Swing | +1.7 | |||
Party | Candidate | Votes | % | ±% | |
---|---|---|---|---|---|
Australian Liberal | Henry Angus | 3,289 | 55.2 | +55.2 | |
Country | William McCann | 2,664 | 44.8 | +1.2 | |
Total formal votes | 5,953 | 98.9 | −0.5 | ||
Informal votes | 64 | 1.1 | +0.5 | ||
Turnout | 6,017 | 65.6 | −3.7 | ||
Australian Liberal gain from Nationalist | Swing | N/A | |||
Party | Candidate | Votes | % | ±% | |
---|---|---|---|---|---|
Nationalist | David Oman | 3,860 | 60.6 | +5.4 | |
Labor | John Coustley | 2,509 | 39.4 | +12.7 | |
Total formal votes | 6,369 | 99.3 | +0.8 | ||
Informal votes | 45 | 0.7 | −0.8 | ||
Turnout | 6,414 | 55.4 | −5.3 | ||
Nationalist hold | Swing | -8.2 | |||
Party | Candidate | Votes | % | ±% | |
---|---|---|---|---|---|
Nationalist | William McPherson | 9,576 | 50.6 | −49.4 | |
Labor | Edward Cummins | 6,545 | 34.6 | +34.6 | |
Independent Liberal | Horace Mason | 2,812 | 14.8 | +14.8 | |
Total formal votes | 18,933 | 98.6 | |||
Informal votes | 275 | 1.4 | |||
Turnout | 19,208 | 59.8 | |||
Two-party-preferred result | |||||
Nationalist | William McPherson | 63.9 | −36.1 | ||
Labor | Edward Cummins | 36.1 | +36.1 | ||
Nationalist hold | Swing | N/A | |||
Party | Candidate | Votes | % | ±% | |
---|---|---|---|---|---|
Labor | John Cain | 14,927 | 65.2 | +10.7 | |
Nationalist | Philip Mayer | 7,949 | 34.8 | −10.7 | |
Total formal votes | 22,876 | 99.7 | +0.1 | ||
Informal votes | 75 | 0.3 | −0.1 | ||
Turnout | 22,951 | 55.2 | +4.2 | ||
Labor hold | Swing | +10.7 | |||
Party | Candidate | Votes | % | ±% | |
---|---|---|---|---|---|
Nationalist | John Pennington | unopposed | |||
Nationalist hold | Swing | ||||
Party | Candidate | Votes | % | ±% | |
---|---|---|---|---|---|
Country | Isaac Weaver | 2,791 | 67.5 | +5.6 | |
Nationalist | John O'Brien | 1,342 | 32.5 | −5.6 | |
Total formal votes | 4,133 | 99.7 | +0.3 | ||
Informal votes | 12 | 0.3 | −0.3 | ||
Turnout | 4,145 | 63.6 | −3.8 | ||
Country hold | Swing | +5.6 | |||
Party | Candidate | Votes | % | ±% | |
---|---|---|---|---|---|
Country | Marcus Wettenhall | 2,959 | 42.9 | −7.3 | |
Nationalist | James Menzies | 2,400 | 34.8 | −14.8 | |
Country | Harold Glowrey | 1,152 | 16.7 | +16.7 | |
Nationalist | William Bolwell | 392 | 5.7 | +5.7 | |
Total formal votes | 6,903 | 98.5 | +0.8 | ||
Informal votes | 107 | 1.5 | −0.8 | ||
Turnout | 7,010 | 66.9 | −2.8 | ||
Two-candidate-preferred result | |||||
Country | Marcus Wettenhall | 3,877 | 56.2 | +6.0 | |
Nationalist | James Menzies | 3,026 | 43.8 | −6.0 | |
Country hold | Swing | +6.0 | |||
Party | Candidate | Votes | % | ±% | |
---|---|---|---|---|---|
Labor | George Frost | 3,207 | 68.3 | +12.3 | |
Independent Liberal | Thomas Richards | 1,488 | 31.7 | +31.7 | |
Total formal votes | 4,695 | 99.4 | −0.2 | ||
Informal votes | 31 | 0.6 | +0.2 | ||
Turnout | 4,726 | 74.3 | −2.0 | ||
Labor hold | Swing | N/A | |||
Party | Candidate | Votes | % | ±% | |
---|---|---|---|---|---|
Labor | Tom Hayes | 3,385 | 76.7 | −23.3 | |
Nationalist | Wilfred Kent Hughes | 1,030 | 23.3 | +23.3 | |
Total formal votes | 4,415 | 99.5 | |||
Informal votes | 23 | 0.5 | |||
Turnout | 4,438 | 57.3 | |||
Labor hold | Swing | N/A | |||
Party | Candidate | Votes | % | ±% | |
---|---|---|---|---|---|
Labor | William Dowling | 3,733 | 41.2 | +41.2 | |
Country | Alfred Downward | 2,298 | 25.4 | −22.0 | |
Nationalist | Frederick Hagelthorn | 1,019 | 11.2 | −20.6 | |
Country | Milton Wettenhall | 843 | 9.3 | +9.3 | |
Independent | William Easton | 820 | 9.0 | +9.0 | |
Independent | Percy Thompson | 347 | 3.8 | +3.8 | |
Total formal votes | 9,060 | 96.5 | −1.0 | ||
Informal votes | 328 | 3.5 | +1.0 | ||
Turnout | 9,388 | 55.0 | +7.1 | ||
Two-party-preferred result | |||||
Country | Alfred Downward | 4,865 | 53.7 | +1.6 | |
Labor | William Dowling | 4,195 | 46.3 | +46.3 | |
Country hold | Swing | N/A | |||
Party | Candidate | Votes | % | ±% | |
---|---|---|---|---|---|
Labor | George Prendergast | unopposed | |||
Labor hold | Swing | ||||
Party | Candidate | Votes | % | ±% | |
---|---|---|---|---|---|
Australian Liberal | Alfred Billson | 1,986 | 56.4 | +56.4 | |
Labor | John Price | 1,533 | 43.6 | +43.6 | |
Total formal votes | 3,519 | 98.8 | |||
Informal votes | 43 | 1.2 | |||
Turnout | 3,562 | 73.0 | |||
Australian Liberal gain from Nationalist | Swing | N/A | |||
Party | Candidate | Votes | % | ±% | |
---|---|---|---|---|---|
Nationalist | James McDonald | 4,112 | 56.1 | −3.2 | |
Labor | William Nichol | 3,217 | 43.9 | +3.2 | |
Total formal votes | 7,329 | 99.7 | +0.3 | ||
Informal votes | 26 | 0.3 | −0.3 | ||
Turnout | 7,355 | 64.0 | −0.6 | ||
Nationalist hold | Swing | -3.2 | |||
Party | Candidate | Votes | % | ±% | |
---|---|---|---|---|---|
Labor | Henry Bailey | unopposed | |||
Labor hold | Swing | ||||
Party | Candidate | Votes | % | ±% | |
---|---|---|---|---|---|
Labor | James Murphy | unopposed | |||
Labor hold | Swing | ||||
Party | Candidate | Votes | % | ±% | |
---|---|---|---|---|---|
Labor | Arthur Jackson | 6,316 | 51.6 | +2.6 | |
Nationalist | Richard Fetherston | 3,957 | 32.4 | −18.2 | |
Independent Liberal | Alfred Woodfull | 1,850 | 15.1 | +15.1 | |
Independent Labor | Harold Croughnan | 106 | 0.9 | +0.9 | |
Total formal votes | 12,229 | 97.6 | −1.7 | ||
Informal votes | 307 | 2.4 | +1.7 | ||
Turnout | 12,536 | 64.5 | +9.7 | ||
Two-party-preferred result | |||||
Labor | Arthur Jackson | 53.5 | +4.1 | ||
Nationalist | Richard Fetherston | 46.5 | −4.1 | ||
Labor gain from Nationalist | Swing | +4.1 | |||
Party | Candidate | Votes | % | ±% | |
---|---|---|---|---|---|
Labor | Ted Cotter | unopposed | |||
Labor hold | Swing | ||||
Party | Candidate | Votes | % | ±% | |
---|---|---|---|---|---|
Country | John Allan | 4,125 | 65.0 | +6.9 | |
Country | John Chanter | 2,216 | 35.0 | +35.0 | |
Total formal votes | 6,341 | 99.3 | +0.2 | ||
Informal votes | 43 | 0.7 | −0.2 | ||
Turnout | 6,384 | 57.0 | −9.1 | ||
Country hold | Swing | N/A | |||
Party | Candidate | Votes | % | ±% | |
---|---|---|---|---|---|
Nationalist | Frederic Eggleston | unopposed | |||
Nationalist hold | Swing | ||||
Party | Candidate | Votes | % | ±% | |
---|---|---|---|---|---|
Nationalist | Richard Toutcher | 3,331 | 56.8 | −0.4 | |
Labor | Francis Brophy | 2,533 | 43.2 | +0.4 | |
Total formal votes | 5,864 | 99.6 | +0.1 | ||
Informal votes | 21 | 0.4 | −0.1 | ||
Turnout | 5,885 | 74.4 | +5.7 | ||
Nationalist hold | Swing | -0.4 | |||
Party | Candidate | Votes | % | ±% | |
---|---|---|---|---|---|
Country | Francis Old | 5,347 | 52.4 | −20.7 | |
Labor | Edward Nicholls | 3,187 | 31.2 | +31.2 | |
Nationalist | Ernest Gray | 1,663 | 16.3 | −10.6 | |
Total formal votes | 10,197 | 98.0 | −0.9 | ||
Informal votes | 211 | 2.0 | +0.9 | ||
Turnout | 10,408 | 48.5 | 0.0 | ||
Two-party-preferred result | |||||
Country | Francis Old | 66.2 | −6.9 | ||
Labor | Edward Nicholls | 33.8 | +33.8 | ||
Country hold | Swing | N/A | |||
Party | Candidate | Votes | % | ±% | |
---|---|---|---|---|---|
Nationalist | Stanley Argyle | 7,741 | 66.9 | −33.1 | |
Labor | Charles Cope | 3,826 | 33.1 | +33.1 | |
Total formal votes | 11,567 | 99.2 | |||
Informal votes | 89 | 0.8 | |||
Turnout | 11,656 | 47.7 | |||
Nationalist hold | Swing | N/A | |||
Party | Candidate | Votes | % | ±% | |
---|---|---|---|---|---|
Labor | John Minogue | 2,137 | 38.3 | +4.4 | |
Country | Edwin Mackrell | 1,889 | 33.8 | 0.0 | |
Nationalist | Robert McAlpin | 1,556 | 27.9 | −4.4 | |
Total formal votes | 5,582 | 98.7 | +0.5 | ||
Informal votes | 73 | 1.3 | −0.5 | ||
Turnout | 5,655 | 72.9 | +7.8 | ||
Two-party-preferred result | |||||
Country | Edwin Mackrell | 3,257 | 58.3 | −3.4 | |
Labor | John Minogue | 2,325 | 41.7 | +3.4 | |
Country hold | Swing | -3.4 | |||
Party | Candidate | Votes | % | ±% | |
---|---|---|---|---|---|
Nationalist | Samuel Barnes | 2,219 | 53.4 | −46.6 | |
Labor | James Bermingham | 1,936 | 46.6 | +46.6 | |
Total formal votes | 4,155 | 99.5 | |||
Informal votes | 22 | 0.5 | |||
Turnout | 4,177 | 53.6 | |||
Nationalist hold | Swing | N/A | |||
Party | Candidate | Votes | % | ±% | |
---|---|---|---|---|---|
Country | John Bowser | unopposed | |||
Country hold | Swing | ||||
Party | Candidate | Votes | % | ±% | |
---|---|---|---|---|---|
Nationalist | John Gordon | unopposed | |||
Nationalist hold | Swing | ||||
Party | Candidate | Votes | % | ±% | |
---|---|---|---|---|---|
Labor | Edmond Hogan | unopposed | |||
Labor hold | Swing | ||||
Party | Candidate | Votes | % | ±% | |
---|---|---|---|---|---|
Nationalist | James Deany | 3,188 | 50.1 | −10.1 | |
Independent Labor | Harold Lawson | 2,288 | 36.0 | +36.0 | |
Labor | Laurence Bolton | 888 | 13.9 | −25.9 | |
Total formal votes | 6,364 | 99.3 | −0.2 | ||
Informal votes | 47 | 0.7 | +0.2 | ||
Turnout | 6,411 | 68.1 | +2.7 | ||
Two-party-preferred result | |||||
Nationalist | James Deany | 52.4 | −7.8 | ||
Independent Labor | Harold Lawson | 47.6 | +47.6 | ||
Nationalist hold | Swing | N/A | |||
Party | Candidate | Votes | % | ±% | |
---|---|---|---|---|---|
Labor | John Lemmon | unopposed | |||
Labor hold | Swing | ||||
The Liberal–National Coalition, commonly known simply as the Coalition or the LNP, is an alliance of centre-right to right-wing political parties that forms one of the two major groupings in Australian federal politics. The two partners in the Coalition are the Liberal Party of Australia and the National Party of Australia. Its main opponent is the Australian Labor Party (ALP); the two forces are often regarded as operating in a two-party system. The Coalition was last in government from 2013 to 2022. The group is led by Peter Dutton, who succeeded Scott Morrison after the 2022 federal election.
Edmond John "Ned" Hogan was an Australian politician who was the 30th Premier of Victoria. He was born in Wallace, Victoria, where his Irish-born parents were small farmers. After attending a Roman Catholic primary school, he became a farm worker and then a timber worker, and spent some time on the goldfields of Western Australia.
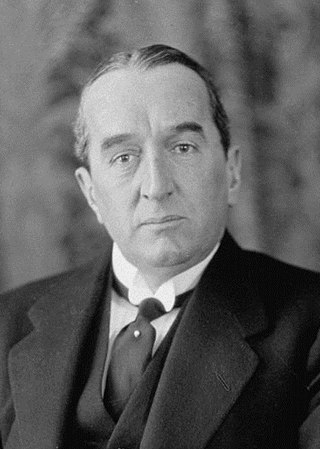
The 1925 Australian federal election was held in Australia on 14 November 1925. All 75 seats in the House of Representatives and 22 of the 36 seats in the Senate were up for election. The incumbent Nationalist–Country coalition, led by Prime Minister Stanley Bruce, defeated the opposition Labor Party led by Matthew Charlton in a landslide. This was the first time any party had won a fourth consecutive federal election.
The 1922 Australian federal election was held in Australia on 16 December 1922. All 75 seats in the House of Representatives, and 19 of the 36 seats in the Senate were up for election. The incumbent Nationalist Party, led by Prime Minister Billy Hughes lost its majority. However, the opposition Labor Party led by Matthew Charlton did not take office as the Nationalists sought a coalition with the fledgling Country Party led by Earle Page. The Country Party made Hughes's resignation the price for joining, and Hughes was replaced as Nationalist leader by Stanley Bruce.
Bendigo West is an electoral district of the Legislative Assembly in the Australian state of Victoria. It is a 1,524 square kilometres (588 sq mi) electorate centred on the city of Bendigo west of the Yungera railway line, and including surrounding rural towns to the west and south-west. It encompasses the localities of Bendigo City, California Gully, Castlemaine, Harcourt, Long Gully, Maldon, Marong, Newstead and West Bendigo. It also includes parts of the Bendigo suburbs of Eaglehawk, Golden Square and Kangaroo Flat. It lies within the Northern Victoria Region of the upper house, the Legislative Council.
Graham Travis Watt is an Australian politician. He was a member of the Victorian Legislative Assembly from 2010 to 2018, representing the seat of Burwood. He is a member of the Liberal Party.
This is a list of electoral results for the Electoral district of Benalla in Victorian state elections.
This is a list of electoral results for the district of Hawthorn in Victorian state elections.
The 1940 Argyllshire by-election was a parliamentary by-election for the British House of Commons constituency of Argyllshire, on 10 April 1940.
The 1917 Victorian state election was held in the Australian state of Victoria on Thursday 15 November 1917 for the state's Legislative Assembly. 51 of the 65 Legislative Assembly seats were contested.
Elections were held in the Australian state of Victoria on Saturday 21 June 1958 to elect 17 of the 34 members of the state's Legislative Council for six year terms. MLCs were elected in single-member provinces using preferential voting. This was the last time Legislative Council elections were held separately to those of the Legislative Assembly.
Elections were held in the Australian state of Victoria on Saturday 18 June 1955 to elect 17 of the 34 members of the state's Legislative Council for six year terms. MLCs were elected in single-member provinces using preferential voting.
Elections were held in the Australian state of Victoria on Saturday 21 June 1952 to elect 17 of the 34 members of the state's Legislative Council for six year terms. MLCs were elected in single-member provinces using preferential voting.
The Victorian Labor Party, officially known as the Australian Labor Party and commonly referred to simply as Victorian Labor, is the Victorian state branch of the Australian Labor Party (ALP). Victorian Labor forms the incumbent government in the state of Victoria and is led by Jacinta Allan, who has served concurrently as Premier of Victoria since 2023.
This is a list of electoral district results for the 1921 Victorian state election.
This is a list of electoral district results for the Victorian 1958 election.
This is a list of electoral district results for the Victorian 1940 election.
This is a list of electoral district results for the 1920 Victorian state election.
This is a list of electoral district results for the 1917 Victorian state election.
This is a list of electoral results for the electoral district of Grant in Victorian state elections.