This is a list of House of Assembly results for the 1989 South Australian state election.
Party | Candidate | Votes | % | ±% | |
---|---|---|---|---|---|
Liberal | Michael Armitage | 8,290 | 48.6 | +1.4 | |
Labor | Mike Duigan | 6,777 | 38.9 | −8.3 | |
Democrats | Peter Mann | 1,626 | 9.5 | +4.0 | |
Call to Australia | Howard Shepherd | 353 | 2.0 | +2.0 | |
Total formal votes | 17,046 | 98.0 | +0.7 | ||
Informal votes | 347 | 2.0 | −0.7 | ||
Turnout | 17,393 | 92.5 | +3.1 | ||
Two-party-preferred result | |||||
Liberal | Michael Armitage | 9,090 | 53.3 | +3.9 | |
Labor | Mike Duigan | 7,956 | 46.7 | −3.9 | |
Liberal gain from Labor | Swing | +3.9 |
Party | Candidate | Votes | % | ±% | |
---|---|---|---|---|---|
Labor | Kevin Hamilton | 10,572 | 53.8 | −6.3 | |
Liberal | Roger Hayes | 7,537 | 38.4 | +2.8 | |
Democrats | Jim Mitchell | 1,522 | 7.8 | +3.5 | |
Total formal votes | 19,631 | 97.2 | +0.3 | ||
Informal votes | 560 | 2.8 | −0.3 | ||
Turnout | 20,191 | 94.8 | +0.6 | ||
Two-party-preferred result | |||||
Labor | Kevin Hamilton | 11,398 | 58.1 | −4.8 | |
Liberal | Roger Hayes | 8,232 | 41.9 | +4.8 | |
Labor hold | Swing | −4.8 |
Party | Candidate | Votes | % | ±% | |
---|---|---|---|---|---|
Liberal | Ted Chapman | 12,200 | 59.2 | +3.2 | |
Labor | Jacqueline Horton | 5,286 | 25.6 | −3.9 | |
Democrats | Judith Logan | 3,132 | 15.2 | +8.4 | |
Total formal votes | 20,618 | 97.9 | +3.0 | ||
Informal votes | 437 | 2.1 | −3.0 | ||
Turnout | 21,055 | 95.2 | +0.3 | ||
Two-party-preferred result | |||||
Liberal | Ted Chapman | 13,599 | 66.0 | +0.8 | |
Labor | Jacqueline Horton | 7,019 | 34.0 | −0.8 | |
Liberal hold | Swing | +0.8 |
Party | Candidate | Votes | % | ±% | |
---|---|---|---|---|---|
Labor | Don Hopgood | 9,809 | 48.3 | −11.9 | |
Liberal | Pamela Howard | 7,349 | 36.2 | +3.3 | |
Democrats | Nicholas Wedge | 2,466 | 12.2 | +7.2 | |
Independent | Lyall McDonald | 663 | 3.3 | +3.3 | |
Total formal votes | 20,287 | 96.6 | +0.4 | ||
Informal votes | 722 | 3.4 | −0.4 | ||
Turnout | 21,009 | 93.9 | +2.0 | ||
Two-party-preferred result | |||||
Labor | Don Hopgood | 11,173 | 55.1 | −8.6 | |
Liberal | Pamela Howard | 9,114 | 44.9 | +8.6 | |
Labor hold | Swing | −8.6 |
Party | Candidate | Votes | % | ±% | |
---|---|---|---|---|---|
Liberal | Graham Ingerson | 11,585 | 63.8 | −1.3 | |
Labor | Jennifer Richardson | 4,070 | 22.4 | −7.1 | |
Democrats | Margaret-Ann Williams | 2,502 | 13.8 | +8.4 | |
Total formal votes | 18,157 | 98.3 | +0.3 | ||
Informal votes | 316 | 1.7 | −0.3 | ||
Turnout | 18,473 | 92.8 | +0.9 | ||
Two-party-preferred result | |||||
Liberal | Graham Ingerson | 12,711 | 70.0 | +2.5 | |
Labor | Jennifer Richardson | 5,446 | 30.0 | −2.5 | |
Liberal hold | Swing | +2.5 |
Party | Candidate | Votes | % | ±% | |
---|---|---|---|---|---|
Labor | Mike Rann | 10,112 | 55.4 | −1.2 | |
Liberal | Terry Stuart | 5,912 | 32.4 | +5.0 | |
Democrats | Colin Maas | 2,232 | 12.2 | +7.5 | |
Total formal votes | 18,256 | 97.3 | +1.4 | ||
Informal votes | 514 | 2.7 | −1.4 | ||
Turnout | 18,770 | 94.7 | +1.9 | ||
Two-party-preferred result | |||||
Labor | Mike Rann | 11,278 | 61.8 | −5.6 | |
Liberal | Terry Stuart | 6,978 | 38.2 | +5.6 | |
Labor hold | Swing | −5.6 |
Party | Candidate | Votes | % | ±% | |
---|---|---|---|---|---|
Liberal | Wayne Matthew | 8,911 | 44.8 | −2.0 | |
Labor | Derek Robertson | 8,345 | 41.9 | −7.6 | |
Democrats | Ingrid O'Sullivan | 2,223 | 11.2 | +7.5 | |
Call to Australia | Wayne Ellis | 417 | 2.1 | +2.1 | |
Total formal votes | 19,896 | 98.0 | +0.1 | ||
Informal votes | 408 | 2.0 | −0.1 | ||
Turnout | 20,304 | 95.8 | +0.5 | ||
Two-party-preferred result | |||||
Liberal | Wayne Matthew | 10,139 | 51.0 | +2.6 | |
Labor | Derek Robertson | 9,757 | 49.0 | −2.6 | |
Liberal gain from Labor | Swing | +2.6 |
Party | Candidate | Votes | % | ±% | |
---|---|---|---|---|---|
Liberal | Peter Arnold | 10,716 | 58.6 | −4.9 | |
Labor | William Parsons | 4,427 | 24.2 | −7.3 | |
Democrats | Mark Lobban | 2,117 | 11.6 | +6.7 | |
Independent | Rowland Beech | 1,026 | 5.6 | +5.6 | |
Total formal votes | 18,286 | 97.2 | −0.4 | ||
Informal votes | 535 | 2.8 | +0.4 | ||
Turnout | 18,821 | 92.0 | +2.1 | ||
Two-party-preferred result | |||||
Liberal | Peter Arnold | 12,921 | 70.7 | +4.4 | |
Labor | William Parsons | 12,921 | 29.3 | −4.4 | |
Liberal hold | Swing | +4.4 |
Party | Candidate | Votes | % | ±% | |
---|---|---|---|---|---|
Liberal | Jennifer Cashmore | 9,851 | 56.9 | +2.2 | |
Labor | Rohan Claessen | 5,345 | 30.8 | −7.7 | |
Democrats | Pam Kelly | 2,133 | 12.3 | +6.4 | |
Total formal votes | 17,329 | 97.6 | +1.0 | ||
Informal votes | 424 | 2.4 | −1.0 | ||
Turnout | 17,753 | 95.3 | +1.5 | ||
Two-party-preferred result | |||||
Liberal | Jennifer Cashmore | 10,928 | 63.1 | +4.7 | |
Labor | Rohan Claessen | 6,401 | 36.9 | −4.7 | |
Liberal hold | Swing | +4.7 |
Party | Candidate | Votes | % | ±% | |
---|---|---|---|---|---|
Liberal | John Olsen | 10,525 | 61.6 | −1.4 | |
Labor | Charles Greeneklee | 4,337 | 25.4 | −5.6 | |
Democrats | Harm Folkers | 998 | 5.8 | −0.2 | |
National | Grantley Siviour | 637 | 3.7 | +3.7 | |
Call to Australia | Bruce Slee | 594 | 3.5 | +3.5 | |
Total formal votes | 17,091 | 97.4 | −0.2 | ||
Informal votes | 454 | 2.6 | +0.2 | ||
Turnout | 17,545 | 95.0 | −0.2 | ||
Two-party-preferred result | |||||
Liberal | John Olsen | 11,983 | 70.1 | +3.8 | |
Labor | Charles Greeneklee | 5,108 | 29.9 | −3.8 | |
Liberal hold | Swing | +3.8 |
Party | Candidate | Votes | % | ±% | |
---|---|---|---|---|---|
Liberal | Stan Evans | 10,146 | 55.8 | +15.2 | |
Labor | Bruce Whyatt | 4,176 | 23.0 | −2.0 | |
Democrats | Judy Smith | 3,451 | 19.0 | +14.9 | |
Independent | Lorraine Foster | 399 | 2.2 | +2.2 | |
Total formal votes | 18,172 | 98.4 | +0.2 | ||
Informal votes | 288 | 1.6 | −0.2 | ||
Turnout | 18,460 | 94.6 | +0.9 | ||
Two-party-preferred result | |||||
Liberal | Stan Evans | 11,983 | 65.9 | −3.4 | |
Labor | Bruce Whyatt | 6,189 | 34.1 | +3.4 | |
Liberal hold | Swing | −3.4 |
Party | Candidate | Votes | % | ±% | |
---|---|---|---|---|---|
Independent | Martyn Evans | 5,884 | 40.2 | +4.0 | |
Labor | Catherine Watkins | 3,972 | 27.1 | −15.9 | |
Liberal | Peter Bates | 3,106 | 21.2 | +3.4 | |
Democrats | Stephen Perkins | 864 | 5.9 | +2.9 | |
Call to Australia | David Griffiths | 430 | 2.9 | +2.9 | |
Independent | Arnold Ollivier | 393 | 2.7 | +2.7 | |
Total formal votes | 14,649 | 95.5 | −0.6 | ||
Informal votes | 688 | 4.5 | +0.6 | ||
Turnout | 15,337 | 94.1 | −2.0 | ||
Two-party-preferred result | |||||
Labor | Catherine Watkins | 10,109 | 69.0 | −4.0 | |
Liberal | Peter Bates | 4,540 | 31.0 | +4.0 | |
Two-candidate-preferred result | |||||
Independent | Martyn Evans | 9,823 | 67.1 | +13.1 | |
Labor | Catherine Watkins | 4,826 | 32.9 | −13.1 | |
Independent hold | Swing | +13.1 |
Party | Candidate | Votes | % | ±% | |
---|---|---|---|---|---|
Liberal | Graham Gunn | 9,745 | 62.0 | −1.8 | |
Labor | Gregory Giddens | 4,273 | 27.2 | −4.6 | |
Democrats | Jack Babbage | 1,088 | 6.9 | +2.5 | |
National | Jillian Anderson | 600 | 3.8 | +3.8 | |
Total formal votes | 15,706 | 97.3 | +1.7 | ||
Informal votes | 435 | 2.7 | −1.7 | ||
Turnout | 16,141 | 89.2 | +0.3 | ||
Two-party-preferred result | |||||
Liberal | Graham Gunn | 10,777 | 68.6 | +2.8 | |
Labor | Gregory Giddens | 4,929 | 31.4 | −2.8 | |
Liberal hold | Swing | +2.8 |
Party | Candidate | Votes | % | ±% | |
---|---|---|---|---|---|
Liberal | Bob Such | 11,653 | 46.4 | −0.5 | |
Labor | Philip Tyler | 10,238 | 40.8 | −7.6 | |
Democrats | Terry Clark | 2,346 | 9.3 | +4.6 | |
Call to Australia | John Watson | 511 | 2.0 | +2.0 | |
Independent | Alison Kent | 364 | 1.5 | +1.5 | |
Total formal votes | 25,112 | 97.8 | −0.3 | ||
Informal votes | 562 | 2.2 | +0.3 | ||
Turnout | 25,674 | 95.7 | +0.8 | ||
Two-party-preferred result | |||||
Liberal | Bob Such | 13,323 | 53.1 | +4.2 | |
Labor | Philip Tyler | 11,789 | 46.9 | −4.2 | |
Liberal gain from Labor | Swing | +4.2 |
Party | Candidate | Votes | % | ±% | |
---|---|---|---|---|---|
National | Peter Blacker | 8,241 | 48.3 | +8.9 | |
Liberal | Kieran Kelly | 6,148 | 36.1 | −2.6 | |
Labor | Terrence Krieg | 2,156 | 12.6 | −7.2 | |
Democrats | Trevor Blood | 510 | 3.0 | +0.8 | |
Total formal votes | 17,055 | 98.4 | +0.3 | ||
Informal votes | 283 | 1.6 | −0.3 | ||
Turnout | 17,338 | 94.7 | +0.7 | ||
Two-party-preferred result | |||||
National | Peter Blacker | 13,337 | 78.2 | +4.0 | |
Labor | Terrence Krieg | 3,718 | 21.8 | −4.0 | |
Two-candidate-preferred result | |||||
National | Peter Blacker | 10,392 | 60.9 | +2.6 | |
Liberal | Kieran Kelly | 6,663 | 39.1 | −2.6 | |
National hold | Swing | +2.6 |
Party | Candidate | Votes | % | ±% | |
---|---|---|---|---|---|
Labor | Bob Gregory | 9,591 | 44.4 | −11.1 | |
Liberal | Richard Luther | 8,650 | 40.1 | +0.8 | |
Democrats | Steve Bartholomew | 2,143 | 9.9 | +4.7 | |
Call to Australia | Cathryn Linedale | 740 | 3.4 | +3.4 | |
Independent | Deborah Moran | 474 | 2.2 | +2.2 | |
Total formal votes | 21,598 | 96.7 | −0.4 | ||
Informal votes | 729 | 3.3 | +0.4 | ||
Turnout | 22,327 | 95.6 | +0.6 | ||
Two-party-preferred result | |||||
Labor | Bob Gregory | 11,181 | 51.8 | −6.4 | |
Liberal | Richard Luther | 10,417 | 48.2 | +6.4 | |
Labor hold | Swing | −6.4 |
Party | Candidate | Votes | % | ±% | |
---|---|---|---|---|---|
Labor | Colin McKee | 8,177 | 49.8 | −10.8 | |
Liberal | Steven Beardon | 6,090 | 37.1 | +4.1 | |
Democrats | Stephen Swift | 2,156 | 13.1 | +6.7 | |
Total formal votes | 16,423 | 96.6 | +0.2 | ||
Informal votes | 570 | 3.4 | −0.2 | ||
Turnout | 16,993 | 95.3 | +0.9 | ||
Two-party-preferred result | |||||
Labor | Colin McKee | 9,293 | 56.6 | −7.6 | |
Liberal | Steven Beardon | 7,130 | 43.4 | +7.6 | |
Labor hold | Swing | −7.6 |
Party | Candidate | Votes | % | ±% | |
---|---|---|---|---|---|
Liberal | John Meier | 12,641 | 62.1 | +2.5 | |
Labor | Brenton Walker | 6,221 | 30.5 | −5.3 | |
Democrats | Derek Emery | 1,507 | 7.4 | +2.8 | |
Total formal votes | 20,369 | 97.8 | +0.4 | ||
Informal votes | 454 | 2.2 | −0.4 | ||
Turnout | 20,823 | 95.6 | +0.6 | ||
Two-party-preferred result | |||||
Liberal | John Meier | 13,518 | 66.4 | +4.0 | |
Labor | Brenton Walker | 6,851 | 33.6 | −4.0 | |
Liberal hold | Swing | +4.0 |
Party | Candidate | Votes | % | ±% | |
---|---|---|---|---|---|
Liberal | Heini Becker | 9,130 | 52.4 | +3.5 | |
Labor | Ian Peak | 6,863 | 39.4 | −8.0 | |
Democrats | Mary McEwen | 1,435 | 8.2 | +4.5 | |
Total formal votes | 17,428 | 97.6 | +0.3 | ||
Informal votes | 419 | 2.4 | −0.3 | ||
Turnout | 17,847 | 94.1 | +0.4 | ||
Two-party-preferred result | |||||
Liberal | Heini Becker | 9,779 | 56.1 | +5.2 | |
Labor | Ian Peak | 7,649 | 43.9 | −5.2 | |
Liberal hold | Swing | +5.2 |
Party | Candidate | Votes | % | ±% | |
---|---|---|---|---|---|
Labor | Terry Groom | 8,371 | 47.7 | −11.9 | |
Liberal | Joe Scalzi | 7,094 | 40.4 | +5.2 | |
Democrats | Arlyn Tombleson | 2,087 | 11.9 | +6.7 | |
Total formal votes | 17,552 | 96.4 | +0.5 | ||
Informal votes | 652 | 3.6 | −0.5 | ||
Turnout | 18,204 | 94.4 | +1.0 | ||
Two-party-preferred result | |||||
Labor | Terry Groom | 9,563 | 54.5 | −8.0 | |
Liberal | Joe Scalzi | 7,989 | 45.5 | +8.0 | |
Labor hold | Swing | −8.0 |
Party | Candidate | Votes | % | ±% | |
---|---|---|---|---|---|
Liberal | Mark Brindal | 7,266 | 43.6 | −1.0 | |
Labor | June Appleby | 7,115 | 42.7 | −7.4 | |
Democrats | Elizabeth Williams | 1,556 | 9.3 | +4.1 | |
Call to Australia | Reg Macey | 450 | 2.7 | +2.7 | |
Independent | Mary Down | 289 | 1.7 | +1.7 | |
Total formal votes | 16,676 | 97.5 | −0.2 | ||
Informal votes | 423 | 2.5 | +0.2 | ||
Turnout | 17,099 | 95.4 | +0.4 | ||
Two-party-preferred result | |||||
Liberal | Mark Brindal | 8,495 | 50.9 | +3.7 | |
Labor | June Appleby | 8,181 | 49.1 | −3.7 | |
Liberal gain from Labor | Swing | +3.7 |
Party | Candidate | Votes | % | ±% | |
---|---|---|---|---|---|
Labor | Don Ferguson | 9,040 | 48.5 | −6.1 | |
Liberal | Bob Randall | 7,673 | 41.1 | +1.3 | |
Democrats | Keith Lees | 1,518 | 8.1 | +3.9 | |
Call to Australia | Peter Thompson | 428 | 2.3 | +2.3 | |
Total formal votes | 18,659 | 96.6 | −0.2 | ||
Informal votes | 657 | 3.4 | +0.2 | ||
Turnout | 19,316 | 95.0 | +0.5 | ||
Two-party-preferred result | |||||
Labor | Don Ferguson | 10,077 | 54.0 | −3.3 | |
Liberal | Bob Randall | 8,582 | 46.0 | +3.3 | |
Labor hold | Swing | −3.3 |
Party | Candidate | Votes | % | ±% | |
---|---|---|---|---|---|
Liberal | David Wotton | 11,162 | 57.0 | +2.6 | |
Labor | Jillian Bromley | 5,131 | 26.2 | −11.3 | |
Democrats | Merilyn Pedrick | 3,299 | 16.8 | +10.5 | |
Total formal votes | 19,592 | 98.1 | +0.7 | ||
Informal votes | 369 | 1.9 | −0.7 | ||
Turnout | 19,961 | 94.3 | +1.2 | ||
Two-party-preferred result | |||||
Liberal | David Wotton | 12,749 | 65.1 | +6.3 | |
Labor | Jillian Bromley | 6,843 | 34.9 | −6.3 | |
Liberal hold | Swing | +6.3 |
Party | Candidate | Votes | % | ±% | |
---|---|---|---|---|---|
Liberal | Roger Goldsworthy | 11,560 | 55.8 | +3.7 | |
Labor | Warren Smith | 5,410 | 26.1 | −8.9 | |
Democrats | Michel Francis | 2,698 | 13.0 | +13.0 | |
Call to Australia | Graeme Watts | 1,046 | 5.1 | +5.1 | |
Total formal votes | 20,714 | 97.8 | +0.8 | ||
Informal votes | 465 | 2.2 | −0.8 | ||
Turnout | 21,179 | 95.6 | +2.1 | ||
Two-party-preferred result | |||||
Liberal | Roger Goldsworthy | 13,567 | 65.5 | +3.7 | |
Labor | Warren Smith | 7,174 | 34.5 | −3.7 | |
Liberal hold | Swing | +3.7 |
Party | Candidate | Votes | % | ±% | |
---|---|---|---|---|---|
Liberal | Bruce Eastick | 10,912 | 53.5 | −2.1 | |
Labor | Tony Piccolo | 6,564 | 32.2 | −5.3 | |
Democrats | John Joyes | 1,500 | 7.4 | +2.8 | |
Call to Australia | Theodor Stiller | 1,206 | 5.9 | +5.9 | |
Independent | Eric Gerlach | 207 | 1.0 | −1.3 | |
Total formal votes | 20,389 | 97.0 | +1.6 | ||
Informal votes | 623 | 3.0 | −1.6 | ||
Turnout | 21,012 | 95.9 | +1.4 | ||
Two-party-preferred result | |||||
Liberal | Bruce Eastick | 12,818 | 62.9 | +3.6 | |
Labor | Tony Piccolo | 7,571 | 37.1 | −3.6 | |
Liberal hold | Swing | +3.6 |
Party | Candidate | Votes | % | ±% | |
---|---|---|---|---|---|
Labor | Susan Lenehan | 10,484 | 49.6 | −13.2 | |
Liberal | Craig Spencer | 7,776 | 36.8 | +5.8 | |
Democrats | Dennis Dorney | 2,857 | 13.6 | +7.4 | |
Total formal votes | 21,117 | 97.3 | +0.2 | ||
Informal votes | 593 | 2.7 | −0.2 | ||
Turnout | 21,710 | 94.9 | +2.2 | ||
Two-party-preferred result | |||||
Labor | Susan Lenehan | 12,105 | 57.3 | −8.8 | |
Liberal | Craig Spencer | 9,012 | 42.7 | +8.8 | |
Labor hold | Swing | −8.8 |
Party | Candidate | Votes | % | ±% | |
---|---|---|---|---|---|
Liberal | Stephen Baker | 9,883 | 55.3 | −0.2 | |
Labor | Timothy Campbell | 5,671 | 31.7 | −5.9 | |
Democrats | Matthew Greenwood | 2,312 | 12.9 | +6.0 | |
Total formal votes | 17,866 | 98.1 | +1.2 | ||
Informal votes | 346 | 1.9 | −1.2 | ||
Turnout | 18,212 | 93.2 | +0.3 | ||
Two-party-preferred result | |||||
Liberal | Stephen Baker | 10,890 | 61.0 | +2.7 | |
Labor | Timothy Campbell | 6,976 | 39.0 | −2.7 | |
Liberal hold | Swing | +2.7 |
Party | Candidate | Votes | % | ±% | |
---|---|---|---|---|---|
Labor | Paul Holloway | 8,187 | 47.9 | −12.9 | |
Liberal | Darryl Parslow | 6,695 | 39.2 | +4.8 | |
Democrats | Sue Ann Carver | 2,196 | 12.9 | +8.1 | |
Total formal votes | 17,078 | 97.2 | +0.8 | ||
Informal votes | 492 | 2.8 | −0.8 | ||
Turnout | 17,570 | 94.6 | +0.6 | ||
Two-party-preferred result | |||||
Labor | Paul Holloway | 9,279 | 54.3 | −9.2 | |
Liberal | Darryl Parslow | 7,799 | 45.7 | +9.2 | |
Labor hold | Swing | −9.2 |
Party | Candidate | Votes | % | ±% | |
---|---|---|---|---|---|
Liberal | John Oswald | 9,364 | 55.1 | +2.4 | |
Labor | Trevor Peikert | 5,917 | 34.8 | −8.2 | |
Democrats | Rosalina Bouchee | 1,724 | 10.1 | +5.8 | |
Total formal votes | 17,005 | 98.2 | +0.9 | ||
Informal votes | 318 | 1.8 | −0.9 | ||
Turnout | 17,323 | 93.6 | −0.2 | ||
Two-party-preferred result | |||||
Liberal | John Oswald | 10,199 | 60.0 | +5.3 | |
Labor | Trevor Peikert | 6,806 | 40.0 | −5.3 | |
Liberal hold | Swing | +5.3 |
Party | Candidate | Votes | % | ±% | |
---|---|---|---|---|---|
Liberal | Harold Allison | 12,394 | 67.6 | +8.7 | |
Labor | Brenton Lynch | 4,383 | 23.9 | −15.0 | |
Democrats | Glenn Taylor | 380 | 2.2 | +3.8 | |
Call to Australia | Johannes Bastiaens | 464 | 2.5 | +2.5 | |
Total formal votes | 18,336 | 98.2 | +1.0 | ||
Informal votes | 337 | 1.8 | −1.0 | ||
Turnout | 18,673 | 94.9 | −1.0 | ||
Two-party-preferred result | |||||
Liberal | Harold Allison | 13,286 | 72.5 | +12.6 | |
Labor | Brenton Lynch | 5,050 | 27.5 | −12.6 | |
Liberal hold | Swing | +12.6 |
Party | Candidate | Votes | % | ±% | |
---|---|---|---|---|---|
Liberal | Peter Lewis | 11,774 | 63.7 | +5.5 | |
Labor | Jane Milek | 4,240 | 23.0 | −5.2 | |
Democrats | Jeannette Jolley | 1,717 | 9.3 | +7.3 | |
National | Douglas Lindley | 739 | 4.0 | −4.7 | |
Total formal votes | 18,470 | 97.3 | +0.1 | ||
Informal votes | 517 | 2.7 | −0.1 | ||
Turnout | 18,987 | 95.0 | +1.0 | ||
Two-party-preferred result | |||||
Liberal | Peter Lewis | 13,417 | 72.6 | +4.0 | |
Labor | Jane Milek | 5,053 | 27.4 | −4.0 | |
Liberal hold | Swing | +4.0 |
Party | Candidate | Votes | % | ±% | |
---|---|---|---|---|---|
Labor | Terry Hemmings | 10,300 | 59.8 | −7.0 | |
Liberal | Rilda Sharp | 4,387 | 25.5 | −4.7 | |
Democrats | William Adams | 2,533 | 14.7 | +10.6 | |
Total formal votes | 17,220 | 96.4 | +0.5 | ||
Informal votes | 638 | 3.6 | −0.5 | ||
Turnout | 17,858 | 93.6 | +1.2 | ||
Two-party-preferred result | |||||
Labor | Terry Hemmings | 11,570 | 67.2 | −6.3 | |
Liberal | Rilda Sharp | 5,650 | 32.8 | +6.3 | |
Labor hold | Swing | −6.3 |
Party | Candidate | Votes | % | ±% | |
---|---|---|---|---|---|
Labor | Di Gayler | 9,282 | 44.6 | −4.5 | |
Liberal | Dorothy Kotz | 8,989 | 43.1 | −3.3 | |
Democrats | Patrick Kavanagh | 1,628 | 7.8 | +3.3 | |
Call to Australia | Dennis Brown | 930 | 4.5 | +4.5 | |
Total formal votes | 20,829 | 97.8 | +0.2 | ||
Informal votes | 466 | 2.2 | −0.2 | ||
Turnout | 21,295 | 95.9 | +0.9 | ||
Two-party-preferred result | |||||
Liberal | Dorothy Kotz | 10,438 | 50.1 | +1.6 | |
Labor | Di Gayler | 10,391 | 49.9 | −1.6 | |
Liberal gain from Labor | Swing | +1.6 |
Party | Candidate | Votes | % | ±% | |
---|---|---|---|---|---|
Labor | Greg Crafter | 7,502 | 44.3 | −8.9 | |
Liberal | Robert Jackson | 7,169 | 42.4 | +0.6 | |
Democrats | Cathi Tucker-Lee | 1,818 | 10.7 | +5.7 | |
Call to Australia | Belle Harris | 247 | 1.5 | +1.5 | |
Independent | Alison Cox | 194 | 1.1 | +1.1 | |
Total formal votes | 16,930 | 96.8 | −0.5 | ||
Informal votes | 556 | 3.2 | +0.5 | ||
Turnout | 17,486 | 93.2 | +0.8 | ||
Two-party-preferred result | |||||
Labor | Greg Crafter | 8,887 | 52.5 | −3.8 | |
Liberal | Robert Jackson | 8,043 | 47.5 | +3.8 | |
Labor hold | Swing | −3.8 |
Party | Candidate | Votes | % | ±% | |
---|---|---|---|---|---|
Labor | Vic Heron | 8,965 | 51.9 | −10.0 | |
Liberal | Darcy Constantine | 5,784 | 33.5 | −1.9 | |
Democrats | Stephen Crabbe | 1,707 | 9.9 | +5.3 | |
Socialist Alliance | Philippa Skinner | 422 | 2.5 | +2.5 | |
Call to Australia | Terry Lear | 385 | 2.2 | +2.2 | |
Total formal votes | 17,263 | 94.5 | +1.5 | ||
Informal votes | 1,004 | 5.5 | −1.5 | ||
Turnout | 18,267 | 93.5 | 0.0 | ||
Two-party-preferred result | |||||
Labor | Vic Heron | 10,355 | 60.0 | −5.7 | |
Liberal | Darcy Constantine | 6,908 | 40.0 | +5.7 | |
Labor hold | Swing | −5.7 |
Party | Candidate | Votes | % | ±% | |
---|---|---|---|---|---|
Labor | John Quirke | 9,244 | 51.6 | −14.7 | |
Liberal | Peter Panagaris | 5,859 | 32.7 | +4.6 | |
Democrats | Andrew Sickerdick | 2,823 | 15.7 | +10.1 | |
Total formal votes | 17,926 | 96.3 | +2.4 | ||
Informal votes | 683 | 3.7 | −2.4 | ||
Turnout | 18,609 | 94.8 | +0.8 | ||
Two-party-preferred result | |||||
Labor | John Quirke | 10,597 | 59.1 | −10.3 | |
Liberal | Peter Panagaris | 7,329 | 40.9 | +10.3 | |
Labor hold | Swing | −10.3 |
Party | Candidate | Votes | % | ±% | |
---|---|---|---|---|---|
Labor | Murray De Laine | 10,813 | 60.7 | −8.7 | |
Liberal | Bernice Pfitzner | 5,282 | 29.7 | +6.0 | |
Democrats | Martin Kay | 1,702 | 9.6 | +2.7 | |
Total formal votes | 17,797 | 95.2 | +0.4 | ||
Informal votes | 904 | 4.8 | −0.4 | ||
Turnout | 18,701 | 94.3 | +1.4 | ||
Two-party-preferred result | |||||
Labor | Murray De Laine | 11,854 | 66.3 | −8.0 | |
Liberal | Bernice Pfitzner | 5,943 | 33.4 | +8.0 | |
Labor hold | Swing | −8.0 |
Party | Candidate | Votes | % | ±% | |
---|---|---|---|---|---|
Labor | Lynn Arnold | 13,369 | 60.6 | −13.6 | |
Liberal | Brenda Bates | 6,233 | 28.2 | +2.4 | |
Democrats | Shylie Holden | 2,465 | 11.2 | +11.2 | |
Total formal votes | 22,067 | 96.0 | +0.6 | ||
Informal votes | 921 | 4.0 | −0.6 | ||
Turnout | 22,988 | 94.5 | −0.9 | ||
Two-party-preferred result | |||||
Labor | Lynn Arnold | 14,728 | 66.7 | −7.5 | |
Liberal | Brenda Bates | 7,339 | 33.3 | +7.5 | |
Labor hold | Swing | −7.5 |
Party | Candidate | Votes | % | ±% | |
---|---|---|---|---|---|
Labor | John Bannon | 9,918 | 59.0 | −6.9 | |
Liberal | Christopher Pyne | 5,297 | 31.5 | +2.0 | |
Democrats | Brian Fain | 1,590 | 9.5 | +4.9 | |
Total formal votes | 16,805 | 96.8 | +0.7 | ||
Informal votes | 559 | 3.2 | −0.7 | ||
Turnout | 17,364 | 94.6 | +0.7 | ||
Two-party-preferred result | |||||
Labor | John Bannon | 10,745 | 64.1 | −4.6 | |
Liberal | Christopher Pyne | 6,023 | 35.9 | +4.6 | |
Labor hold | Swing | −4.6 |
Party | Candidate | Votes | % | ±% | |
---|---|---|---|---|---|
Independent | Norm Peterson | 7,210 | 40.0 | −1.7 | |
Labor | Kevin Foley | 6,069 | 33.7 | −7.3 | |
Liberal | Terence Daviess | 3,655 | 20.2 | +3.9 | |
Democrats | Eric Mack | 1,097 | 6.1 | +5.1 | |
Total formal votes | 18,031 | 97.3 | +0.2 | ||
Informal votes | 494 | 2.7 | −0.2 | ||
Turnout | 18,525 | 94.5 | +0.1 | ||
Two-party-preferred result | |||||
Labor | Kevin Foley | 12,712 | 70.5 | −4.5 | |
Liberal | Terence Daviess | 5,319 | 29.5 | +4.5 | |
Two-candidate-preferred result | |||||
Independent | Norm Peterson | 11,319 | 62.8 | +5.5 | |
Labor | Kevin Foley | 6,712 | 37.2 | −5.5 | |
Independent hold | Swing | +5.5 |
Party | Candidate | Votes | % | ±% | |
---|---|---|---|---|---|
Labor | Michael Atkinson | 9,762 | 55.3 | −9.5 | |
Liberal | Rod Scarborough | 4,668 | 26.4 | −3.4 | |
Democrats | Brian O'Leary | 1,350 | 7.6 | +2.2 | |
Grey Power | Florence Pens | 1,275 | 7.2 | +7.2 | |
Socialist Alliance | Dennis White | 314 | 1.8 | +1.8 | |
Call to Australia | Catherine Sparrow | 290 | 1.7 | +1.7 | |
Total formal votes | 17,659 | 94.1 | −1.9 | ||
Informal votes | 1,103 | 5.9 | +1.9 | ||
Turnout | 18,762 | 93.9 | +0.6 | ||
Two-party-preferred result | |||||
Labor | Michael Atkinson | 11,298 | 64.0 | −4.4 | |
Liberal | Rod Scarborough | 6,361 | 36.0 | +4.4 | |
Labor hold | Swing | −4.4 |
Party | Candidate | Votes | % | ±% | |
---|---|---|---|---|---|
Labor | Colleen Hutchison | 8,573 | 48.9 | −18.6 | |
Independent | Nancy Baluch | 3,857 | 22.0 | +22.0 | |
Liberal | Simon Dawson | 2,517 | 14.4 | −10.5 | |
Call to Australia | David Squirrell | 1,691 | 9.6 | +9.6 | |
Democrats | Kaye Matthews | 887 | 5.1 | +1.9 | |
Total formal votes | 17,525 | 97.3 | +4.3 | ||
Informal votes | 482 | 2.7 | −4.3 | ||
Turnout | 18,007 | 94.0 | +1.0 | ||
Two-party-preferred result | |||||
Labor | Colleen Hutchison | 11,917 | 68.0 | −4.0 | |
Liberal | Simon Dawson | 5,608 | 32.0 | +4.0 | |
Two-candidate-preferred result | |||||
Labor | Colleen Hutchison | 9,853 | 56.2 | −15.8 | |
Independent | Nancy Baluch | 7,672 | 43.8 | +43.8 | |
Labor hold | Swing | N/A |
Party | Candidate | Votes | % | ±% | |
---|---|---|---|---|---|
Labor | John Klunder | 8,822 | 46.8 | −6.4 | |
Liberal | Ernest Harders de Braconier | 7,635 | 40.5 | −1.7 | |
Democrats | David Ball | 1,834 | 9.7 | +5.1 | |
Call to Australia | Tom Curnow | 557 | 3.0 | +3.0 | |
Total formal votes | 18,848 | 97.0 | +0.3 | ||
Informal votes | 580 | 3.0 | −0.3 | ||
Turnout | 19,428 | 95.7 | −1.0 | ||
Two-party-preferred result | |||||
Labor | John Klunder | 9,958 | 52.8 | −3.1 | |
Liberal | Ernest Harders de Braconier | 8,890 | 47.2 | +3.1 | |
Labor hold | Swing | −3.1 |
Party | Candidate | Votes | % | ±% | |
---|---|---|---|---|---|
Labor | Kym Mayes | 7,662 | 44.9 | −7.1 | |
Liberal | Joy Nimon | 7,222 | 41.5 | −1.1 | |
Democrats | Mark Basham | 1,732 | 10.0 | +6.0 | |
Independent | Jennie Williams | 536 | 3.0 | +3.0 | |
Call to Australia | David Peake | 235 | 1.4 | +1.4 | |
Total formal votes | 17,387 | 97.4 | +0.7 | ||
Informal votes | 471 | 2.6 | −0.7 | ||
Turnout | 17,858 | 92.8 | +2.0 | ||
Two-party-preferred result | |||||
Labor | Kym Mayes | 9,102 | 52.3 | −2.7 | |
Liberal | Joy Nimon | 8,285 | 47.7 | +2.7 | |
Labor hold | Swing | −2.7 |
Party | Candidate | Votes | % | ±% | |
---|---|---|---|---|---|
Liberal | Dale Baker | 12,892 | 68.9 | +19.5 | |
Labor | Ray Tunks | 4,401 | 23.5 | −3.6 | |
Democrats | Johannes Cullen | 1,420 | 7.6 | +4.8 | |
Total formal votes | 18,713 | 98.2 | +1.7 | ||
Informal votes | 348 | 1.8 | −1.7 | ||
Turnout | 19,061 | 94.7 | +0.2 | ||
Two-party-preferred result | |||||
Liberal | Dale Baker | 13,706 | 73.2 | +4.9 | |
Labor | Ray Tunks | 5,007 | 26.8 | −4.9 | |
Liberal hold | Swing | +4.9 |
Party | Candidate | Votes | % | ±% | |
---|---|---|---|---|---|
Labor | John Trainer | 8,520 | 50.4 | −6.3 | |
Liberal | Douglas Rowe | 6,623 | 39.1 | +4.8 | |
Democrats | Richard Bennett | 1,776 | 10.5 | +6.7 | |
Total formal votes | 16,919 | 96.9 | +2.5 | ||
Informal votes | 542 | 3.1 | −2.5 | ||
Turnout | 17,461 | 94.5 | +0.1 | ||
Two-party-preferred result | |||||
Labor | John Trainer | 9,532 | 56.3 | −4.4 | |
Liberal | Douglas Rowe | 7,387 | 43.7 | +4.4 | |
Labor hold | Swing | −4.4 |
Party | Candidate | Votes | % | ±% | |
---|---|---|---|---|---|
Labor | Frank Blevins | 7,806 | 51.1 | −2.8 | |
Liberal | Naomi Perry | 3,884 | 25.5 | +1.9 | |
Independent | George Crowe | 2,231 | 14.6 | +14.6 | |
Democrats | Rosemary Gloede | 1,348 | 8.8 | +6.7 | |
Total formal votes | 15,269 | 97.0 | +0.7 | ||
Informal votes | 479 | 3.0 | −0.7 | ||
Turnout | 15,748 | 94.0 | +1.8 | ||
Two-party-preferred result | |||||
Labor | Frank Blevins | 9,299 | 60.9 | −6.1 | |
Liberal | Naomi Perry | 5,970 | 39.1 | +6.1 | |
Labor hold | Swing | −6.1 |
The South Australian House of Assembly is one of the two chambers of the Parliament of South Australia, the other being the Legislative Council. It sits in Parliament House in the state capital, Adelaide.
The Parliament of South Australia is the bicameral legislature of the Australian state of South Australia. It consists of the 47-seat House of Assembly and the 22-seat Legislative Council. General elections are held every 4 years, with all of the lower house and half of the upper house filled at each election. It follows a Westminster system of parliamentary government with the executive branch required to both sit in parliament and hold the confidence of the House of Assembly. The parliament is based at Parliament House on North Terrace in the state capital of Adelaide.
The Western Australian Legislative Council is the upper house of the Parliament of Western Australia, a state of Australia. It is regarded as a house of review for legislation passed by the Legislative Assembly, the lower house. The two Houses of Parliament sit in Parliament House in the state capital, Perth.
State elections were held in South Australia on 11 December 1993. All 47 seats in the South Australian House of Assembly were up for election. The incumbent Labor government, led by Premier Lynn Arnold, was defeated by the Liberal Opposition, led by Dean Brown, in a landslide victory. The Liberals won what is still the largest majority government in South Australian history.
Elections were held in the Australian state of Queensland on 1 November 1986 to elect the 89 members of the state's Legislative Assembly. It followed a redistribution which increased the number of seats in the Assembly from 82 to 89.
Members of the New South Wales Legislative Assembly who served in the 49th parliament held their seats from 1988 to 1991. They were elected at the 1988 state election, and at by-elections. The Speaker was Kevin Rozzoli.
The lower houses of the parliaments of the states and territories of Australia are divided into electoral districts. Most electoral districts send a single member to a state or territory's parliament using the preferential method of voting. The area of a state electoral district is dependent upon the Electoral Acts in the various states and vary in area between them. At present, there are 409 state electoral districts in Australia.
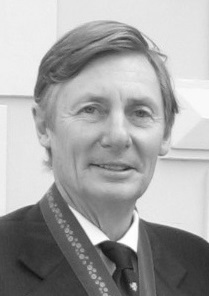
State elections were held in South Australia on 25 November 1989. All 47 seats in the South Australian House of Assembly were up for election. The incumbent Australian Labor Party led by Premier of South Australia John Bannon defeated the Liberal Party of Australia led by Leader of the Opposition John Olsen. Labor won 22 out of 47 seats, and secured a majority of 24 with the support of two Independent Labor members.
State elections were held in South Australia on 7 December 1985. All 47 seats in the South Australian House of Assembly were up for election. The incumbent Australian Labor Party led by Premier of South Australia John Bannon increased its majority, and defeated the Liberal Party of Australia led by Leader of the Opposition John Olsen.
State elections were held in South Australia on 12 July 1975. All 47 seats in the South Australian House of Assembly were up for election. The incumbent Australian Labor Party led by Premier of South Australia Don Dunstan won a third term in government, defeating the Liberal Party of Australia led by Leader of the Opposition Bruce Eastick.
Price was an electoral district of the House of Assembly in the Australian state of South Australia from 1970 to 2002. Based in the north-west of Adelaide, it was a safe Labor seat.
Whyalla was an electoral district of the House of Assembly in the Australian state of South Australia from 1956 to 1993. The district was based on the town of Whyalla.
Peake was an electoral district of the House of Assembly in the Australian state of South Australia from 1970 to 2002. The district was based in the western suburbs of Adelaide.
Spence was an electoral district of the House of Assembly in the Australian state of South Australia from 1970 to 2002. The district was based in the inner north-west suburbs of Adelaide.
Custance was an electoral district of the House of Assembly in the Australian state of South Australia from 1985 to 1997. Until the 1991 electoral redistribution, the district stretched from just outside Port Pirie in the north to the Barossa Valley in the south.
Alexandra was an electoral district of the House of Assembly in the Australian state of South Australia from 1902 to 1992, and was formed when the electoral districts of Encounter Bay, Mount Barker and Noarlunga were amalgamated. The district included the Fleurieu Peninsula, to the south of Adelaide.
Mitcham was an electoral district of the House of Assembly in the Australian state of South Australia from 1938 to 1993. The district was based in the south-eastern suburbs of Adelaide.
The 2014 South Australian state election elected members to the 53rd Parliament of South Australia on 15 March 2014, to fill all 47 seats in the House of Assembly and 11 of 22 seats in the Legislative Council. The 12-year-incumbent Australian Labor Party (SA) government, led by Premier Jay Weatherill, won its fourth consecutive four-year term in government, a record 16 years of Labor government, defeating the opposition Liberal Party of Australia (SA), led by Opposition Leader Steven Marshall.
Eyre was an electoral district of the House of Assembly in the Australian state of South Australia from 1938 to 1997.
The 2022 South Australian state election was held on 19 March 2022 to elect members to the 55th Parliament of South Australia. All 47 seats in the House of Assembly, and half the seats in the Legislative Council were up for re-election.