Results of the Queensland state election, 2015

Last updated

Queensland state election, 31 January 2015
Legislative Assembly
<< 2012next >>

Contents

Enrolled voters2,981,145
Votes cast2,679,874 Turnout 89.89−1.11
Informal votes56,431Informal2.11−0.05
Summary of votes by party
PartyPrimary votes%SwingSeatsChange
  Liberal National 1,084,06041.32–8.3342–34
  Labor 983,05437.47+10.8144+35
  Greens 221,1578.43+0.900±0
  Palmer United 133,9295.11+5.110±0
  Katter's Australian 50,5881.93–9.612±0
  Family First 31,2311.19–0.170±0
  One Nation 24,1110.92+0.820±0
  Independent 95,3133.63+0.471−1
Total2,623,443  89 
Two-party-preferred
  Labor 51.1+14.0
  Liberal National 48.9−14.0
* The statewide two-party preferred summary is an estimate calculated by Antony Green.

This is a list of electoral district results for the Queensland 2015 election.

This is a list of current and former electoral divisions for the Legislative Assembly of Queensland, the state legislature for Queensland, Australia.

Results by electoral district

Albert

Queensland state election, 2015: Albert [1]
PartyCandidateVotes%±
Liberal National Mark Boothman 13,59743.13−6.46
Labor Melissa McMahon 11,14535.35+6.99
Palmer United Blair Brewster3,42810.87+10.87
Greens Jane Cajdler1,9236.10+0.70
Family First Amanda Best1,4344.55−1.24
Total formal votes31,52797.21+0.04
Informal votes9062.79−0.04
Turnout 32,43388.33−3.09
Two-party-preferred result
Liberal National Mark Boothman 14,87251.67−10.22
Labor Melissa McMahon 13,91148.33+10.22
Liberal National hold Swing −10.22

Algester

Queensland state election, 2015: Algester [2]
PartyCandidateVotes%±
Labor Leeanne Enoch 14,08949.56+15.71
Liberal National Anthony Shorten 11,24739.56−11.16
Greens Susan Wolf2,0567.23+0.28
Independent Kevin Forshaw1,0373.65+3.65
Total formal votes28,42997.67+0.34
Informal votes6792.33−0.34
Turnout 29,10890.55−2.27
Two-party-preferred result
Labor Leeanne Enoch 15,59456.99+16.14
Liberal National Anthony Shorten 11,77043.01−16.14
Labor gain from Liberal National Swing +16.14

Ashgrove

Queensland state election, 2015: Ashgrove [3]
PartyCandidateVotes%±
Labor Kate Jones 13,37244.45+7.85
Liberal National Campbell Newman 13,12543.63−8.18
Greens Robert Hogg3,04710.13+0.96
Independent Connie Cicchini2790.93+0.39
Independent Peter Jeremijenko2610.87+0.33
Total formal votes30,08498.97−0.25
Informal votes3131.03+0.25
Turnout 30,39791.34−1.06
Two-party-preferred result
Labor Kate Jones 16,00954.25+9.95
Liberal National Campbell Newman 13,49845.75−9.95
Labor gain from Liberal National Swing +9.95

Aspley

Queensland state election, 2015: Aspley [4]
PartyCandidateVotes%±
Liberal National Tracy Davis 14,86852.41−13.02
Labor Gayle Dallaston10,83538.20+14.65
Greens Noel Clothier2,6639.39+1.96
Total formal votes28,36698.28−0.12
Informal votes4971.72+0.12
Turnout 28,86391.95−2.47
Two-party-preferred result
Liberal National Tracy Davis 15,27655.17−16.58
Labor Gayle Dallaston12,41244.83+16.58
Liberal National hold Swing −16.58

Barron River

Queensland state election, 2015: Barron River [5]
PartyCandidateVotes%±
Liberal National Michael Trout 13,86641.60−4.11
Labor Craig Crawford 13,13839.41+11.57
Greens Noel Castley-Wright3,39210.18+1.02
Palmer United Andrew Schebella2,9378.81+8.81
Total formal votes33,33397.91+0.16
Informal votes7102.09−0.16
Turnout 34,04388.49−0.98
Two-party-preferred result
Labor Craig Crawford 16,76453.12+12.60
Liberal National Michael Trout 14,79446.88−12.60
Labor gain from Liberal National Swing +12.60

Beaudesert

Queensland state election, 2015: Beaudesert [6]
PartyCandidateVotes%±
Liberal National Jon Krause 15,08647.47+0.36
Labor Kay Hohenhaus9,28129.20+15.23
Greens Pietro Agnoletto2,6138.22−0.11
One Nation Robert Bowyer2,1456.75+4.16
Palmer United Adele Ishaac1,9896.26+6.26
Family First Jeremy Fredericks6682.10+0.47
Total formal votes31,78297.69−0.16
Informal votes7532.31+0.16
Turnout 32,53591.28−1.29
Two-party-preferred result
Liberal National Jon Krause 16,44057.53−3.03
Labor Kay Hohenhaus12,13842.47+3.03
Liberal National hold Swing −3.03

Brisbane Central

Queensland state election, 2015: Brisbane Central [7]
PartyCandidateVotes%±
Liberal National Robert Cavallucci 12,04241.81−6.89
Labor Grace Grace 10,59036.77+3.10
Greens Kirsten Lovejoy5,35518.59+3.26
Independent Kai Jones8152.83+0.53
Total formal votes28,80298.36+0.01
Informal votes4811.64−0.01
Turnout 29,28384.96−1.93
Two-party-preferred result
Labor Grace Grace 14,33453.25+8.13
Liberal National Robert Cavallucci 12,58446.75−8.13
Labor gain from Liberal National Swing +8.13

Broadwater

Queensland state election, 2015: Broadwater [8]
PartyCandidateVotes%±
Liberal National Verity Barton 13,53747.46−3.84
Labor Penny Toland8,84431.01−0.64
Greens Daniel Kwon2,1457.52+4.31
Palmer United Gueorgui Sokolov1,6965.95+5.95
One Nation Phil Pollock1,0613.72+3.72
Family First Stuart Ballantyne9883.46+1.63
Independent Amin-Reza Javanmard2520.88+0.88
Total formal votes28,52397.44−0.27
Informal votes7482.56+0.27
Turnout 29,27186.62−1.95
Two-party-preferred result
Liberal National Verity Barton 14,54457.19−4.10
Labor Penny Toland10,88542.81+4.10
Liberal National hold Swing −4.10

Buderim

Queensland state election, 2015: Buderim [9]
PartyCandidateVotes%±
Liberal National Steve Dickson 15,29752.62−9.55
Labor Elaine Hughes6,62722.80+6.61
Palmer United Tess Lazarus3,78113.01+13.01
Greens Susan Etheridge3,36611.58+0.93
Total formal votes29,07197.90−0.15
Informal votes6252.10+0.15
Turnout 29,69689.75−0.01
Two-party-preferred result
Liberal National Steve Dickson 16,35362.16−13.85
Labor Elaine Hughes9,95437.84+13.85
Liberal National hold Swing −13.85

Bulimba

Queensland state election, 2015: Bulimba [10]
PartyCandidateVotes%±
Labor Di Farmer 14,53947.72+4.81
Liberal National Aaron Dillaway 12,75541.87−4.83
Greens David Hale3,17310.41+0.02
Total formal votes30,46798.54+0.27
Informal votes4501.46−0.27
Turnout 30,91790.18−0.93
Two-party-preferred result
Labor Di Farmer 16,74156.14+6.28
Liberal National Aaron Dillaway 13,07743.86−6.28
Labor gain from Liberal National Swing +6.28

Bundaberg

Queensland state election, 2015: Bundaberg [11]
PartyCandidateVotes%±
Liberal National Jack Dempsey 11,12841.45−11.71
Labor Leanne Donaldson 10,65439.68+15.96
Palmer United Robert Brown3,20811.95+11.95
Greens Meg Anderson1,1124.14+1.20
Independent Richard Freudenberg7462.78+2.78
Total formal votes26,84897.81+0.21
Informal votes6022.19−0.21
Turnout 27,45091.67+0.29
Two-party-preferred result
Labor Leanne Donaldson 12,78351.62+19.79
Liberal National Jack Dempsey 11,98048.38−19.79
Labor gain from Liberal National Swing +19.79

Bundamba

Queensland state election, 2015: Bundamba [12]
PartyCandidateVotes%±
Labor Jo-Ann Miller 20,41361.20+22.27
Liberal National Stephen Fenton8,20424.60−11.05
Greens Ava Greenwood2,7328.19+3.05
Family First Luke Harris2,0076.02+2.83
Total formal votes33,35697.71+0.33
Informal votes7822.29−0.33
Turnout 34,13888.82−2.26
Two-party-preferred result
Labor Jo-Ann Miller 22,75371.43+19.61
Liberal National Stephen Fenton9,10128.57−19.61
Labor hold Swing +19.61

Burdekin

Queensland state election, 2015: Burdekin [13]
PartyCandidateVotes%±
Liberal National Dale Last 10,51037.30−10.69
Labor Angela Zyla7,52226.70+6.12
Katter's Australian Steven Isles3,39612.05−14.21
Palmer United Jacinta Warland2,3308.27+8.27
Independent BJ Davison2,3068.18+8.18
One Nation Belinda Johnson1,3054.63+4.63
Greens Lindy Collins8072.86+0.14
Total formal votes28,17698.03−0.07
Informal votes5671.97+0.07
Turnout 28,74390.90−0.07
Two-party-preferred result
Liberal National Dale Last 12,20152.88−9.59
Labor Angela Zyla10,87247.12+9.59
Liberal National hold Swing −9.59

Burleigh

Queensland state election, 2015: Burleigh [14]
PartyCandidateVotes%±
Liberal National Michael Hart 13,78446.67−4.51
Labor Gail Hislop9,17531.07+0.22
Greens Jane Power3,10810.52+2.08
Palmer United James Mac Anally2,2997.78+7.78
Family First Susan Baynes1,1673.95+1.54
Total formal votes29,53397.42−0.61
Informal votes7832.58+0.61
Turnout 30,31687.00−1.40
Two-party-preferred result
Liberal National Michael Hart 14,98456.16−4.89
Labor Gail Hislop11,69643.84+4.89
Liberal National hold Swing −4.89

Burnett

Queensland state election, 2015: Burnett [15]
PartyCandidateVotes%±
Liberal National Stephen Bennett 14,43447.19+7.18
Labor Bryan Mustill9,13429.86+13.61
Palmer United Richard Love4,44514.53+14.53
Greens Colin Sheppard1,4394.70+0.95
Independent Peter Wyatt1,1343.71+3.71
Total formal votes30,58697.57−0.34
Informal votes7632.43+0.34
Turnout 31,34992.19+0.30
Two-party-preferred result
Liberal National Stephen Bennett 15,49456.80–1.69
Labor Bryan Mustill11,78243.20+1.69
Liberal National hold Swing –1.69

Cairns

Queensland state election, 2015: Cairns [16]
PartyCandidateVotes%±
Labor Rob Pyne 13,77045.60+18.12
Liberal National Gavin King 10,96036.30−6.21
Palmer United Jeanette Sackley2,9029.61+9.61
Greens Myra Gold2,0106.66−0.45
Independent Bernice Kelly5531.83+1.83
Total formal votes30,19597.61−0.07
Informal votes7392.39+0.07
Turnout 30,93485.24−2.59
Two-party-preferred result
Labor Rob Pyne 16,56358.45+17.32
Liberal National Gavin King 11,77441.55−17.32
Labor gain from Liberal National Swing +17.32

Callide

Queensland state election, 2015: Callide [17]
PartyCandidateVotes%±
Liberal National Jeff Seeney 12,81546.50−6.83
Palmer United John Bjelke-Petersen 6,94425.20+25.20
Labor Graeme Martin5,31219.28+4.52
Greens Erich Schulz8483.08−0.17
Independent Steve Ensby7182.61+2.61
Independent Michael Higginson5381.95+1.95
Independent Duncan Scott3841.39−0.67
Total formal votes27,55998.40−0.07
Informal votes4491.60+0.07
Turnout 28,00891.98−0.34
Two-candidate-preferred result
Liberal National Jeff Seeney 13,44456.67−6.84
Palmer United John Bjelke-Petersen 10,28043.33+43.33
Liberal National hold Swing −6.84

Caloundra

Queensland state election, 2015: Caloundra [18]
PartyCandidateVotes%±
Liberal National Mark McArdle 13,02143.84−20.39
Labor Jason Hunt8,59528.94+6.50
Palmer United Phillip Collins3,07110.34+10.34
Greens Fiona Anderson3,02610.19−3.15
Independent Barry Jones1,9916.70+6.70
Total formal votes29,70497.75+0.35
Informal votes6842.25−0.35
Turnout 30,38890.76−0.71
Two-party-preferred result
Liberal National Mark McArdle 14,22353.82−17.41
Labor Jason Hunt12,20246.18+17.41
Liberal National hold Swing −17.41

Capalaba

Queensland state election, 2015: Capalaba [19]
PartyCandidateVotes%±
Labor Don Brown 14,04647.94+9.57
Liberal National Steve Davies 11,60239.60−6.94
Greens Erin Payne3,64912.46+4.89
Total formal votes29,29797.40−0.09
Informal votes7822.60+0.09
Turnout 30,07991.80−1.17
Two-party-preferred result
Labor Don Brown 16,16057.06+10.79
Liberal National Steve Davies 12,16342.94−10.79
Labor gain from Liberal National Swing +10.79

Chatsworth

Queensland state election, 2015: Chatsworth [20]
PartyCandidateVotes%±
Liberal National Steve Minnikin 15,21648.93−7.11
Labor Paul Keene12,25539.41+9.95
Greens Jarred Reilly2,6778.61+2.39
Family First Aaron Deecke9473.05+1.06
Total formal votes31,09598.33+0.19
Informal votes5281.67−0.19
Turnout 31,62391.26−1.09
Two-party-preferred result
Liberal National Steve Minnikin 15,86452.62−11.52
Labor Paul Keene14,28547.38+11.52
Liberal National hold Swing −11.52

Clayfield

Queensland state election, 2015: Clayfield [21]
PartyCandidateVotes%±
Liberal National Tim Nicholls 16,11352.89−9.44
Labor John Martin9,76932.07+10.47
Greens Anthony Pink3,39311.14+0.30
Independent Katrina MacDonald1,1883.90+3.90
Total formal votes30,46398.39+0.02
Informal votes4981.61−0.02
Turnout 30,96189.38−1.93
Two-party-preferred result
Liberal National Tim Nicholls 16,73557.21−13.35
Labor John Martin12,51542.79+13.35
Liberal National hold Swing −13.35

Cleveland

Queensland state election, 2015: Cleveland [22]
PartyCandidateVotes%±
Liberal National Mark Robinson 16,43452.14−9.75
Labor Tracey Huges11,28835.82+9.37
Greens Amanda White3,79512.04+4.47
Total formal votes31,51798.15+0.13
Informal votes5931.85−0.13
Turnout 32,11091.88−1.13
Two-party-preferred result
Liberal National Mark Robinson 16,92955.45−12.65
Labor Tracey Huges13,59944.55+12.65
Liberal National hold Swing −12.65

Condamine

Queensland state election, 2015: Condamine [23]
PartyCandidateVotes%±
Liberal National Pat Weir 17,02851.18−7.12
Labor Brendon Huybregts7,27121.86+7.70
Katter's Australian Ben Hopper5,05915.21−6.11
Family First Alexandra Todd1,4554.37+4.37
Greens Pamela Fay Weekes1,3063.93−0.11
Independent Shane White1,1503.46+1.27
Total formal votes33,26997.91−0.11
Informal votes7102.09+0.11
Turnout 33,97992.67−1.52
Two-party-preferred result
Liberal National Pat Weir 18,83766.28−3.82
Labor Brendon Huybregts9,58433.72+3.82
Liberal National hold Swing −3.82

Cook

Queensland state election, 2015: Cook [24]
PartyCandidateVotes%±
Labor Billy Gordon 10,11940.41+7.99
Liberal National David Kempton 8,42433.64−3.87
Katter's Australian Lee Marriott3,13412.52−9.83
Palmer United Jason Booth1,6786.70+6.70
Greens Daryl Desjardin1,3535.40−0.10
Independent Michaelangelo Newie3321.33+1.33
Total formal votes25,04098.05−0.44
Informal votes4971.95+0.44
Turnout 25,53786.24−0.03
Two-party-preferred result
Labor Billy Gordon 12,52756.77+10.20
Liberal National David Kempton 9,54043.23−10.20
Labor gain from Liberal National Swing +10.20

Coomera

Queensland state election, 2015: Coomera [25]
PartyCandidateVotes%±
Liberal National Michael Crandon 16,91650.53−11.36
Labor Brett McCreadie10,37731.00+11.10
Palmer United Shirley Morgan3,1159.30+9.30
Greens Chris Wisbey1,8345.48−0.56
Family First Cathy O'Brien1,2363.69+3.69
Total formal votes33,47897.41+0.11
Informal votes8892.59−0.11
Turnout 34,36787.87−2.76
Two-party-preferred result
Liberal National Michael Crandon 18,01858.53−14.73
Labor Brett McCreadie12,76641.47+14.73
Liberal National hold Swing −14.73

Currumbin

Queensland state election, 2015: Currumbin [26]
PartyCandidateVotes%±
Liberal National Jann Stuckey 13,38945.39−13.45
Labor Ashley Wain8,80429.84+7.92
Greens David Wyatt3,44211.67+2.16
Palmer United Kristian Rees 2,0466.94+6.94
One Nation Deborah Gravenall1,0733.64+3.64
Family First Ben Donovan7462.53−0.04
Total formal votes29,50097.59−0.02
Informal votes7272.41+0.02
Turnout 30,22787.49−1.43
Two-party-preferred result
Liberal National Jann Stuckey 14,47555.23−14.96
Labor Ashley Wain11,73444.77+14.96
Liberal National hold Swing −14.96

Dalrymple

Queensland state election, 2015: Dalrymple [27]
PartyCandidateVotes%±
Katter's Australian Shane Knuth 11,12741.59−12.13
Liberal National Liz Schmidt8,00429.92+0.81
Labor Leanne Kettleton6,48924.26+13.17
Greens Valerie Weier1,1314.23−0.50
Total formal votes26,75198.31−0.22
Informal votes4591.69+0.22
Turnout 27,21090.11−0.36
Two-candidate-preferred result
Katter's Australian Shane Knuth 15,98765.10−0.12
Liberal National Liz Schmidt8,57134.90+0.12
Katter's Australian hold Swing −0.12

Everton

Queensland state election, 2015: Everton [28]
PartyCandidateVotes%±
Liberal National Tim Mander 14,60149.34−8.16
Labor Jeff Frew11,91040.24+9.14
Greens Aidan Norrie3,08410.42+3.21
Total formal votes29,59598.31−0.16
Informal votes5081.69+0.16
Turnout 30,10392.38−1.27
Two-party-preferred result
Liberal National Tim Mander 14,96551.77−11.38
Labor Jeff Frew13,94448.23+11.38
Liberal National hold Swing −11.38

Ferny Grove

Queensland state election, 2015: Ferny Grove [29]
PartyCandidateVotes%±
Liberal National Dale Shuttleworth 13,21444.59−9.77
Labor Mark Furner 11,25337.97+6.57
Greens Michael Berkman 3,58912.11−2.14
Palmer United Mark Taverner9933.35+3.35
Independent Di Gittins5881.98+1.98
Total formal votes29,63798.47+0.21
Informal votes4591.53−0.21
Turnout 30,09692.66−1.39
Two-party-preferred result
Labor Mark Furner 14,44550.82+10.34
Liberal National Dale Shuttleworth 13,97949.18−10.34
Labor gain from Liberal National Swing +10.34

Gaven

Queensland state election, 2015: Gaven [30]
PartyCandidateVotes%±
Liberal National Sid Cramp 11,78638.95−16.21
Labor Michael Riordan8,70028.75+5.89
Independent Alex Douglas 3,77912.49+12.49
Palmer United Adam Marcinkowski2,7409.05+9.05
Greens Toni McPherson1,8526.12+0.54
Family First Ben O'Brien1,0833.58−1.14
Independent Chris Ivory3211.06+1.06
Total formal votes30,26196.86−0.14
Informal votes9803.14+0.14
Turnout 31,24188.39−1.15
Two-party-preferred result
Liberal National Sid Cramp 13,36252.24−16.86
Labor Michael Riordan12,21447.76+16.86
Liberal National hold Swing −16.86

Gladstone

Queensland state election, 2015: Gladstone [31]
PartyCandidateVotes%±
Labor Glenn Butcher 16,51252.42+23.23
Independent Craig Butler8,98128.51−20.45
Liberal National Michael Duggan4,78415.19+4.33
Greens Craig Tomsett1,2213.88+1.77
Total formal votes31,49898.18−0.18
Informal votes5831.82+0.18
Turnout 32,08190.67−0.24
Two-candidate-preferred result
Labor Glenn Butcher 17,15261.89+25.92
Independent Craig Butler10,56138.11+38.11
Labor gain from Independent Swing +25.92

Glass House

Queensland state election, 2015: Glass House [32]
PartyCandidateVotes%±
Liberal National Andrew Powell 13,72743.72−12.13
Labor Brent Hampstead9,58730.54+12.87
Greens David Knobel4,51114.37−1.27
Palmer United Scott Higgins 3,57011.37+11.37
Total formal votes31,39597.82+0.18
Informal votes7002.18−0.18
Turnout 32,09590.60−2.02
Two-party-preferred result
Liberal National Andrew Powell 14,89051.41−18.98
Labor Brent Hampstead14,07448.59+18.98
Liberal National hold Swing −18.98

Greenslopes

Queensland state election, 2015: Greenslopes [33]
PartyCandidateVotes%±
Labor Joseph Kelly 12,07742.42+3.21
Liberal National Ian Kaye 12,01342.20−5.67
Greens Darren Ellis3,68212.93+0.02
Family First Matthew Darragh6962.44+2.44
Total formal votes28,46898.42+0.04
Informal votes4561.58−0.04
Turnout 28,92490.75−1.25
Two-party-preferred result
Labor Joseph Kelly 14,94754.25+6.70
Liberal National Ian Kaye 12,60745.75−6.70
Labor gain from Liberal National Swing +6.70

Gregory

Queensland state election, 2015: Gregory [34]
PartyCandidateVotes%±
Liberal National Lachlan Millar 10,98746.38−12.72
Labor Cheryl Thompson6,24926.38+8.87
Katter's Australian Ross Stockham2,38810.08−6.92
Palmer United Michael Linton-Helliar2,2369.44+9.44
Independent Bruce Currie1,3705.78+2.12
Greens Norm Weston4571.93−0.79
Total formal votes23,68798.21−0.21
Informal votes4321.79+0.21
Turnout 24,11990.92+1.06
Two-party-preferred result
Liberal National Lachlan Millar 12,34261.07−14.40
Labor Cheryl Thompson7,86638.93+14.40
Liberal National hold Swing −14.40

Gympie

Queensland state election, 2015: Gympie [35]
PartyCandidateVotes%±
Liberal National Tony Perrett 12,36641.30−11.72
Labor Stephen Meredith6,97123.28+11.04
Katter's Australian Shane Paulger4,80416.05−5.79
Palmer United Mitchell Frost3,38411.30+11.30
Greens Shena Macdonald2,4148.06−0.43
Total formal votes29,93997.80−0.04
Informal votes6732.20+0.04
Turnout 30,61291.52−1.01
Two-party-preferred result
Liberal National Tony Perrett 13,83357.10−10.16
Labor Stephen Meredith10,39442.90+10.16
Liberal National hold Swing −10.16

Hervey Bay

Queensland state election, 2015: Hervey Bay [36]
PartyCandidateVotes%±
Liberal National Ted Sorensen 15,31647.96−11.27
Labor Tony Gubbins10,08831.59+10.39
Palmer United Lynette Pearsall3,46910.86+10.86
Independent Jannean Dean1,2163.81+3.81
Greens Kristen Lyons1,1773.69+0.24
Family First Axel Beard6692.09−1.67
Total formal votes31,93597.65−0.18
Informal votes7682.35+0.18
Turnout 32,70390.13−0.92
Two-party-preferred result
Liberal National Ted Sorensen 16,33456.62−15.10
Labor Tony Gubbins12,51743.38+15.11
Liberal National hold Swing −15.10

Hinchinbrook

Queensland state election, 2015: Hinchinbrook [37]
PartyCandidateVotes%±
Liberal National Andrew Cripps 12,15640.67−3.37
Labor Jesse Trecco-Alexander7,15523.94+7.39
Katter's Australian Barry Barnes5,22417.48−17.77
Palmer United Martin Brewster3,02910.13+10.13
One Nation William Hankin1,2244.10+4.10
Greens Jenny Stirling1,1013.68+0.49
Total formal votes29,88998.29−0.22
Informal votes5201.71+0.22
Turnout 30,40990.61−1.57
Two-party-preferred result
Liberal National Andrew Cripps 15,49458.92+5.29
Labor Jesse Trecco-Alexander10,80441.08+41.08
Liberal National hold Swing +5.29

Inala

Queensland state election, 2015: Inala [38]
PartyCandidateVotes%±
Labor Annastacia Palaszczuk 18,91568.46+22.24
Liberal National Adam Hannant6,44223.32−11.74
Greens Silke Volkmann2,2728.22+1.01
Total formal votes27,62997.76+0.76
Informal votes6322.24−0.76
Turnout 28,26189.67−1.29
Two-party-preferred result
Labor Annastacia Palaszczuk 20,27175.12+18.22
Liberal National Adam Hannant6,71524.88−18.22
Labor hold Swing +18.22

Indooroopilly

Queensland state election, 2015: Indooroopilly [39]
PartyCandidateVotes%±
Liberal National Scott Emerson 13,50250.98−9.91
Labor Christopher Horacek7,26027.41+8.74
Greens Jake Schoermer4,93318.63+0.14
Independent Anita Diamond4901.85+1.85
Independent Paul Swan1650.62+0.62
Independent Ben Freney1340.51+0.51
Total formal votes26,48498.64+0.03
Informal votes3641.36−0.03
Turnout 26,84888.62−1.26
Two-party-preferred result
Liberal National Scott Emerson 14,11156.73−12.82
Labor Christopher Horacek10,76343.27+12.82
Liberal National hold Swing −12.82

Ipswich

Queensland state election, 2015: Ipswich [40]
PartyCandidateVotes%±
Labor Jennifer Howard 15,90453.23+22.08
Liberal National Ian Berry 8,52628.53−7.33
Greens Pat Walsh2,2457.51+1.90
Independent Patricia Petersen 1,7675.91−2.93
Family First Tim Stieler1,4384.81+1.66
Total formal votes29,88097.94+0.61
Informal votes6292.06−0.61
Turnout 30,50991.42−0.59
Two-party-preferred result
Labor Jennifer Howard 18,51765.90+20.09
Liberal National Ian Berry 9,58134.10−20.09
Labor gain from Liberal National Swing +20.09

Ipswich West

Queensland state election, 2015: Ipswich West [41]
PartyCandidateVotes%±
Labor Jim Madden 14,02545.66+13.83
Liberal National Sean Choat 10,91135.52−8.02
One Nation Christopher Reynolds3,07610.01+10.01
Greens Ian Simons1,7825.80−0.52
Independent Leo Talty9253.01+3.01
Total formal votes30,71997.98+0.23
Informal votes6322.02−0.23
Turnout 31,35191.09−2.15
Two-party-preferred result
Labor Jim Madden 16,37657.71+14.87
Liberal National Sean Choat 11,99842.29−14.87
Labor gain from Liberal National Swing +14.87

Kallangur

Queensland state election, 2015: Kallangur [42]
PartyCandidateVotes%±
Labor Shane King 14,28548.12+19.27
Liberal National Trevor Ruthenberg 12,23541.21−10.84
Greens Jason Kennedy3,16610.67+2.75
Total formal votes29,68697.49−0.03
Informal votes7632.51+0.03
Turnout 30,44991.18−1.06
Two-party-preferred result
Labor Shane King 16,19656.13+18.56
Liberal National Trevor Ruthenberg 12,65743.87−18.56
Labor gain from Liberal National Swing +18.56

Kawana

Queensland state election, 2015: Kawana [43]
PartyCandidateVotes%±
Liberal National Jarrod Bleijie 15,90950.39−16.45
Labor Mark Moss8,42226.68+8.81
Palmer United Jeremy Davey3,69311.70+11.70
Greens Marcus Finch2,7438.69+0.36
Independent Michael Jessop5161.63+1.63
Independent Jason Deller2870.91+0.91
Total formal votes31,57097.71−0.11
Informal votes7402.29+0.11
Turnout 32,31089.76−0.87
Two-party-preferred result
Liberal National Jarrod Bleijie 16,99160.09−16.17
Labor Mark Moss11,28539.91+16.17
Liberal National hold Swing −16.17

Keppel

Queensland state election, 2015: Keppel [44]
PartyCandidateVotes%±
Labor Brittany Lauga 14,40344.43+10.98
Liberal National Bruce Young 12,69839.17−5.08
Palmer United Warren Purnell2,6798.26+8.26
Greens Brandon Jones1,4974.62−1.80
Independent Bruce Diamond1,1433.53+3.53
Total formal votes32,42098.32+0.37
Informal votes5541.68−0.37
Turnout 32,97492.56−0.14
Two-party-preferred result
Labor Brittany Lauga 16,46554.80+11.19
Liberal National Bruce Young 13,58345.20−11.19
Labor gain from Liberal National Swing +11.19

Lockyer

Queensland state election, 2015: Lockyer [45]
PartyCandidateVotes%±
Liberal National Ian Rickuss 10,25933.73−18.28
One Nation Pauline Hanson 8,13226.74+26.74
Labor Steve Leese7,65225.16+7.48
Katter's Australian David Neuendorf2,1116.94−16.88
Greens Clare Rudkin1,1903.91−2.58
Palmer United Craig Gunnis1,0683.51+3.51
Total formal votes30,41298.46+0.80
Informal votes4761.54−0.80
Turnout 30,88892.14−1.52
Two-candidate-preferred result
Liberal National Ian Rickuss 13,23050.22−14.65
One Nation Pauline Hanson 13,11649.78+14.65
Liberal National hold Swing −14.65

Logan

Queensland state election, 2015: Logan [46]
PartyCandidateVotes%±
Labor Linus Power 13,83951.69+18.40
Liberal National Michael Pucci 9,26734.61−6.40
Greens Kim Southwood1,6546.18+0.80
Family First David Pellowe1,0984.10+4.10
Independent Daniel Murphy5231.95+1.95
Independent Peter Ervik3931.47+1.47
Total formal votes26,77496.89+0.26
Informal votes8593.11−0.26
Turnout 27,63389.94−1.34
Two-party-preferred result
Labor Linus Power 15,34660.82+15.62
Liberal National Michael Pucci 9,88439.18−15.62
Labor gain from Liberal National Swing +15.62

Lytton

Queensland state election, 2015: Lytton [47]
PartyCandidateVotes%±
Labor Joan Pease 14,36849.00+9.71
Liberal National Neil Symes 10,65736.35−7.32
Greens Dave Nelson2,6168.92+0.84
Independent Tamera Michel8492.90+2.90
Independent Jamie Evans8312.83+2.83
Total formal votes29,32198.11+0.63
Informal votes5641.89−0.63
Turnout 29,88591.30−0.89
Two-party-preferred result
Labor Joan Pease 16,75459.80+11.38
Liberal National Neil Symes 11,26540.20−11.38
Labor gain from Liberal National Swing +11.38

Mackay

Queensland state election, 2015: Mackay [48]
PartyCandidateVotes%±
Labor Julieanne Gilbert 11,34643.83+5.25
Liberal National Deon Attard6,68025.80−11.14
Independent Julie Boyd5,72022.10+22.10
Greens Jonathon Dykyj1,2854.96−0.58
Family First Lindsay Temple8573.31+3.31
Total formal votes25,88897.54−0.26
Informal votes6532.46+0.26
Turnout 26,54189.44−0.31
Two-party-preferred result
Labor Julieanne Gilbert 13,54262.39+11.86
Liberal National Deon Attard8,16237.61−11.86
Labor hold Swing +11.86

Mansfield

Queensland state election, 2015: Mansfield [49]
PartyCandidateVotes%±
Liberal National Ian Walker 12,57446.88−6.79
Labor Adam Obeid10,87540.55+8.18
Greens Nick Jelicic2,4769.23+3.11
Independent Jarrod Wirth8953.34+2.54
Total formal votes26,82098.31+0.03
Informal votes4601.69−0.03
Turnout 27,28090.59−1.35
Two-party-preferred result
Liberal National Ian Walker 13,11350.55−10.59
Labor Adam Obeid12,82949.45+10.59
Liberal National hold Swing −10.59

Maroochydore

Queensland state election, 2015: Maroochydore [50]
PartyCandidateVotes%±
Liberal National Fiona Simpson 15,26748.46−9.70
Labor Bill Gissane7,74324.58+4.43
Palmer United James McDonald4,35613.83+13.83
Greens Trudy Byrnes4,13813.13+0.13
Total formal votes31,50497.93+0.10
Informal votes6662.07−0.10
Turnout 32,17087.78−0.44
Two-party-preferred result
Liberal National Fiona Simpson 16,76759.27−11.66
Labor Bill Gissane11,52340.73+11.66
Liberal National hold Swing −11.66

Maryborough

Queensland state election, 2015: Maryborough [51]
PartyCandidateVotes%±
Liberal National Anne Maddern 9,70230.56−5.19
Labor Bruce Saunders 8,03125.29+13.52
Independent Chris Foley 6,74921.26−8.92
Palmer United Stephen Anderson3,93112.38+12.38
One Nation Damian Huxham2,2176.98+6.98
Greens Katherine Webb8132.56−0.20
Independent Russell Wattie3090.97−29.20
Total formal votes31,75298.05+0.09
Informal votes6301.95−0.09
Turnout 32,38292.02−0.51
Two-party-preferred result
Labor Bruce Saunders 12,72351.65+1.96
Liberal National Anne Maddern 11,91048.35−1.96
Labor gain from Liberal National Swing +1.96

Mermaid Beach

Queensland state election, 2015: Mermaid Beach [52]
PartyCandidateVotes%±
Liberal National Ray Stevens 15,28752.35−12.78
Labor Gary Pead7,33325.11+6.64
Greens Helen Wainwright2,5778.83+1.37
Palmer United Alex Caraco2,2867.83+7.83
Family First Simon Green1,7185.88+3.01
Total formal votes29,20197.17−0.51
Informal votes8522.84+0.51
Turnout 30,05385.62−2.36
Two-party-preferred result
Liberal National Ray Stevens 16,37462.93−13.12
Labor Gary Pead9,64737.07+13.12
Liberal National hold Swing −13.12

Mirani

Queensland state election, 2015: Mirani [53]
PartyCandidateVotes%±
Labor Jimmy Pearce 12,91941.89+13.19
Liberal National John Kerslake11,50537.31−9.34
Palmer United Michael Hall5,14616.69+16.69
Greens Trisha Brindley1,2684.11+0.77
Total formal votes30,83897.99−0.26
Informal votes6332.01+0.26
Turnout 31,47192.28−0.10
Two-party-preferred result
Labor Jimmy Pearce 15,20654.82+16.01
Liberal National John Kerslake12,53445.18−16.01
Labor gain from Liberal National Swing +16.01

Moggill

Queensland state election, 2015: Moggill [54]
PartyCandidateVotes%±
Liberal National Christian Rowan 15,10450.16−13.11
Labor Louisa Pink7,60025.24+9.58
Greens Charles Worringham4,75815.80+2.00
Independent Barry Anthony Searle1,9596.51+6.51
Palmer United Dion Van Zyl6922.30+2.30
Total formal votes30,11398.51−0.01
Informal votes4551.49+0.01
Turnout 30,56891.93−0.91
Two-party-preferred result
Liberal National Christian Rowan 16,40358.21−15.70
Labor Louisa Pink11,77841.79+15.70
Liberal National hold Swing −15.70

Morayfield

Queensland state election, 2015: Morayfield [55]
PartyCandidateVotes%±
Labor Mark Ryan 14,95250.65+13.90
Liberal National Darren Grimwade 9,70832.88−14.14
Palmer United William Rogan1,9186.50+6.50
Greens Paul Costin1,3094.43−1.20
Family First Jon Eaton8903.01+3.01
Independent Stephen Beck5721.94+1.94
Independent Andrew Charles Tyrrell1740.59+0.59
Total formal votes29,52397.52+0.15
Informal votes7502.48−0.15
Turnout 30,27390.80−1.37
Two-party-preferred result
Labor Mark Ryan 17,07361.91+17.48
Liberal National Darren Grimwade 10,50238.09−17.48
Labor gain from Liberal National Swing +17.48

Mount Coot-tha

Queensland state election, 2015: Mount Coot-tha [56]
PartyCandidateVotes%±
Liberal National Saxon Rice 11,81442.98−4.76
Labor Steven Miles 8,96632.62+3.98
Greens Omar Ameer6,09522.17+1.46
Independent Charles McAlister6112.22+2.22
Total formal votes27,48698.75−0.02
Informal votes3491.25+0.02
Turnout 27,83587.64−1.89
Two-party-preferred result
Labor Steven Miles 13,92052.59+7.95
Liberal National Saxon Rice 12,55047.41−7.95
Labor gain from Liberal National Swing +7.95

Mount Isa

Queensland state election, 2015: Mount Isa [57]
PartyCandidateVotes%±
Katter's Australian Rob Katter 7,46846.77+5.16
Liberal National John Wharton4,64629.09−0.47
Labor Simon Tayler2,89918.15−8.49
One Nation Scott Sheard6384.00+4.00
Greens Marcus Foth3181.99−0.18
Total formal votes15,96998.37+0.01
Informal votes2641.63−0.01
Turnout 16,23383.59−1.83
Two-candidate-preferred result
Katter's Australian Rob Katter 9,30465.19+5.15
Liberal National John Wharton4,96834.81−5.15
Katter's Australian hold Swing +5.15

Mount Ommaney

Queensland state election, 2015: Mount Ommaney [58]
PartyCandidateVotes%±
Liberal National Tarnya Smith 13,26446.25−11.05
Labor Jess Pugh 11,15238.89+13.16
Greens Jenny Mulkearns3,16111.02+1.24
Palmer United Kathleen Hewlett1,1023.84+3.84
Total formal votes28,67998.16+0.19
Informal votes5371.84−0.19
Turnout 29,21692.22−0.66
Two-party-preferred result
Liberal National Tarnya Smith 13,90250.23−16.25
Labor Jess Pugh 13,77649.77+16.25
Liberal National hold Swing −16.25

Mudgeeraba

Queensland state election, 2015: Mudgeeraba [59]
PartyCandidateVotes%±
Liberal National Ros Bates 14,84650.58−11.11
Labor Georgi Leader8,11727.66+9.92
Greens Roger Brisbane2,2797.76+0.09
Palmer United Benedict Figueroa2,2447.65+7.65
Family First Chris Petersen1,3394.56−0.67
Independent Bill Sherwood5251.79+1.79
Total formal votes29,35097.29−0.43
Informal votes8192.71+0.43
Turnout 30,16988.43−1.18
Two-party-preferred result
Liberal National Ros Bates 16,15160.97−14.96
Labor Georgi Leader10,33739.03+14.96
Liberal National hold Swing −14.96

Mulgrave

Queensland state election, 2015: Mulgrave [60]
PartyCandidateVotes%±
Labor Curtis Pitt 13,60551.05+16.55
Liberal National Robyn Quick8,33431.27−0.73
Palmer United Christian Wolff2,82110.59+10.59
Greens Henry Boer1,0213.83+0.28
Independent Damian Byrnes8673.25+3.25
Total formal votes26,64897.73−0.40
Informal votes6182.27+0.40
Turnout 27,26688.66−1.71
Two-party-preferred result
Labor Curtis Pitt 15,51662.76+11.62
Liberal National Robyn Quick9,20537.24−11.62
Labor hold Swing +11.62

Mundingburra

Queensland state election, 2015: Mundingburra [61]
PartyCandidateVotes%±
Liberal National David Crisafulli 10,92141.32−2.02
Labor Coralee O'Rourke 10,59640.09+14.37
Palmer United Clive Mensink2,87410.87+10.87
Greens Jenny Brown2,0407.72+2.69
Total formal votes26,43197.76+0.11
Informal votes6062.24−0.11
Turnout 27,03789.60−0.29
Two-party-preferred result
Labor Coralee O'Rourke 13,10452.76+12.95
Liberal National David Crisafulli 11,73347.24−12.95
Labor gain from Liberal National Swing +12.95

Murrumba

Queensland state election, 2015: Murrumba [62]
PartyCandidateVotes%±
Labor Chris Whiting 16,99749.45+17.03
Liberal National Reg Gulley 13,19438.38−10.73
Greens Simone Dejun2,1316.20+1.32
Family First Ray Hutchinson2,0515.97+0.29
Total formal votes34,37397.82+0.11
Informal votes7672.18−0.11
Turnout 35,14089.80−2.09
Two-party-preferred result
Labor Chris Whiting 18,93457.35+16.87
Liberal National Reg Gulley 14,07942.65−16.87
Labor gain from Liberal National Swing +16.87

Nanango

Queensland state election, 2015: Nanango [63]
PartyCandidateVotes%±
Liberal National Deb Frecklington 14,69847.11+1.67
Labor Liz Hollens-Riley6,39720.50+9.95
Katter's Australian Ray Hopper 4,82715.47−10.86
Palmer United Jason Ford3,26910.48+10.48
Greens Grant Newson1,1703.75+0.08
Independent Dean Love8412.70+2.70
Total formal votes31,20298.09−0.01
Informal votes6061.91+0.01
Turnout 31,80891.89−0.59
Two-party-preferred result
Liberal National Deb Frecklington 16,49163.16+4.19
Labor Liz Hollens-Riley9,61736.84+36.84
Liberal National hold Swing +4.19

Nicklin

Queensland state election, 2015: Nicklin [64]
PartyCandidateVotes%±
Independent Peter Wellington 13,23743.79+4.65
Liberal National Matt Trace9,37931.03−4.84
Labor Justin Raethel4,94116.34+8.48
Greens Julie Doolan2,6738.84+1.77
Total formal votes30,23097.78−0.49
Informal votes6862.22+0.49
Turnout 30,91690.59−0.26
Two-candidate-preferred result
Independent Peter Wellington 18,05864.89+10.01
Liberal National Matt Trace9,77035.11−10.01
Independent hold Swing +10.01

Noosa

Queensland state election, 2015: Noosa [65]
PartyCandidateVotes%±
Liberal National Glen Elmes 15,45548.64−11.95
Greens Joe Shlegeris6,78921.37+5.86
Labor Mark Denham6,50620.48+8.04
Palmer United Ian Woods3,0239.51+9.51
Total formal votes31,77397.90−0.09
Informal votes6812.10+0.09
Turnout 32,45490.47+0.97
Two-candidate-preferred result
Liberal National Glen Elmes 16,51358.62−16.84
Greens Joe Shlegeris11,65741.38+16.84
Liberal National hold Swing −16.84

Nudgee

Queensland state election, 2015: Nudgee [66]
PartyCandidateVotes%±
Labor Leanne Linard 15,47049.69+12.20
Liberal National Jason Woodforth 10,53133.82−10.67
Greens Claire Ogden2,9799.57+1.48
Palmer United Peter Dufficy1,3614.37+4.37
Independent Edward Monaei7932.55+2.55
Total formal votes31,13498.24+0.43
Informal votes5591.76−0.43
Turnout 31,69390.30−1.80
Two-party-preferred result
Labor Leanne Linard 18,04661.25+14.36
Liberal National Jason Woodforth 11,41838.75−14.36
Labor gain from Liberal National Swing +14.36

Pine Rivers

Queensland state election, 2015: Pine Rivers [67]
PartyCandidateVotes%±
Labor Nikki Boyd 14,75248.47+21.06
Liberal National Seath Holswich 11,82038.84−14.10
Greens John Marshall2,4448.03−0.41
Independent Thor Prohaska1,4194.66+4.66
Total formal votes30,43597.91+0.52
Informal votes6512.09−0.52
Turnout 31,08692.34−0.84
Two-party-preferred result
Labor Nikki Boyd 16,95357.68+21.34
Liberal National Seath Holswich 12,44042.32−21.34
Labor gain from Liberal National Swing +21.34

Pumicestone

Queensland state election, 2015: Pumicestone [68]
PartyCandidateVotes%±
Liberal National Lisa France 13,97542.13−11.02
Labor Rick Williams 13,58940.97+10.53
Palmer United Blair Verrier2,4517.39+7.39
Greens Daniel O'Connell1,8245.50−0.55
Independent Bevan Collingwood9012.72+2.72
Independent Denis Johnson4311.30+1.30
Total formal votes33,17197.79+0.10
Informal votes7492.21−0.10
Turnout 33,92090.24−1.35
Two-party-preferred result
Labor Rick Williams 16,16652.08+14.15
Liberal National Lisa France 14,87447.92−14.15
Labor gain from Liberal National Swing +14.15

Redcliffe

Queensland state election, 2015: Redcliffe [69]
PartyCandidateVotes%±
Labor Yvette D'Ath 14,39947.24+16.48
Liberal National Kerri-Anne Dooley11,49737.72−11.52
Greens Peter Johnson1,6985.57−1.16
Palmer United Steven Griffith1,4774.85+4.85
Family First Mark A White7102.33−2.20
Independent Shayne Jarvis7012.30+2.30
Total formal votes30,48298.01+0.39
Informal votes6201.99−0.39
Turnout 31,10290.98−0.13
Two-party-preferred result
Labor Yvette D'Ath 16,60257.58+17.68
Liberal National Kerri-Anne Dooley12,23042.42−17.68
Labor hold Swing +17.68

Redlands

Queensland state election, 2015: Redlands [70]
PartyCandidateVotes%±
Liberal National Matt McEachan 13,34043.86−21.94
Labor Deborah Kellie10,44234.33+10.28
Greens David Keogh2,2617.43−2.72
Independent Sheena Hewlett1,9396.37+6.37
Palmer United Susan Bylett1,8095.95+5.95
Family First Carolyn Ferrando6252.05+2.05
Total formal votes30,41697.67+0.10
Informal votes7262.33−0.10
Turnout 31,14291.52−0.64
Two-party-preferred result
Liberal National Matt McEachan 14,39952.23−18.87
Labor Deborah Kellie13,16747.77+18.87
Liberal National hold Swing −18.87

Rockhampton

Queensland state election, 2015: Rockhampton [71]
PartyCandidateVotes%±
Labor Bill Byrne 15,43252.88+13.09
Liberal National Bridie Luva8,86930.39−1.37
Greens Michelle Taylor1,8636.38+2.93
Family First Sally-Anne Vincent1,7035.84+3.18
Independent Anne O'Connor1,3174.51+3.48
Total formal votes29,18497.27+0.26
Informal votes8182.73−0.26
Turnout 30,00291.76+0.03
Two-party-preferred result
Labor Bill Byrne 17,30163.87+9.92
Liberal National Bridie Luva9,78736.13−9.92
Labor hold Swing +9.92

Sandgate

Queensland state election, 2015: Sandgate [72]
PartyCandidateVotes%±
Labor Stirling Hinchliffe 14,80249.74+12.09
Liberal National Kerry Millard 10,96736.85−6.90
Greens John Harbison3,03310.19+1.21
Independent Hamish Gray9593.22+1.58
Total formal votes29,76198.09+0.33
Informal votes5801.91−0.33
Turnout 30,34191.90−1.16
Two-party-preferred result
Labor Stirling Hinchliffe 17,26260.10+12.97
Liberal National Kerry Millard 11,46239.90−12.97
Labor gain from Liberal National Swing +12.97

South Brisbane

Queensland state election, 2015: South Brisbane [73]
PartyCandidateVotes%±
Labor Jackie Trad 12,35542.71+4.15
Liberal National Fiona Ward9,32132.22−5.85
Greens Jonathan Sri6,32021.85+3.78
Independent Karel Boele9303.22+1.32
Total formal votes28,92698.35+0.42
Informal votes4841.65−0.42
Turnout 29,41086.75−0.36
Two-party-preferred result
Labor Jackie Trad 17,69763.79+9.13
Liberal National Fiona Ward10,04536.21−9.13
Labor hold Swing +9.13

Southern Downs

Queensland state election, 2015: Southern Downs [74]
PartyCandidateVotes%±
Liberal National Lawrence Springborg 19,27562.79−3.83
Labor Louise Ryan7,20123.46+10.05
Greens Elizabeth Ure2,2007.17+3.25
Family First John Spellman2,0226.59+4.39
Total formal votes30,69898.01−0.26
Informal votes6231.99+0.26
Turnout 31,32192.46+0.13
Two-party-preferred result
Liberal National Lawrence Springborg 20,00869.20−10.57
Labor Louise Ryan8,90630.80+10.57
Liberal National hold Swing −10.57

Southport

Queensland state election, 2015: Southport [75]
PartyCandidateVotes%±
Liberal National Rob Molhoek 13,28745.92−9.92
Labor Rowan Holzberger10,15335.09+6.66
Greens Petrina Maizey2,4468.45+1.76
Palmer United Nicole Stanton2,4028.30+8.30
Independent Matthew Mackechnie6462.23+0.64
Total formal votes28,93497.19+0.12
Informal votes8362.81−0.12
Turnout 29,77085.30−2.29
Two-party-preferred result
Liberal National Rob Molhoek 14,13353.24−11.48
Labor Rowan Holzberger12,41546.76+11.48
Liberal National hold Swing −11.48

Springwood

Queensland state election, 2015: Springwood [76]
PartyCandidateVotes%±
Liberal National John Grant 12,54742.08−13.58
Labor Mick de Brenni 12,26041.12+13.13
Greens Janina Leo2,5958.70+2.03
Palmer United Peter Chamberlain1,5045.04+5.04
Family First Chris Lawrie9083.05+0.09
Total formal votes29,81498.13+0.27
Informal votes5671.87−0.27
Turnout 30,38190.97−0.38
Two-party-preferred result
Labor Mick de Brenni 14,66151.73+17.12
Liberal National John Grant 13,67848.27−17.12
Labor gain from Liberal National Swing +17.12

Stafford

Queensland state election, 2015: Stafford [77]
PartyCandidateVotes%±
Labor Anthony Lynham 13,82448.14+14.57
Liberal National Bob Andersen10,82237.69−12.54
Greens Anne Boccabella4,06914.17+2.87
Total formal votes28,71598.35+0.25
Informal votes4821.65−0.25
Turnout 29,19791.16−0.20
Two-party-preferred result
Labor Anthony Lynham 16,59059.59+16.65
Liberal National Bob Andersen11,24940.41−16.65
Labor hold Swing +16.65

Stretton

Queensland state election, 2015: Stretton [78]
PartyCandidateVotes%±
Labor Duncan Pegg 11,87641.39+12.67
Liberal National Freya Ostapovitch 10,88437.93−8.92
Independent David Forde4,43115.44−3.51
Greens Brian Sadler1,5025.23−0.25
Total formal votes28,69397.99+0.42
Informal votes5882.01−0.42
Turnout 29,28188.56−1.59
Two-party-preferred result
Labor Duncan Pegg 14,38654.98+14.54
Liberal National Freya Ostapovitch 11,77845.02−14.54
Labor gain from Liberal National Swing +14.54

Sunnybank

Queensland state election, 2015: Sunnybank [79]
PartyCandidateVotes%±
Labor Peter Russo 12,99349.27+16.54
Liberal National Mark Stewart 10,53739.96−12.74
Greens Gordon King2,83910.77+1.21
Total formal votes26,36997.68+0.47
Informal votes6262.32−0.47
Turnout 26,99587.67−1.27
Two-party-preferred result
Labor Peter Russo 14,56457.19+17.42
Liberal National Mark Stewart 10,90142.81−17.42
Labor gain from Liberal National Swing +17.42

Surfers Paradise

Queensland state election, 2015: Surfers Paradise [80]
PartyCandidateVotes%±
Liberal National John-Paul Langbroek 17,56961.06−11.57
Labor Josh Blundell-Thornton6,54422.74+6.20
Greens Helen Hunt2,2217.72+0.60
Palmer United Stephen Gardner1,7496.08+6.08
Family First Jonathon Scoones6922.40−1.31
Total formal votes28,77597.94+0.18
Informal votes6052.06−0.18
Turnout 29,38084.12−2.57
Two-party-preferred result
Liberal National John-Paul Langbroek 18,40569.21−10.29
Labor Josh Blundell-Thornton8,18830.79+10.29
Liberal National hold Swing −10.29

Thuringowa

Queensland state election, 2015: Thuringowa [81]
PartyCandidateVotes%±
Labor Aaron Harper 11,58439.51+12.15
Liberal National Sam Cox 9,94533.92−2.22
Palmer United Ian Ferguson3,40711.62+11.62
One Nation Jeff Knuth 2,1617.37+7.37
Greens Karen Thompson1,0283.51−0.12
Family First Michael Waters6172.10−0.65
Independent Margaret Bell5791.97+1.97
Total formal votes29,32197.37+0.07
Informal votes7922.63−0.07
Turnout 30,11389.49−0.29
Two-party-preferred result
Labor Aaron Harper 14,31255.54+6.92
Liberal National Sam Cox 11,45644.46−6.92
Labor gain from Liberal National Swing +6.92

Toowoomba North

Queensland state election, 2015: Toowoomba North [82]
PartyCandidateVotes%±
Liberal National Trevor Watts 13,93244.41−5.35
Labor Kerry Shine 12,16638.78+6.49
Palmer United Mandeep Sandhu1,5785.03+5.03
Greens Ken Gover1,4304.56−0.32
Katter's Australian Ken Elliott1,0503.35−8.29
Family First John Sands8712.78+2.78
Independent Greg Keane3471.11−0.34
Total formal votes31,37498.11−0.05
Informal votes6061.89+0.05
Turnout 31,98091.00−1.36
Two-party-preferred result
Liberal National Trevor Watts 14,99951.61−7.97
Labor Kerry Shine 14,06448.39+7.97
Liberal National hold Swing −7.97

Toowoomba South

Queensland state election, 2015: Toowoomba South [83]
PartyCandidateVotes%±
Liberal National John McVeigh 16,85155.33−3.20
Labor Graham Storey10,60134.81+13.78
Greens Anne Waters3,0039.86+4.38
Total formal votes30,45597.54−0.40
Informal votes7672.46+0.40
Turnout 31,22290.99−0.95
Two-party-preferred result
Liberal National John McVeigh 17,21658.89−12.73
Labor Graham Storey12,01841.11+12.73
Liberal National hold Swing −12.73

Townsville

Queensland state election, 2015: Townsville [84]
PartyCandidateVotes%±
Labor Scott Stewart 11,26740.06+10.79
Liberal National John Hathaway 10,13036.02−2.62
Palmer United Alan Birrell2,6979.59+9.59
Greens Gail Hamilton2,3568.38+0.70
One Nation Leanne Rissman1,0793.84+3.84
Family First Michael Punshon5962.12−0.48
Total formal votes28,12597.87+0.11
Informal votes6132.13−0.11
Turnout 28,73887.12−0.38
Two-party-preferred result
Labor Scott Stewart 14,28055.69+10.52
Liberal National John Hathaway 11,36044.31−10.52
Labor gain from Liberal National Swing +10.52

Warrego

Queensland state election, 2015: Warrego [85]
PartyCandidateVotes%±
Liberal National Ann Leahy 13,28554.96−3.17
Labor Mark O'Brien6,39826.47+13.82
Palmer United Guy Sara2,1799.01+9.01
Independent Ruth Golden1,6636.88−6.31
Greens Sandra Bayley6492.68+0.70
Total formal votes24,17497.93−0.47
Informal votes5102.07+0.47
Turnout 24,68491.45−0.32
Two-party-preferred result
Liberal National Ann Leahy 14,25565.43−9.63
Labor Mark O'Brien7,53134.57+9.63
Liberal National hold Swing −9.63

Waterford

Queensland state election, 2015: Waterford [86]
PartyCandidateVotes%±
Labor Shannon Fentiman 15,64552.40+13.77
Liberal National Mike Latter 9,34731.30−8.31
Greens Ray Smith2,5378.50+1.49
Independent Jeffrey Hodges1,4544.87+3.49
Independent Jason Dickson8762.93+1.55
Total formal votes29,85996.95+0.37
Informal votes9383.05−0.37
Turnout 30,79787.00−2.31
Two-party-preferred result
Labor Shannon Fentiman 17,82063.33+14.37
Liberal National Mike Latter 10,31936.67−14.37
Labor gain from Liberal National Swing +14.37

Whitsunday

Queensland state election, 2015: Whitsunday [87]
PartyCandidateVotes%±
Liberal National Jason Costigan 13,47441.76−2.62
Labor Bronwyn Taha11,77536.49+9.07
Palmer United Kylee Stanton4,04712.54+12.54
Greens Tony Fontes1,9726.11+0.23
Independent Dan Van Blarcom9973.09+3.09
Total formal votes32,26597.89−0.43
Informal votes6952.11+0.43
Turnout 32,96089.54−0.85
Two-party-preferred result
Liberal National Jason Costigan 14,56550.38−10.30
Labor Bronwyn Taha14,34749.62+10.30
Liberal National hold Swing −10.30

Woodridge

Queensland state election, 2015: Woodridge [88]
PartyCandidateVotes%±
Labor Cameron Dick 16,37562.72+15.97
Liberal National Steve Viliamu5,14019.69−16.23
Greens Scott Thomson1,9227.36−1.21
Independent Trevor Palmer1,7186.58+6.58
Independent Dave Beard9543.65+3.65
Total formal votes26,10996.49+0.59
Informal votes9513.51−0.59
Turnout 27,06086.54−1.50
Two-party-preferred result
Labor Cameron Dick 18,43775.95+20.15
Liberal National Steve Viliamu5,83924.05−20.15
Labor hold Swing +20.15

Yeerongpilly

Queensland state election, 2015: Yeerongpilly [89]
PartyCandidateVotes%±
Labor Mark Bailey 13,14843.07+8.53
Liberal National Leila Abukar 9,57931.38−11.84
Greens Gillian Marshall-Pierce5,08416.66+0.69
Independent Carl Judge 1,8376.02+6.02
Palmer United Georgina Walton8762.87+2.87
Total formal votes30,52498.37+0.08
Informal votes5071.63−0.08
Turnout 31,03190.33−1.63
Two-party-preferred result
Labor Mark Bailey 18,20263.30+14.74
Liberal National Leila Abukar 10,55136.70−14.74
Labor gain from Liberal National Swing +14.74

Related Research Articles

Electoral district of Toowoomba South state electoral district of Queensland, Australia

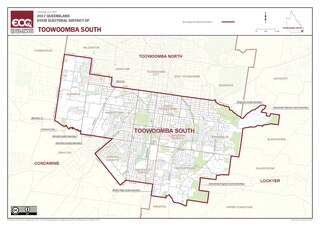
Toowoomba South is an electoral district of the Legislative Assembly in the Australian state of Queensland. It was created with the 1972 redistribution, and replaced the abolished Toowoomba East.

Electoral district of Toowoomba North state electoral district of Queensland, Australia

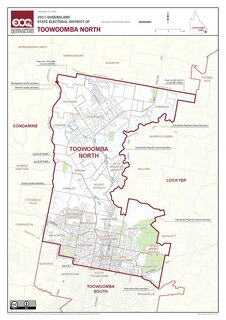
Toowoomba North is an electoral district of the Legislative Assembly in the Australian state of Queensland. It was created with the 1972 redistribution. It replaced the abolished electorate of Toowoomba West.

Electoral district of Lockyer state electoral district of Queensland, Australia

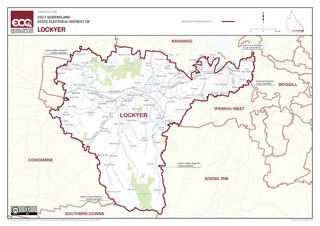
Lockyer is an electoral district of the Legislative Assembly in the Australian state of Queensland.

Electoral district of Mount Ommaney state electoral district of Queensland, Australia

Mount Ommaney is an electoral district of the Legislative Assembly in the Australian state of Queensland. It was created with the 1992 redistribution.

Electoral district of Moggill state electoral district of Queensland, Australia

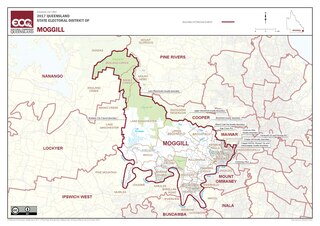
Moggill is an electoral district in the Legislative Assembly of Queensland in the state of Queensland, Australia. The electorate is held by the former state president of the Australian Medical Association, Dr Christian Rowan, for the Liberal National Party of Queensland.

Electoral district of Greenslopes state electoral district of Queensland, Australia

Greenslopes is an electoral district of the Legislative Assembly in the Australian state of Queensland.

Electoral district of Ipswich state electoral district of Queensland, Australia

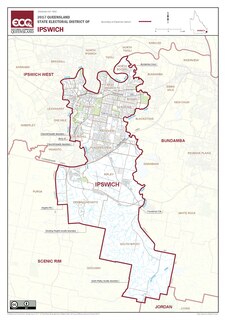
Ipswich is a Legislative Assembly of Queensland electoral district on the Brisbane River, west of Brisbane in the Australian state of Queensland. The electorate includes Ipswich and its suburbs, south and east of the Bremer River, west of Bundamba Creek and north of the Cunningham Highway.

Electoral district of Redlands state electoral district of Queensland, Australia

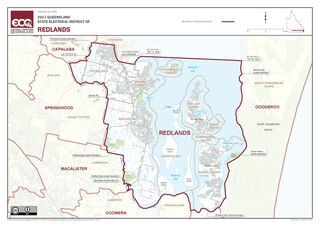
Redlands is an electoral district of the Legislative Assembly in the Australian state of Queensland. It primarily covers coastal suburbs on the southside of the city of Brisbane, from Thornlands south to the Logan River.

Electoral district of Lytton state electoral district of Queensland, Australia

Lytton is an electoral district of the Legislative Assembly in the Australian state of Queensland.

Electoral district of Ipswich West state electoral district of Queensland, Australia

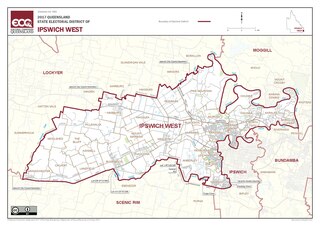
Ipswich West is an electoral district of the Legislative Assembly in the Australian state of Queensland.

Electoral district of Mansfield state electoral district of Queensland, Australia

Mansfield is an electoral district of the Legislative Assembly in the Australian state of Queensland.

Patricia May Petersen is an Australian academic from Ipswich, Queensland.

This is a list of electoral results for the electoral district of Ipswich in Queensland state elections.

This is a list of electoral results for the electoral district of Ipswich West in Queensland state elections.

This is a list of electoral results for the electoral district of Mount Ommaney in Queensland state elections.

This is a list of electoral results for the electoral district of South Brisbane in Queensland state elections.

This is a list of electoral results for the electoral district of Toowoomba North in Queensland state elections.

This is a list of electoral results for the electoral district of Toowoomba South in Queensland state elections.

Electoral district of Maiwar state electoral district of Queensland, Australia

Maiwar is an electoral district of the Legislative Assembly in the Australian state of Queensland, incorporating the inner western suburbs of Brisbane. It was created in the 2017 redistribution, and was first contested at the 2017 Queensland state election. It is named for the Indigenous name of the Brisbane River, which is the southern boundary of the electorate.

This is a list of electoral district results for the Queensland 2017 election.

References

  1. 2015 State General Election - Albert - District Summary, ECQ.
  2. 2015 State General Election - Algester - District Summary, ECQ.
  3. 2015 State General Election - Ashgrove - District Summary, ECQ.
  4. 2015 State General Election - Aspley - District Summary, ECQ.
  5. 2015 State General Election - Barron River - District Summary, ECQ.
  6. 2015 State General Election - Beaudesert - District Summary, ECQ.
  7. 2015 State General Election - Brisbane Central - District Summary, ECQ.
  8. 2015 State General Election - Broadwater - District Summary, ECQ.
  9. 2015 State General Election - Buderim - District Summary, ECQ.
  10. 2015 State General Election - Bulimba - District Summary, ECQ.
  11. 2015 State General Election - Bundaberg - District Summary, ECQ.
  12. 2015 State General Election - Bundamba - District Summary, ECQ.
  13. 2015 State General Election - Burdekin - District Summary, ECQ.
  14. 2015 State General Election - Burleigh - District Summary, ECQ.
  15. 2015 State General Election - Burnett - District Summary, ECQ.
  16. 2015 State General Election - Cairns - District Summary, ECQ.
  17. 2015 State General Election - Callide - District Summary, ECQ.
  18. 2015 State General Election - Caloundra - District Summary, ECQ.
  19. 2015 State General Election - Capalaba - District Summary, ECQ.
  20. 2015 State General Election - Chatsworth - District Summary, ECQ.
  21. 2015 State General Election - Clayfield - District Summary, ECQ.
  22. 2015 State General Election - Cleveland - District Summary, ECQ.
  23. 2015 State General Election - Condamine - District Summary, ECQ.
  24. 2015 State General Election - Cook - District Summary, ECQ.
  25. 2015 State General Election - Coomera - District Summary, ECQ.
  26. 2015 State General Election - Currumbin - District Summary, ECQ.
  27. 2015 State General Election - Dalrymple - District Summary, ECQ.
  28. 2015 State General Election - Everton - District Summary, ECQ.
  29. 2015 State General Election - Ferny Grove - District Summary, ECQ.
  30. 2015 State General Election - Gaven - District Summary, ECQ.
  31. 2015 State General Election - Gladstone - District Summary, ECQ.
  32. 2015 State General Election - Glass House - District Summary, ECQ.
  33. 2015 State General Election - Greenslopes - District Summary, ECQ.
  34. 2015 State General Election - Gregory - District Summary, ECQ.
  35. 2015 State General Election - Gympie - District Summary, ECQ.
  36. 2015 State General Election - Hervey Bay - District Summary, ECQ.
  37. 2015 State General Election - Hinchinbrook - District Summary, ECQ.
  38. 2015 State General Election - Inala - District Summary, ECQ.
  39. 2015 State General Election - Indooroopilly - District Summary, ECQ.
  40. 2015 State General Election - Ipswich - District Summary, ECQ.
  41. 2015 State General Election - Ipswich West - District Summary, ECQ.
  42. 2015 State General Election - Kallangur - District Summary, ECQ.
  43. 2015 State General Election - Kawana - District Summary, ECQ.
  44. 2015 State General Election - Keppel - District Summary, ECQ.
  45. 2015 State General Election - Lockyer - District Summary, ECQ.
  46. 2015 State General Election - Logan - District Summary, ECQ.
  47. 2015 State General Election - Lytton - District Summary, ECQ.
  48. 2015 State General Election - Mackay - District Summary, ECQ.
  49. 2015 State General Election - Mansfield - District Summary, ECQ.
  50. 2015 State General Election - Maroochydore - District Summary, ECQ.
  51. 2015 State General Election - Maryborough - District Summary, ECQ.
  52. 2015 State General Election - Mermaid Beach - District Summary, ECQ.
  53. 2015 State General Election - Mirani - District Summary, ECQ.
  54. 2015 State General Election - Moggill - District Summary, ECQ.
  55. 2015 State General Election - Morayfield - District Summary, ECQ.
  56. 2015 State General Election - Mount Coot-tha - District Summary, ECQ.
  57. 2015 State General Election - Mount Isa - District Summary, ECQ.
  58. 2015 State General Election - Mount Ommaney - District Summary, ECQ.
  59. 2015 State General Election - Mudgeeraba - District Summary, ECQ.
  60. 2015 State General Election - Mulgrave - District Summary, ECQ.
  61. 2015 State General Election - Mundingburra - District Summary, ECQ.
  62. 2015 State General Election - Murrumba - District Summary, ECQ.
  63. 2015 State General Election - Nanango - District Summary, ECQ.
  64. 2015 State General Election - Nicklin - District Summary, ECQ.
  65. 2015 State General Election - Noosa - District Summary, ECQ.
  66. 2015 State General Election - Nudgee - District Summary, ECQ.
  67. 2015 State General Election - Pine Rivers - District Summary, ECQ.
  68. 2015 State General Election - Pumicestone - District Summary, ECQ.
  69. 2015 State General Election - Redcliffe - District Summary, ECQ.
  70. 2015 State General Election - Redlands - District Summary, ECQ.
  71. 2015 State General Election - Rockhampton - District Summary, ECQ.
  72. 2015 State General Election - Sandgate - District Summary, ECQ.
  73. 2015 State General Election - South Brisbane - District Summary, ECQ.
  74. 2015 State General Election - Southern Downs - District Summary, ECQ.
  75. 2015 State General Election - Southport - District Summary, ECQ.
  76. 2015 State General Election - Springwood - District Summary, ECQ.
  77. 2015 State General Election - Stafford - District Summary, ECQ.
  78. 2015 State General Election - Stretton - District Summary, ECQ.
  79. 2015 State General Election - Sunnybank - District Summary, ECQ.
  80. 2015 State General Election - Surfers Paradise - District Summary, ECQ.
  81. 2015 State General Election - Thuringowa - District Summary, ECQ.
  82. 2015 State General Election - Toowoomba North - District Summary, ECQ.
  83. 2015 State General Election - Toowoomba South - District Summary, ECQ.
  84. 2015 State General Election - Townsville - District Summary, ECQ.
  85. 2015 State General Election - Warrego - District Summary, ECQ.
  86. 2015 State General Election - Waterford - District Summary, ECQ.
  87. 2015 State General Election - Whitsunday - District Summary, ECQ.
  88. 2015 State General Election - Woodridge - District Summary, ECQ.
  89. 2015 State General Election - Yeerongpilly - District Summary, ECQ.