Elections to Stoke-on-Trent City Council took place on 6 May 2010, coinciding with the national General election. One third - 20 seats - of the council were up for election.
Stoke-on-Trent City Council is the local authority of Stoke-on-Trent, a unitary authority in the West Midlands region. As a unitary authority it has the powers of a non-metropolitan county and district council combined. As such, it is administratively separate from the rest of Staffordshire.
After the election, the parties were represented thus: Labour 27 seats; Conservative 8 seats; British National Party 5 seats; Liberal Democrat 5 seats; Others 15 seats. Although Labour had greatly improved its position, becoming the largest party, the council remained in no overall control.
In the context of local authorities in the United Kingdom, the term no overall control refers to a situation in which no single political group achieves a majority of seats; and is analogous to a hung parliament. Of the 310 councils who had members up for election in the 2007 local elections, 85 resulted in a NOC administration.
Party | Seats | Gains | Losses | Net gain/loss | Seats % | Votes % | Votes | +/− | |
---|---|---|---|---|---|---|---|---|---|
Labour | 17 | 11 | - | 11 | 85 | 35.28 | 34,000 | ||
Conservative | 2 | - | - | 0 | 10 | 24.04 | 23,164 | ||
Liberal Democrat | 1 | - | 2 | -2 | 5 | 21.28 | 20,513 | ||
Independent | 0 | - | 6 | -6 | 0 | 14.45 | 13,927 | ||
UKIP | 0 | - | - | - | - | 5.21 | 5,022 | ||
BNP | 0 | - | 3 | -3 | 0 | 4.95 | 4,770 | ||
England First | 0 | - | - | - | - | 1.00 | 959 | ||
Turnout | 30.2 | 55,988 | |||||||
Party | Candidate | Votes | % | ± | |
---|---|---|---|---|---|
Labour | Gwenyth Hassall | 1639 | 32.85 | ||
Conservative | Simon Sykes | 1170 | 23.45 | ||
BNP | Michael Durkin | 835 | 16.73 | ||
Liberal Democrat | Anita Gill | 809 | 16.21 | ||
Independent | Neil Walker | 279 | 5.59 | ||
Independent | Alexandrina Knight | 258 | 5.17 | ||
Majority | 469 | 9.40 | |||
Turnout | 4990 | ||||
Labour gain from BNP | Swing | ||||
Party | Candidate | Votes | % | ± | |
---|---|---|---|---|---|
Labour | Mervin Smith | 1653 | 39.25 | ||
BNP | Philip Sandland | 864 | 20.52 | ||
Conservative | Amy Sykes | 618 | 14.68 | ||
Liberal Democrat | Nigel Smith | 567 | 13.46 | ||
Independent | Wendy Johnson | 291 | 6.91 | ||
Independent | Margaret Lowe | 218 | 5.18 | ||
Majority | 789 | 18.74 | |||
Turnout | 4211 | ||||
Labour gain from BNP | Swing | ||||
Party | Candidate | Votes | % | ± | |
---|---|---|---|---|---|
Labour | Adrian Knapper | 1486 | 36.86 | ||
Conservative | David Jones | 973 | 24.14 | ||
Liberal Democrat | Leslie Porch | 738 | 18.31 | ||
UKIP | Geoffrey Clewlow | 450 | 11.16 | ||
Independent | Denise Maddison | 384 | 9.53 | ||
Majority | 513 | 12.73 | |||
Turnout | 4031 | ||||
Labour hold | Swing | ||||
Party | Candidate | Votes | % | ± | |
---|---|---|---|---|---|
Labour | Margaret Barber | 1741 | 35.04 | ||
Conservative | Harold Mouat | 939 | 18.90 | ||
Liberal Democrat | Christine Grocock | 873 | 17.57 | ||
BNP | Terence Cope | 764 | 15.38 | ||
Independent | Jamie Naylor | 652 | 13.12 | ||
Majority | 802 | 16.14 | |||
Turnout | 4969 | ||||
Labour gain from Independent | Swing | ||||
Party | Candidate | Votes | % | ± | |
---|---|---|---|---|---|
Labour | Joy Garner | 2074 | 44.52 | ||
Liberal Democrat | Sharon Black | 978 | 20.99 | ||
Conservative | Donald Smith | 952 | 20.43 | ||
UKIP | James Smith | 655 | 14.06 | ||
Majority | 1096 | 23.52 | |||
Turnout | 4659 | ||||
Labour hold | Swing | ||||
Party | Candidate | Votes | % | ± | |
---|---|---|---|---|---|
Labour | Mohammed Pervez | 1866 | 42.28 | ||
Independent | Edward Owen | 918 | 20.80 | ||
Conservative | Gareth Fallows | 838 | 18.99 | ||
Liberal Democrat | Mohammed Chowdhury | 511 | 11.58 | ||
Independent | Forid Ali | 280 | 6.34 | ||
Majority | 948 | 21.48 | |||
Turnout | 4413 | ||||
Labour hold | Swing | ||||
Party | Candidate | Votes | % | ± | |
---|---|---|---|---|---|
Labour | Anthony Fradley | 1835 | 36.27 | ||
Independent | Ann James | 1328 | 26.25 | ||
Labour | Nicholas Jellyman | 842 | 16.64 | ||
UKIP | Christopher McCabe | 547 | 10.81 | ||
Liberal Democrat | Mazhar Hussain | 507 | 10.02 | ||
Majority | 507 | 10.02 | |||
Turnout | 5059 | ||||
Labour gain from Independent | Swing | ||||
Party | Candidate | Votes | % | ± | |
---|---|---|---|---|---|
Labour | Matt Wilcox | 1973 | 34.38 | ||
Conservative | Jack Brereton | 1675 | 29.19 | ||
Liberal Democrat | Susan Ford | 1043 | 18.17 | ||
UKIP | Andrew Smith | 461 | 8.03 | ||
Independent | Geoffrey Knight | 303 | 5.28 | ||
Independent | Roger Ibbs | 240 | 4.18 | ||
Independent | Andrew Wragg | 44 | 0.77 | ||
Majority | 298 | 5.19 | |||
Turnout | 5739 | ||||
Labour gain from Liberal Democrat | Swing | ||||
Party | Candidate | Votes | % | ± | |
---|---|---|---|---|---|
Labour | Sarah Hill | 1581 | 32.58 | ||
Conservative | Stephen Brown | 962 | 19.82 | ||
Liberal Democrat | Stephen Blakemore | 946 | 19.49 | ||
UKIP | John Cope | 465 | 9.58 | ||
Independent | Marjorie Bate | 451 | 9.29 | ||
England First | Kathleen Ward | 236 | 4.86 | ||
Independent | Sharon Baggaley | 212 | 4.37 | ||
Majority | 619 | 12.75 | |||
Turnout | 4853 | ||||
Labour gain from Independent | Swing | ||||
Party | Candidate | Votes | % | ± | |
---|---|---|---|---|---|
Labour | Mohammad Wazir | 1631 | 42.95 | ||
Liberal Democrat | Asim Shaheen | 1340 | 35.29 | ||
Conservative | Eleanor Bloor | 826 | 21.75 | ||
Majority | 291 | 7.66 | |||
Turnout | 3797 | ||||
Labour hold | Swing | ||||
Party | Candidate | Votes | % | ± | |
---|---|---|---|---|---|
Labour | Kassem al-Khatib | 1492 | 27.21 | ||
Liberal Democrat | Paul Billington | 1452 | 26.48 | ||
Conservative | Shaun Bennett | 1155 | 21.06 | ||
Independent | Ian Mitchell | 495 | 9.03 | ||
UKIP | Steven Morris | 461 | 8.41 | ||
Independent | Michael Williams | 429 | 7.82 | ||
Majority | 40 | 0.73 | |||
Turnout | 5484 | ||||
Labour gain from Independent | Swing | ||||
Party | Candidate | Votes | % | ± | |
---|---|---|---|---|---|
Labour | Thomas Tolley | 2436 | 41.34 | ||
Conservative | James Whitehurst | 1272 | 21.58 | ||
Liberal Democrat | Conrad Lubinski | 814 | 13.81 | ||
England First | Mark Leat | 606 | 10.28 | ||
UKIP | Paul Goodwin | 488 | 8.28 | ||
Independent | Sheila Cowell | 277 | 4.70 | ||
Majority | 1164 | 19.75 | |||
Turnout | 5893 | ||||
Labour hold | Swing | ||||
Party | Candidate | Votes | % | ± | |
---|---|---|---|---|---|
Labour | Olwen Hamer | 2114 | 33.27 | ||
Independent | Lilian Dodd | 1585 | 24.94 | ||
Liberal Democrat | Sadaqat Maqsoom | 1373 | 21.61 | ||
Conservative | Daniel Harley | 1283 | 20.19 | ||
Majority | 529 | 8.32 | |||
Turnout | 6355 | ||||
Labour hold | Swing | ||||
Party | Candidate | Votes | % | ± | |
---|---|---|---|---|---|
Conservative | Abigail Brown | 2215 | 36.94 | ||
Labour | Alastair Watson | 1900 | 31.68 | ||
Liberal Democrat | Brian Whittaker | 1471 | 24.53 | ||
Independent | Jacqueline Pearson | 411 | 6.85 | ||
Majority | 315 | 5.25 | |||
Turnout | 5997 | ||||
Conservative hold | Swing | ||||
Party | Candidate | Votes | % | ± | |
---|---|---|---|---|---|
Liberal Democrat | Jean Bowers | 2091 | 42.99 | ||
Labour | Mahfooz Ahmad | 1194 | 24.55 | ||
Conservative | Pamela Jellyman | 839 | 17.25 | ||
Independent | Eve Maley | 740 | 15.21 | ||
Majority | 897 | 18.44 | |||
Turnout | 4864 | ||||
Liberal Democrat hold | Swing | ||||
Party | Candidate | Votes | % | ± | |
---|---|---|---|---|---|
Labour | Duncan Walker | 1485 | 29.61 | ||
Conservative | Austin Cooke | 1045 | 20.83 | ||
Independent | John Nicholls | 824 | 16.43 | ||
Liberal Democrat | Elaine Bowen | 711 | 14.17 | ||
Independent | Sheila Matthews | 579 | 11.54 | ||
UKIP | Sean Daley | 372 | 7.42 | ||
Majority | 440 | 8.77 | |||
Turnout | 5016 | ||||
Labour gain from Independent | Swing | ||||
Party | Candidate | Votes | % | ± | |
---|---|---|---|---|---|
Labour | Jeremy Dillon | 1475 | 29.10 | ||
Liberal Democrat | Thomas Grocock | 1243 | 24.52 | ||
Conservative | Harold Gregory | 832 | 16.41 | ||
Independent | Alan Joynson | 634 | 12.51 | ||
BNP | Stephen Issard | 524 | 10.34 | ||
UKIP | Michael Harold | 361 | 7.12 | ||
Majority | 232 | 4.58 | |||
Turnout | 5069 | ||||
Labour gain from Liberal Democrat | Swing | ||||
Party | Candidate | Votes | % | ± | |
---|---|---|---|---|---|
Conservative | Mark Wright | 2500 | 38.06 | ||
Labour | Lloyd Brown | 1368 | 20.83 | ||
Liberal Democrat | Alan Alcock | 1321 | 20.11 | ||
Independent | Peter Hayward | 884 | 13.46 | ||
UKIP | Philip Smith | 496 | 7.55 | ||
Majority | 1132 | 17.23 | |||
Turnout | 6569 | ||||
Conservative hold | Swing | ||||
Party | Candidate | Votes | % | ± | |
---|---|---|---|---|---|
Labour | Majid Khan | 1366 | 25.84 | ||
Independent | Lee Wanger | 1211 | 22.91 | ||
Liberal Democrat | Mohammed Nadeem | 887 | 16.78 | ||
Conservative | Laura Baskeyfield | 844 | 15.96 | ||
BNP | Paula Roberts | 713 | 13.49 | ||
UKIP | David Parfitt | 266 | 5.03 | ||
Majority | 155 | 2.93 | |||
Turnout | 5287 | ||||
Labour gain from Independent | Swing | ||||
Party | Candidate | Votes | % | ± | |
---|---|---|---|---|---|
Labour | Ruth Rosenau | 1691 | 33.16 | ||
Conservative | Ross Ward | 1384 | 27.14 | ||
BNP | Anthony Simmonds | 1070 | 20.98 | ||
Liberal Democrat | Sabrina Bowers | 838 | 16.43 | ||
England First | Spencer Cartlidge | 117 | 2.29 | ||
Majority | 307 | 6.02 | |||
Turnout | 5100 | ||||
Labour gain from BNP | Swing | ||||
The 2006 St Helens Metropolitan Borough Council election took place on 4 May 2006 to elect members of St Helens Metropolitan Borough Council in Merseyside, England. One third of the council was up for election and the council stayed under no overall control.
The 1998 Tamworth Borough Council election took place on 7 May 1998 to elect members of Tamworth District Council in Staffordshire, England. One third of the council was up for election and the Labour party stayed in overall control of the council.
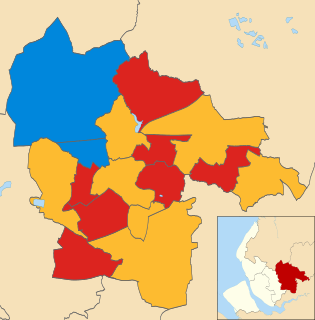
The 2007 St Helens Metropolitan Borough Council election took place on 3 May 2007 to elect members of St Helens Metropolitan Borough Council in Merseyside, England. One third of the council was up for election and the council stayed under no overall control.
The 2007 Hull City Council election took place on 3 May 2007 to elect members of Hull City Council in England. One third of the council was up for election and the Liberal Democrats gained overall control of the council from no overall control. Overall turnout was 27%.
The Leeds City Council election took place on 2 May 2002 to elect members of City of Leeds Metropolitan Borough Council in West Yorkshire, England. Prior to the election, there had been several by-elections held with no change to the council composition. One third of the council was up for election and the Labour party stayed in overall control of the council.
The 2008 Sunderland Council election took place on 1 May 2008 to elect members of Sunderland Metropolitan Borough Council in Tyne and Wear, England. One third of the council was up for election and the Labour party stayed in overall control of the council.
The 2007 Pendle Borough Council election took place on 3 May 2007 to elect members of Pendle Borough Council in Lancashire, England. One third of the council was up for election and the Liberal Democrats stayed in overall control of the council.
The 2010 Pendle Borough Council election took place on 6 May 2010 to elect members of Pendle Borough Council in Lancashire, England. One third of the council was up for election and the council stayed under no overall control.
The 2003 Sandwell Metropolitan Borough Council election took place on 1 May 2003 to elect members of Sandwell Metropolitan Borough Council in the West Midlands, England. One third of the council was up for election and the Labour party stayed in overall control of the council.
The 2007 Sandwell Metropolitan Borough Council election took place on 3 May 2007 to elect members of Sandwell Metropolitan Borough Council in the West Midlands, England. One third of the council was up for election and the Labour party stayed in overall control of the council.
The 2008 Sandwell Metropolitan Borough Council election took place on 1 May 2008 to elect members of Sandwell Metropolitan Borough Council in the West Midlands, England. One third of the council was up for election and the Labour party stayed in overall control of the council.
The 2004 Maidstone Borough Council election took place on 10 June 2004 to elect members of Maidstone Borough Council in Kent, England. One third of the council was up for election and the council stayed under no overall control.
The 2007 Maidstone Borough Council election took place on 3 May 2007 to elect members of Maidstone Borough Council in Kent, England. One third of the council was up for election and the council stayed under no overall control.
The 2011 Amber Valley Borough Council election took place on 5 May 2011 to elect members of Amber Valley Borough Council in Derbyshire, England. One third of the council was up for election and the Conservative party stayed in overall control of the council.
The 2011 Sunderland Council election took place on 5 May 2011 to elect members of Sunderland Metropolitan Borough Council in Tyne and Wear, England. One third of the council was up for election and the Labour party stayed in overall control of the council.
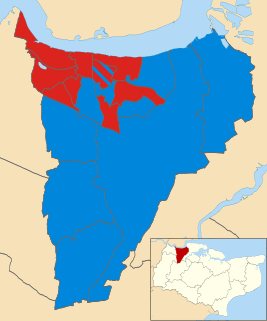
The 2011 Gravesham Borough Council election took place on 5 May 2011 to elect members of Gravesham Borough Council in Kent, England. The whole council was up for election and the Labour party gained overall control of the council from the Conservative party.
The 2011 Carlisle City Council election took place on 5 May 2011 to elect members of Carlisle District Council in Cumbria, England. One third of the council was up for election and the council stayed under no overall control.
The 2008 Colchester Borough Council election took place on 1 May 2008 to elect members of Colchester Borough Council in Essex, England. One third of the council was up for election and the Conservative party lost overall control of the council to no overall control.
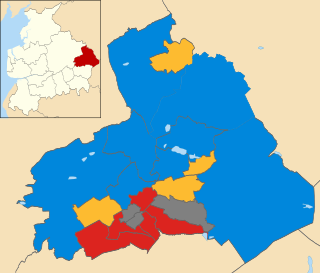
The 2011 Pendle Borough Council election took place on 5 May 2011 to elect members of Pendle Borough Council in Lancashire, England. One third of the council was up for election and the council stayed under no overall control.
The 2011 St Helens Metropolitan Borough Council election took place on 5 May 2011 to elect members of St Helens Metropolitan Borough Council in Merseyside, England. One third of the council was up for election and the Labour party stayed in overall control of the council.