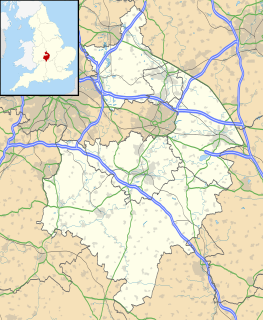
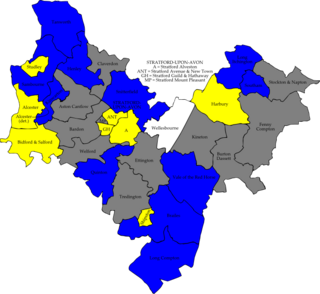
The 2000 Stratford-on-Avon District Council election took place on 4 May 2000 to elect members of Stratford-on-Avon District Council in Warwickshire, England. One third of the council was up for election and the Conservative party gained overall control of the council from no overall control. [1]
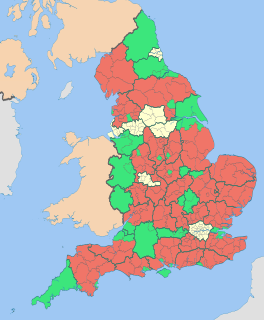
Non-metropolitan districts, or colloquially "shire districts", are a type of local government district in England. As created, they are sub-divisions of non-metropolitan counties in a two-tier arrangement.
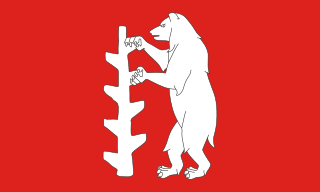
Warwickshire is a landlocked county in the West Midlands region of England. The county town is Warwick, although the largest town is Nuneaton. The county is famous for being the birthplace of William Shakespeare.
England is a country that is part of the United Kingdom. It shares land borders with Wales to the west and Scotland to the north-northwest. The Irish Sea lies west of England and the Celtic Sea lies to the southwest. England is separated from continental Europe by the North Sea to the east and the English Channel to the south. The country covers five-eighths of the island of Great Britain, which lies in the North Atlantic, and includes over 100 smaller islands, such as the Isles of Scilly and the Isle of Wight.
After the election, the composition of the council was
The Conservative Party, officially the Conservative and Unionist Party, is a centre-right political party in the United Kingdom. Presently led by Theresa May, it has been the governing party since 2010. It presently has 314 Members of Parliament in the House of Commons, 249 members of the House of Lords, and 18 members of the European Parliament. It also has 31 Members of the Scottish Parliament, 12 members of the Welsh Assembly, eight members of the London Assembly and 9,008 local councillors. One of the major parties of UK politics, it has formed the government on 45 occasions, more than any other party.
The Liberal Democrats are a liberal, centrist political party in the United Kingdom. They presently have 11 Members of Parliament in the House of Commons, 96 members of the House of Lords, and one member of the European Parliament. They also have five Members of the Scottish Parliament and a member each in the Welsh Assembly and London Assembly. The party reached the height of its influence in the early 2010s, forming a junior partner in a coalition government from 2010 to 2015. It is presently led by Vince Cable.
The Labour Party is a centre-left political party in the United Kingdom which has been described as an alliance of social democrats, democratic socialists and trade unionists. The party's platform emphasises greater state intervention, social justice and strengthening workers' rights. Labour is a full member of the Party of European Socialists and Progressive Alliance, and holds observer status in the Socialist International. As of 2017, the party was considered the "largest party in Western Europe" in terms of party membership, with more than half a million members.
18 of the 55 seats on the council were contested in the election with the Conservatives defending 9, Liberal Democrats 5, Labour 2 and independents 2. [3] The Conservatives contested all 18 seats and needed to make 4 gains to take overall control of the council. [4]
The election in Stratford-on-Avon saw a trial of electronic voting in an attempt to increase turnout. [5] However, there were some computer problems and delays in closing polling stations, which meant that results were delayed by an hour. [6]
Electronic voting is voting that uses electronic means to either aid or take care of casting and counting votes.
Voter turnout is the percentage of eligible voters who cast a ballot in an election. Eligibility varies by country, and the voting-eligible population should not be confused with the total adult population. Age and citizenship status are often among the criteria used to determine eligibility, but some countries further restrict eligibility based on sex, race, or religion.
The results saw the Conservative achieve a majority on the council, 5 years after they lost the majority. [6] They gained the 4 seats they had required, after winning 2 seats from the Liberal Democrats in Bidford and Stratford New Town wards, and 2 from Labour in Southam and Studley. [4] As a result, the Conservative leader on the council, Bob Stevens, took over the leadership of the council from Liberal Democrat, Susan Juned. [6]
Bidford-on-Avon is a large village and civil parish in the English county of Warwickshire, very close to the border with Worcestershire. In the 2001 census it had a population of 4,830, increasing to 5,350 at the Census 2011.
Southam is a small market town and civil parish in the Stratford-on-Avon district of Warwickshire, England. Southam is on the River Stowe, which flows from Napton-on-the-Hill and joins Warwickshire's River Itchen at Stoneythorpe, just outside the town. The town is about 7 1⁄2 miles (12 km) east of Leamington Spa, about 10 miles (16 km) from Rugby and Daventry, 13 miles (21 km) south of Coventry and 14 miles (23 km) north of Banbury.
Studley is a large village and civil parish in the Stratford-on-Avon district of Warwickshire, England. Situated on the western edge of Warwickshire near the border with Worcestershire it is 4 miles (6 km) southeast of Redditch and 13 miles (21 km) northwest of Stratford-upon-Avon. The Roman road of Ryknild Street, now the A435, passes through the village on its eastern edge, parallel to the River Arrow. The name derives from the Old English leah, being a meadow or pasture, where horses, stod, are kept.
Party | Seats | Gains | Losses | Net gain/loss | Seats % | Votes % | Votes | +/− | |
---|---|---|---|---|---|---|---|---|---|
Conservative | 13 | 4 | 0 | +4 | 72.2 | 54.5 | 12,379 | ||
Liberal Democrat | 3 | 0 | 2 | -2 | 16.7 | 28.5 | 6,469 | ||
Independent | 2 | 0 | 0 | 0 | 11.1 | 10.4 | 2,361 | ||
Labour | 0 | 0 | 2 | -2 | 0 | 6.0 | 1,362 | ||
Green | 0 | 0 | 0 | 0 | 0 | 0.6 | 126 |
Party | Candidate | Votes | % | ± | |
---|---|---|---|---|---|
Liberal Democrat | Clifford Meade | 1,001 | 53.5 | ||
Conservative | Susan Adams | 870 | 46.5 | ||
Majority | 131 | 7.0 | |||
Turnout | 1,871 | ||||
Liberal Democrat hold | Swing |
Party | Candidate | Votes | % | ± | |
---|---|---|---|---|---|
Conservative | David Saville | 560 | 51.1 | ||
Independent | Graham Getgood | 409 | 37.3 | ||
Labour | Michael Gerrard | 127 | 11.6 | ||
Majority | 151 | 13.8 | |||
Turnout | 1,096 | ||||
Conservative gain from Liberal Democrat | Swing | ||||
Party | Candidate | Votes | % | ± | |
---|---|---|---|---|---|
Conservative | Nigel Foster | 446 | 66.3 | ||
Liberal Democrat | Virginia Mason | 227 | 33.7 | ||
Majority | 219 | 32.6 | |||
Turnout | 673 | ||||
Conservative hold | Swing |
Party | Candidate | Votes | % | ± | |
---|---|---|---|---|---|
Conservative | James Turner | 882 | 56.1 | ||
Liberal Democrat | David Booth | 691 | 43.9 | ||
Majority | 191 | 12.2 | |||
Turnout | 1,573 | ||||
Conservative hold | Swing |
Party | Candidate | Votes | % | ± | |
---|---|---|---|---|---|
Conservative | George Atkinson | 822 | 64.6 | ||
Liberal Democrat | Anthony Wright | 450 | 35.4 | ||
Majority | 372 | 29.2 | |||
Turnout | 1,272 | ||||
Conservative hold | Swing |
Party | Candidate | Votes | % | ± | |
---|---|---|---|---|---|
Liberal Democrat | John Davis | 342 | 62.1 | ||
Conservative | Edward Duckworth | 209 | 37.9 | ||
Majority | 133 | 24.2 | |||
Turnout | 551 | ||||
Liberal Democrat hold | Swing |
Party | Candidate | Votes | % | ± | |
---|---|---|---|---|---|
Conservative | Malcolm Thomas | 510 | 82.9 | ||
Labour | Peter Hartland | 105 | 17.1 | ||
Majority | 405 | 65.8 | |||
Turnout | 615 | ||||
Conservative hold | Swing |
Party | Candidate | Votes | % | ± | |
---|---|---|---|---|---|
Independent | Kim James | 336 | 69.7 | ||
Conservative | David Harrison | 146 | 30.3 | ||
Majority | 190 | 39.4 | |||
Turnout | 482 | ||||
Independent hold | Swing |
Party | Candidate | Votes | % | ± | |
---|---|---|---|---|---|
Conservative | Trevor Russel | 702 | 47.1 | ||
Liberal Democrat | Robert White | 686 | 46.0 | ||
Labour | Ann Grosvenor | 102 | 6.8 | ||
Majority | 16 | 1.1 | |||
Turnout | 1,490 | ||||
Conservative hold | Swing |
Party | Candidate | Votes | % | ± | |
---|---|---|---|---|---|
Conservative | Alan Akeister | 1,131 | 59.8 | ||
Labour | Martyn Ashford | 760 | 40.2 | ||
Majority | 371 | 19.6 | |||
Turnout | 1,891 | ||||
Conservative gain from Labour | Swing | ||||
Party | Candidate | Votes | % | ± | |
---|---|---|---|---|---|
Conservative | Richard Hyde | 1,280 | 69.2 | ||
Independent | Vincent Seaman | 570 | 30.8 | ||
Majority | 710 | 38.4 | |||
Turnout | 1,850 | ||||
Conservative hold | Swing |
Party | Candidate | Votes | % | ± | |
---|---|---|---|---|---|
Conservative | Giovanni Renna | 858 | 57.7 | ||
Liberal Democrat | David Roberts | 629 | 42.3 | ||
Majority | 229 | 15.4 | |||
Turnout | 1,487 | ||||
Conservative hold | Swing |
Party | Candidate | Votes | % | ± | |
---|---|---|---|---|---|
Liberal Democrat | Peter Moorse | 928 | 52.5 | ||
Conservative | Richard Kingston | 668 | 37.8 | ||
Labour | Matthew Stephens | 173 | 9.8 | ||
Majority | 260 | 14.7 | |||
Turnout | 1,769 | ||||
Liberal Democrat hold | Swing |
Party | Candidate | Votes | % | ± | |
---|---|---|---|---|---|
Conservative | Juliet Short | 659 | 50.1 | ||
Liberal Democrat | Dinah Hanlon | 562 | 42.7 | ||
Labour | Karen Parnell | 95 | 7.2 | ||
Majority | 97 | 7.4 | |||
Turnout | 1,316 | ||||
Conservative gain from Liberal Democrat | Swing | ||||
Party | Candidate | Votes | % | ± | |
---|---|---|---|---|---|
Conservative | Desmond Maries | 968 | 71.5 | ||
Liberal Democrat | Mary Smith | 385 | 28.5 | ||
Majority | 583 | 43.0 | |||
Turnout | 1,353 | ||||
Conservative gain from Labour | Swing | ||||
Party | Candidate | Votes | % | ± | |
---|---|---|---|---|---|
Conservative | Christopher Saint | 642 | 62.3 | ||
Liberal Democrat | Stephen Wright | 388 | 37.7 | ||
Majority | 254 | 24.6 | |||
Turnout | 1,030 | ||||
Conservative hold | Swing |
Party | Candidate | Votes | % | ± | |
---|---|---|---|---|---|
Independent | Roger Wright | 1,046 | 60.2 | ||
Conservative | Malcolm Littlewood | 565 | 32.5 | ||
Green | Michael Davies | 126 | 7.3 | ||
Majority | 491 | 27.7 | |||
Turnout | 1,737 | ||||
Independent hold | Swing |
Party | Candidate | Votes | % | ± | |
---|---|---|---|---|---|
Conservative | Ann Haddon | 461 | 71.9 | ||
Liberal Democrat | Lynn Bowring | 180 | 28.1 | ||
Majority | 281 | 43.8 | |||
Turnout | 641 | ||||
Conservative hold | Swing |
The 1998 Solihull Metropolitan Borough Council election took place on 7 May 1998 to elect members of Solihull Metropolitan Borough Council in the West Midlands, England. One third of the council was up for election and the council stayed under no overall control.
The 2006 Derby City Council election took place on 4 May 2006 to elect members of Derby City Council in England. One third of the council was up for election and the Labour party lost their majority on the council to no overall control.
The 2008 Derby City Council election took place on 1 May 2008 to elect members of Derby City Council in England. One third of the council was up for election and the council stayed under no overall control. Overall turnout was 34.6%.
The 2006 St Albans City and District Council election took place on 4 May 2006 to elect members of St Albans District Council in Hertfordshire, England. One third of the council was up for election and the Liberal Democrats gained overall control of the council from no overall control.
The 1998 Stratford-on-Avon District Council election took place on 7 May 1998 to elect members of Stratford-on-Avon District Council in Warwickshire, England. One third of the council was up for election and the council stayed under no overall control.
The 1999 Stratford-on-Avon District Council election took place on 6 May 1999 to elect members of Stratford-on-Avon District Council in Warwickshire, England. One third of the council was up for election and the council stayed under no overall control.
The 2002 Stratford-on-Avon District Council election took place on 2 May 2002 to elect members of Stratford-on-Avon District Council in Warwickshire, England. The whole council was up for election with boundary changes since the last election in 2000 reducing the number of seats by 2. The Conservative party stayed in overall control of the council.
The 2003 Stratford-on-Avon District Council election took place on 1 May 2003 to elect members of Stratford-on-Avon District Council in Warwickshire, England. One third of the council was up for election and the Conservative party gained overall control of the council from no overall control.
The 2004 Stratford-on-Avon District Council election took place on 10 June 2004 to elect members of Stratford-on-Avon District Council in Warwickshire, England. One third of the council was up for election and the Conservative party stayed in overall control of the council.
The 2006 Stratford-on-Avon District Council election took place on 4 May 2006 to elect members of Stratford-on-Avon District Council in Warwickshire, England. One third of the council was up for election and the Conservative party stayed in overall control of the council.
The 2007 Stratford-on-Avon District Council election took place on 3 May 2007 to elect members of Stratford-on-Avon District Council in Warwickshire, England. One third of the council was up for election and the Conservative party stayed in overall control of the council.
The 2008 Stratford-on-Avon District Council election took place on 1 May 2008 to elect members of Stratford-on-Avon District Council in Warwickshire, England. One third of the council was up for election and the Conservative party stayed in overall control of the council.
The 2000 Southend-on-Sea Council election took place on 4 May 2000 to elect members of Southend-on-Sea Unitary Council in Essex, England. One third of the council was up for election and the Conservative party gained overall control of the council from no overall control.
The 1999 Solihull Metropolitan Borough Council election took place on 6 May 1999 to elect members of Solihull Metropolitan Borough Council in the West Midlands, England. One third of the council was up for election and the council stayed under no overall control.
The 2003 Solihull Metropolitan Borough Council election took place on 1 May 2003 to elect members of Solihull Metropolitan Borough Council in the West Midlands, England. One third of the council was up for election and the Conservative party stayed in overall control of the council.
The 2006 Solihull Metropolitan Borough Council election took place on 4 May 2006 to elect members of Solihull Metropolitan Borough Council in the West Midlands, England. One third of the council was up for election and the Conservative party stayed in overall control of the council.
The 2006 Sunderland Council election took place on 4 May 2006 to elect members of Sunderland City Council in Tyne and Wear, England. One third of the Council was up for election and the Labour party stayed in overall control.
The 2008 Sunderland Council election took place on 1 May 2008 to elect members of Sunderland Metropolitan Borough Council in Tyne and Wear, England. One third of the council was up for election and the Labour party stayed in overall control of the council.
The 1998 Pendle Borough Council election took place on 7 May 1998 to elect members of Pendle Borough Council in Lancashire, England. One third of the council was up for election and the Liberal Democrats stayed in overall control of the council.
The 2010 Stratford-on-Avon District Council election took place on 6 May 2010 to elect members of Stratford-on-Avon District Council in Warwickshire, England. One third of the council was up for election and the Conservative party stayed in overall control of the council.