Svendborg | |
---|---|
Svendborg | |
Nomination district constituency for the Folketing | |
Municipalities | Langeland Svendborg |
Constituency | Funen |
Electorate | 55,447 (2022) [1] |
Current constituency | |
Created | 1849 (as constituency) [2] 1920 (as nomination district) |
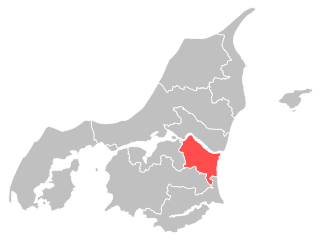
Svendborg nominating district is one of the 92 nominating districts that exists for Danish elections following the 2007 municipal reform. [3] [4] [5] It consists of Langeland and Svendborg municipality. [6] It was created in 1849 [7] as a constituency, and has been a nomination district since 1920, though its boundaries have been changed since then.
In general elections, the district is a strong area for parties commonly associated with the red bloc. [8]
Parties | Vote | |||||
---|---|---|---|---|---|---|
Votes | % | + / - | ||||
Social Democrats | 15,949 | 34.71 | +3.76 | |||
Venstre | 4,780 | 10.40 | -11.43 | |||
Moderates | 4,257 | 9.26 | New | |||
Denmark Democrats | 3,810 | 8.29 | New | |||
Green Left | 3,799 | 8.27 | +1.74 | |||
Red–Green Alliance | 2,948 | 6.42 | -2.62 | |||
Liberal Alliance | 2,555 | 5.56 | +4.16 | |||
Conservatives | 1,814 | 3.95 | -1.95 | |||
The Alternative | 1,724 | 3.75 | -0.12 | |||
New Right | 1,519 | 3.31 | +1.42 | |||
Danish People's Party | 1,221 | 2.66 | -6.28 | |||
Social Liberals | 1,167 | 2.54 | -3.49 | |||
Independent Greens | 170 | 0.37 | New | |||
Christian Democrats | 154 | 0.34 | -0.66 | |||
Millah Kongsbach | 82 | 0.18 | New | |||
Total | 45,949 | |||||
Source [9] |
Parties | Vote | |||||
---|---|---|---|---|---|---|
Votes | % | + / - | ||||
Social Democrats | 14,147 | 30.95 | +4.58 | |||
Venstre | 9,979 | 21.83 | +4.19 | |||
Red–Green Alliance | 4,134 | 9.04 | -1.66 | |||
Danish People's Party | 4,087 | 8.94 | -14.22 | |||
Green Left | 2,987 | 6.53 | +2.29 | |||
Social Liberals | 2,756 | 6.03 | +3.09 | |||
Conservatives | 2,698 | 5.90 | +2.79 | |||
The Alternative | 1,769 | 3.87 | -2.42 | |||
New Right | 862 | 1.89 | New | |||
Stram Kurs | 810 | 1.77 | New | |||
Liberal Alliance | 638 | 1.40 | -3.82 | |||
Christian Democrats | 459 | 1.00 | +0.66 | |||
Klaus Riskær Pedersen Party | 387 | 0.85 | New | |||
Total | 45,713 | |||||
Source [10] |
Parties | Vote | |||||
---|---|---|---|---|---|---|
Votes | % | + / - | ||||
Social Democrats | 12,210 | 26.37 | -0.78 | |||
Danish People's Party | 10,721 | 23.16 | +10.71 | |||
Venstre | 8,166 | 17.64 | -5.79 | |||
Red–Green Alliance | 4,953 | 10.70 | +2.29 | |||
The Alternative | 2,911 | 6.29 | New | |||
Liberal Alliance | 2,416 | 5.22 | +1.54 | |||
Green Left | 1,964 | 4.24 | -7.06 | |||
Conservatives | 1,438 | 3.11 | -1.49 | |||
Social Liberals | 1,359 | 2.94 | -5.52 | |||
Christian Democrats | 159 | 0.34 | -0.13 | |||
Total | 46,297 | |||||
Source [11] |
Parties | Vote | |||||
---|---|---|---|---|---|---|
Votes | % | + / - | ||||
Social Democrats | 13,049 | 27.15 | +1.72 | |||
Venstre | 11,263 | 23.43 | +0.22 | |||
Danish People's Party | 5,982 | 12.45 | -3.04 | |||
Green Left | 5,429 | 11.30 | -3.35 | |||
Social Liberals | 4,064 | 8.46 | +3.22 | |||
Red–Green Alliance | 4,043 | 8.41 | +5.83 | |||
Conservatives | 2,209 | 4.60 | -6.08 | |||
Liberal Alliance | 1,767 | 3.68 | +1.36 | |||
Christian Democrats | 228 | 0.47 | +0.10 | |||
Lars Grønbæk Larsen | 16 | 0.03 | New | |||
Michael Ellegård | 13 | 0.03 | 0.00 | |||
Total | 48,063 | |||||
Source [12] |
Parties | Vote | |||||
---|---|---|---|---|---|---|
Votes | % | + / - | ||||
Social Democrats | 12,107 | 25.43 | -1.26 | |||
Venstre | 11,047 | 23.21 | -1.06 | |||
Danish People's Party | 7,372 | 15.49 | +1.06 | |||
Green Left | 6,973 | 14.65 | +8.00 | |||
Conservatives | 5,086 | 10.68 | -2.50 | |||
Social Liberals | 2,492 | 5.24 | -3.53 | |||
Red–Green Alliance | 1,229 | 2.58 | -1.40 | |||
New Alliance | 1,105 | 2.32 | New | |||
Christian Democrats | 177 | 0.37 | -0.45 | |||
Michael Ellegård | 14 | 0.03 | New | |||
Total | 47,602 | |||||
Source [13] |
Parties | Vote | |||||
---|---|---|---|---|---|---|
Votes | % | + / - | ||||
Social Democrats | 9,769 | 26.69 | -3.15 | |||
Venstre | 8,884 | 24.27 | -3.66 | |||
Danish People's Party | 5,282 | 14.43 | +1.89 | |||
Conservatives | 4,826 | 13.18 | +2.53 | |||
Social Liberals | 3,212 | 8.77 | +3.53 | |||
Green Left | 2,433 | 6.65 | -1.36 | |||
Red–Green Alliance | 1,457 | 3.98 | +1.41 | |||
Centre Democrats | 324 | 0.89 | -0.51 | |||
Christian Democrats | 300 | 0.82 | -0.47 | |||
Minority Party | 117 | 0.32 | New | |||
Total | 36,604 | |||||
Source [14] |
Parties | Vote | |||||
---|---|---|---|---|---|---|
Votes | % | + / - | ||||
Social Democrats | 11,225 | 29.84 | -7.33 | |||
Venstre | 10,506 | 27.93 | +3.80 | |||
Danish People's Party | 4,716 | 12.54 | +5.15 | |||
Conservatives | 4,005 | 10.65 | +3.33 | |||
Green Left | 3,015 | 8.01 | -1.09 | |||
Social Liberals | 1,972 | 5.24 | +0.52 | |||
Red–Green Alliance | 967 | 2.57 | -0.45 | |||
Centre Democrats | 526 | 1.40 | -2.63 | |||
Christian People's Party | 487 | 1.29 | -0.17 | |||
Progress Party | 203 | 0.54 | -0.81 | |||
Total | 37,622 | |||||
Source [15] |
Parties | Vote | |||||
---|---|---|---|---|---|---|
Votes | % | + / - | ||||
Social Democrats | 14,006 | 37.17 | -0.55 | |||
Venstre | 9,091 | 24.13 | +0.51 | |||
Green Left | 3,428 | 9.10 | +1.12 | |||
Danish People's Party | 2,783 | 7.39 | New | |||
Conservatives | 2,760 | 7.32 | -4.36 | |||
Social Liberals | 1,779 | 4.72 | -0.64 | |||
Centre Democrats | 1,518 | 4.03 | +1.90 | |||
Red–Green Alliance | 1,138 | 3.02 | -0.27 | |||
Christian People's Party | 552 | 1.46 | +0.42 | |||
Progress Party | 508 | 1.35 | -5.72 | |||
Democratic Renewal | 112 | 0.30 | New | |||
Svend Jensen | 7 | 0.02 | New | |||
Total | 37,682 | |||||
Source [16] |
Parties | Vote | |||||
---|---|---|---|---|---|---|
Votes | % | + / - | ||||
Social Democrats | 13,853 | 37.72 | -0.96 | |||
Venstre | 8,673 | 23.62 | +5.58 | |||
Conservatives | 4,289 | 11.68 | -1.08 | |||
Green Left | 2,930 | 7.98 | -1.10 | |||
Progress Party | 2,597 | 7.07 | -0.49 | |||
Social Liberals | 1,968 | 5.36 | +1.21 | |||
Red–Green Alliance | 1,210 | 3.29 | +1.71 | |||
Centre Democrats | 783 | 2.13 | -1.54 | |||
Christian People's Party | 381 | 1.04 | -0.26 | |||
Leif Nybo | 19 | 0.05 | New | |||
Michael Ellegård | 13 | 0.04 | New | |||
Else Lundgaard | 9 | 0.02 | New | |||
Bjørn Henriksen | 1 | 0.00 | New | |||
Total | 36,726 | |||||
Source [17] |
Parties | Vote | |||||
---|---|---|---|---|---|---|
Votes | % | + / - | ||||
Social Democrats | 13,967 | 38.68 | +8.29 | |||
Venstre | 6,515 | 18.04 | +4.67 | |||
Conservatives | 4,609 | 12.76 | -5.00 | |||
Green Left | 3,278 | 9.08 | -4.10 | |||
Progress Party | 2,729 | 7.56 | -1.89 | |||
Social Liberals | 1,497 | 4.15 | -1.87 | |||
Centre Democrats | 1,326 | 3.67 | +0.31 | |||
Red–Green Alliance | 571 | 1.58 | New | |||
Common Course | 515 | 1.43 | -0.96 | |||
Christian People's Party | 470 | 1.30 | +0.07 | |||
The Greens | 414 | 1.15 | -0.56 | |||
Justice Party of Denmark | 196 | 0.54 | New | |||
Humanist Party | 15 | 0.04 | New | |||
Tage Abildgart | 3 | 0.01 | New | |||
Mogens Trondhjem | 3 | 0.01 | New | |||
Total | 36,108 | |||||
Source [18] |
Parties | Vote | |||||
---|---|---|---|---|---|---|
Votes | % | + / - | ||||
Social Democrats | 11,246 | 30.39 | +1.23 | |||
Conservatives | 6,570 | 17.76 | -2.57 | |||
Venstre | 4,947 | 13.37 | +1.86 | |||
Green Left | 4,878 | 13.18 | -1.36 | |||
Progress Party | 3,498 | 9.45 | +4.69 | |||
Social Liberals | 2,228 | 6.02 | -1.46 | |||
Centre Democrats | 1,244 | 3.36 | -0.09 | |||
Common Course | 884 | 2.39 | -0.59 | |||
The Greens | 632 | 1.71 | +0.02 | |||
Christian People's Party | 456 | 1.23 | -0.39 | |||
Communist Party of Denmark | 221 | 0.60 | +0.01 | |||
Left Socialists | 193 | 0.52 | -0.79 | |||
Carl Erik Jørgensen | 6 | 0.02 | New | |||
Total | 37,003 | |||||
Source [19] |
Parties | Vote | |||||
---|---|---|---|---|---|---|
Votes | % | + / - | ||||
Social Democrats | 10,920 | 29.16 | -2.06 | |||
Conservatives | 7,612 | 20.33 | -2.39 | |||
Green Left | 5,446 | 14.54 | +3.16 | |||
Venstre | 4,312 | 11.51 | -2.48 | |||
Social Liberals | 2,800 | 7.48 | +1.05 | |||
Progress Party | 1,782 | 4.76 | +1.32 | |||
Centre Democrats | 1,293 | 3.45 | -0.91 | |||
Common Course | 1,117 | 2.98 | New | |||
The Greens | 632 | 1.69 | New | |||
Christian People's Party | 605 | 1.62 | -0.21 | |||
Left Socialists | 491 | 1.31 | -1.21 | |||
Communist Party of Denmark | 221 | 0.59 | +0.09 | |||
Justice Party of Denmark | 132 | 0.35 | -1.15 | |||
Humanist Party | 52 | 0.14 | New | |||
Socialist Workers Party | 20 | 0.05 | 0.00 | |||
Henrik Nørregård Nielsen | 10 | 0.03 | New | |||
Marxist–Leninists Party | 4 | 0.01 | -0.03 | |||
Total | 37,449 | |||||
Source [20] |
Parties | Vote | |||||
---|---|---|---|---|---|---|
Votes | % | + / - | ||||
Social Democrats | 11,561 | 31.22 | -1.99 | |||
Conservatives | 8,415 | 22.72 | +9.34 | |||
Venstre | 5,180 | 13.99 | +0.67 | |||
Green Left | 4,216 | 11.38 | +0.84 | |||
Social Liberals | 2,380 | 6.43 | +0.77 | |||
Centre Democrats | 1,613 | 4.36 | -4.61 | |||
Progress Party | 1,274 | 3.44 | -5.76 | |||
Left Socialists | 935 | 2.52 | +0.25 | |||
Christian People's Party | 679 | 1.83 | +0.66 | |||
Justice Party of Denmark | 557 | 1.50 | +0.05 | |||
Communist Party of Denmark | 185 | 0.50 | -0.17 | |||
Socialist Workers Party | 20 | 0.05 | +0.01 | |||
Marxist–Leninists Party | 13 | 0.04 | New | |||
Carl Erik Jørgensen | 5 | 0.01 | New | |||
Total | 37,033 | |||||
Source [21] |
Parties | Vote | |||||
---|---|---|---|---|---|---|
Votes | % | + / - | ||||
Social Democrats | 11,407 | 33.21 | -5.60 | |||
Conservatives | 4,596 | 13.38 | +1.92 | |||
Venstre | 4,574 | 13.32 | -0.99 | |||
Green Left | 3,620 | 10.54 | +4.98 | |||
Progress Party | 3,162 | 9.20 | -3.39 | |||
Centre Democrats | 3,080 | 8.97 | +5.76 | |||
Social Liberals | 1,944 | 5.66 | -0.03 | |||
Left Socialists | 779 | 2.27 | -0.48 | |||
Justice Party of Denmark | 499 | 1.45 | -1.17 | |||
Christian People's Party | 401 | 1.17 | -0.29 | |||
Communist Party of Denmark | 231 | 0.67 | -0.61 | |||
Communist Workers Party | 29 | 0.08 | -0.17 | |||
Socialist Workers Party | 15 | 0.04 | New | |||
Anders Bondo Christensen | 15 | 0.04 | New | |||
Total | 34,352 | |||||
Source [22] |
Parties | Vote | |||||
---|---|---|---|---|---|---|
Votes | % | + / - | ||||
Social Democrats | 13,351 | 38.81 | +1.65 | |||
Venstre | 4,923 | 14.31 | 0.00 | |||
Progress Party | 4,331 | 12.59 | -2.78 | |||
Conservatives | 3,942 | 11.46 | +2.82 | |||
Social Liberals | 1,957 | 5.69 | +0.86 | |||
Green Left | 1,912 | 5.56 | +2.09 | |||
Centre Democrats | 1,105 | 3.21 | -1.98 | |||
Left Socialists | 946 | 2.75 | +1.07 | |||
Justice Party of Denmark | 902 | 2.62 | -0.89 | |||
Christian People's Party | 502 | 1.46 | -1.05 | |||
Communist Party of Denmark | 442 | 1.28 | -1.12 | |||
Communist Workers Party | 85 | 0.25 | New | |||
Total | 34,398 | |||||
Source [23] |
Parties | Vote | |||||
---|---|---|---|---|---|---|
Votes | % | + / - | ||||
Social Democrats | 12,510 | 37.16 | +5.40 | |||
Progress Party | 5,174 | 15.37 | +2.91 | |||
Venstre | 4,817 | 14.31 | -13.25 | |||
Conservatives | 2,908 | 8.64 | +3.21 | |||
Centre Democrats | 1,748 | 5.19 | +3.73 | |||
Social Liberals | 1,626 | 4.83 | -3.70 | |||
Justice Party of Denmark | 1,181 | 3.51 | +1.83 | |||
Green Left | 1,169 | 3.47 | -0.06 | |||
Christian People's Party | 845 | 2.51 | -0.93 | |||
Communist Party of Denmark | 808 | 2.40 | -0.40 | |||
Left Socialists | 565 | 1.68 | +0.33 | |||
Pensioners' Party | 311 | 0.92 | New | |||
Total | 33,662 | |||||
Source [24] |
Parties | Vote | |||||
---|---|---|---|---|---|---|
Votes | % | + / - | ||||
Social Democrats | 10,540 | 31.76 | +3.73 | |||
Venstre | 9,147 | 27.56 | +14.61 | |||
Progress Party | 4,135 | 12.46 | -4.31 | |||
Social Liberals | 2,831 | 8.53 | -5.91 | |||
Conservatives | 1,801 | 5.43 | -4.07 | |||
Green Left | 1,170 | 3.53 | -0.41 | |||
Christian People's Party | 1,140 | 3.44 | +0.81 | |||
Communist Party of Denmark | 930 | 2.80 | +0.52 | |||
Justice Party of Denmark | 557 | 1.68 | -1.01 | |||
Centre Democrats | 483 | 1.46 | -4.27 | |||
Left Socialists | 449 | 1.35 | +0.31 | |||
Hans Clausen Pilegaard | 2 | 0.01 | New | |||
Gunner Pedersen | 1 | 0.00 | New | |||
Oscar Andersen | 0 | 0.00 | New | |||
Ivan Folmer-Larsen | 0 | 0.00 | New | |||
E. Just Jensen | 0 | 0.00 | New | |||
Total | 33,186 | |||||
Source [25] |
Parties | Vote | |||||
---|---|---|---|---|---|---|
Votes | % | + / - | ||||
Social Democrats | 9,292 | 28.03 | -11.28 | |||
Progress Party | 5,560 | 16.77 | New | |||
Social Liberals | 4,786 | 14.44 | -4.51 | |||
Venstre | 4,292 | 12.95 | -3.04 | |||
Conservatives | 3,150 | 9.50 | -5.64 | |||
Centre Democrats | 1,901 | 5.73 | New | |||
Green Left | 1,305 | 3.94 | -2.07 | |||
Justice Party of Denmark | 892 | 2.69 | +1.12 | |||
Christian People's Party | 873 | 2.63 | +1.65 | |||
Communist Party of Denmark | 756 | 2.28 | +1.38 | |||
Left Socialists | 344 | 1.04 | -0.10 | |||
Total | 33,151 | |||||
Source [26] |
Parties | Vote | |||||
---|---|---|---|---|---|---|
Votes | % | + / - | ||||
Social Democrats | 12,373 | 39.31 | +1.04 | |||
Social Liberals | 5,964 | 18.95 | +6.91 | |||
Venstre | 5,031 | 15.99 | -1.99 | |||
Conservatives | 4,765 | 15.14 | -7.77 | |||
Green Left | 1,893 | 6.01 | +0.96 | |||
Justice Party of Denmark | 494 | 1.57 | +0.92 | |||
Left Socialists | 359 | 1.14 | -0.12 | |||
Christian People's Party | 309 | 0.98 | New | |||
Communist Party of Denmark | 284 | 0.90 | +0.27 | |||
Total | 31,472 | |||||
Source [27] |
Parties | Vote | |||||
---|---|---|---|---|---|---|
Votes | % | + / - | ||||
Social Democrats | 7,531 | 38.27 | -5.07 | |||
Conservatives | 4,509 | 22.91 | +2.57 | |||
Venstre | 3,539 | 17.98 | -0.25 | |||
Social Liberals | 2,369 | 12.04 | +6.06 | |||
Green Left | 994 | 5.05 | -3.15 | |||
Left Socialists | 247 | 1.26 | New | |||
Liberal Centre | 170 | 0.86 | -0.95 | |||
Justice Party of Denmark | 127 | 0.65 | +0.20 | |||
Communist Party of Denmark | 124 | 0.63 | +0.25 | |||
Independent Party | 70 | 0.36 | -0.91 | |||
Total | 19,680 | |||||
Source [28] |
Parties | Vote | |||||
---|---|---|---|---|---|---|
Votes | % | + / - | ||||
Social Democrats | 8,347 | 43.34 | -3.48 | |||
Conservatives | 3,917 | 20.34 | -0.66 | |||
Venstre | 3,511 | 18.23 | -1.78 | |||
Green Left | 1,579 | 8.20 | +4.26 | |||
Social Liberals | 1,151 | 5.98 | +2.19 | |||
Liberal Centre | 349 | 1.81 | New | |||
Independent Party | 245 | 1.27 | -0.90 | |||
Justice Party of Denmark | 87 | 0.45 | -0.31 | |||
Communist Party of Denmark | 74 | 0.38 | -0.37 | |||
Total | 19,260 | |||||
Source [29] |
Parties | Vote | |||||
---|---|---|---|---|---|---|
Votes | % | + / - | ||||
Social Democrats | 8,667 | 46.82 | -0.28 | |||
Conservatives | 3,887 | 21.00 | +2.21 | |||
Venstre | 3,704 | 20.01 | -2.70 | |||
Green Left | 729 | 3.94 | -0.17 | |||
Social Liberals | 702 | 3.79 | +0.23 | |||
Independent Party | 402 | 2.17 | +0.15 | |||
Justice Party of Denmark | 141 | 0.76 | -0.38 | |||
Communist Party of Denmark | 138 | 0.75 | +0.19 | |||
Peace Politics People's Party | 87 | 0.47 | New | |||
Danish Unity | 55 | 0.30 | New | |||
Total | 18,512 | |||||
Source [30] |
Parties | Vote | |||||
---|---|---|---|---|---|---|
Votes | % | + / - | ||||
Social Democrats | 8,264 | 47.10 | +1.67 | |||
Venstre | 3,985 | 22.71 | -3.54 | |||
Conservatives | 3,297 | 18.79 | +1.20 | |||
Green Left | 721 | 4.11 | New | |||
Social Liberals | 625 | 3.56 | -1.20 | |||
Independent Party | 355 | 2.02 | +1.02 | |||
Justice Party of Denmark | 200 | 1.14 | -2.22 | |||
Communist Party of Denmark | 98 | 0.56 | -1.05 | |||
Total | 17,545 | |||||
Source [31] |
Parties | Vote | |||||
---|---|---|---|---|---|---|
Votes | % | + / - | ||||
Social Democrats | 7,864 | 45.43 | -3.76 | |||
Venstre | 4,544 | 26.25 | +4.06 | |||
Conservatives | 3,044 | 17.59 | -0.90 | |||
Social Liberals | 824 | 4.76 | +0.38 | |||
Justice Party of Denmark | 582 | 3.36 | +1.47 | |||
Communist Party of Denmark | 278 | 1.61 | -0.83 | |||
Independent Party | 173 | 1.00 | -0.41 | |||
Total | 17,309 | |||||
Source [32] |
September 1953 Danish Folketing election
Parties | Vote | |||||
---|---|---|---|---|---|---|
Votes | % | + / - | ||||
Social Democrats | 8,088 | 49.19 | +1.13 | |||
Venstre | 3,649 | 22.19 | +0.96 | |||
Conservatives | 3,040 | 18.49 | -0.55 | |||
Social Liberals | 721 | 4.38 | -0.74 | |||
Communist Party of Denmark | 402 | 2.44 | -0.35 | |||
Justice Party of Denmark | 311 | 1.89 | -1.30 | |||
Independent Party | 232 | 1.41 | New | |||
Total | 16,443 | |||||
Source [33] |
April 1953 Danish Folketing election
Parties | Vote | |||||
---|---|---|---|---|---|---|
Votes | % | + / - | ||||
Social Democrats | 7,513 | 48.06 | +2.28 | |||
Venstre | 3,319 | 21.23 | +3.16 | |||
Conservatives | 2,976 | 19.04 | -4.17 | |||
Social Liberals | 800 | 5.12 | +0.31 | |||
Justice Party of Denmark | 498 | 3.19 | -2.00 | |||
Communist Party of Denmark | 436 | 2.79 | -0.13 | |||
Danish Unity | 90 | 0.58 | New | |||
Total | 15,632 | |||||
Source [34] |
1950 Danish Folketing election
Parties | Vote | |||||
---|---|---|---|---|---|---|
Votes | % | + / - | ||||
Social Democrats | 7,029 | 45.78 | -1.53 | |||
Conservatives | 3,564 | 23.21 | +7.26 | |||
Venstre | 2,775 | 18.07 | -5.83 | |||
Justice Party of Denmark | 797 | 5.19 | +2.12 | |||
Social Liberals | 739 | 4.81 | +0.43 | |||
Communist Party of Denmark | 449 | 2.92 | -1.46 | |||
Total | 15,353 | |||||
Source [35] |
1947 Danish Folketing election
Parties | Vote | |||||
---|---|---|---|---|---|---|
Votes | % | + / - | ||||
Social Democrats | 7,372 | 47.31 | +9.21 | |||
Venstre | 3,724 | 23.90 | +3.97 | |||
Conservatives | 2,486 | 15.95 | -7.30 | |||
Social Liberals | 683 | 4.38 | -0.36 | |||
Communist Party of Denmark | 682 | 4.38 | -5.93 | |||
Justice Party of Denmark | 478 | 3.07 | +2.03 | |||
Danish Unity | 157 | 1.01 | -1.61 | |||
Total | 15,582 | |||||
Source [36] |
1945 Danish Folketing election
Parties | Vote | |||||
---|---|---|---|---|---|---|
Votes | % | + / - | ||||
Social Democrats | 5,903 | 38.10 | -10.23 | |||
Conservatives | 3,602 | 23.25 | -2.64 | |||
Venstre | 3,088 | 19.93 | +4.38 | |||
Communist Party of Denmark | 1,598 | 10.31 | New | |||
Social Liberals | 735 | 4.74 | -1.39 | |||
Danish Unity | 406 | 2.62 | +1.48 | |||
Justice Party of Denmark | 161 | 1.04 | +0.15 | |||
Total | 15,493 | |||||
Source [37] |
1943 Danish Folketing election
Parties | Vote | |||||
---|---|---|---|---|---|---|
Votes | % | + / - | ||||
Social Democrats | 7,409 | 48.33 | +4.14 | |||
Conservatives | 3,968 | 25.89 | +4.08 | |||
Venstre | 2,383 | 15.55 | -2.52 | |||
Social Liberals | 939 | 6.13 | -1.22 | |||
National Socialist Workers' Party of Denmark | 298 | 1.94 | +0.15 | |||
Danish Unity | 175 | 1.14 | +0.44 | |||
Justice Party of Denmark | 136 | 0.89 | -0.44 | |||
Farmers' Party | 21 | 0.14 | -0.43 | |||
Total | 15,329 | |||||
Source [38] |
1939 Danish Folketing election
Parties | Vote | |||||
---|---|---|---|---|---|---|
Votes | % | + / - | ||||
Social Democrats | 5,468 | 44.19 | -4.39 | |||
Conservatives | 2,698 | 21.81 | -1.79 | |||
Venstre | 2,236 | 18.07 | +2.52 | |||
Social Liberals | 909 | 7.35 | +0.11 | |||
National Cooperation | 287 | 2.32 | New | |||
Communist Party of Denmark | 232 | 1.88 | +0.68 | |||
National Socialist Workers' Party of Denmark | 221 | 1.79 | +0.75 | |||
Justice Party of Denmark | 165 | 1.33 | -0.71 | |||
Danish Unity | 86 | 0.70 | New | |||
Farmers' Party | 71 | 0.57 | -0.19 | |||
Total | 12,373 | |||||
Source [39] |
1935 Danish Folketing election
Parties | Vote | |||||
---|---|---|---|---|---|---|
Votes | % | + / - | ||||
Social Democrats | 6,005 | 48.58 | +5.14 | |||
Conservatives | 2,917 | 23.60 | -0.88 | |||
Venstre | 1,922 | 15.55 | -6.86 | |||
Social Liberals | 895 | 7.24 | +0.21 | |||
Justice Party of Denmark | 252 | 2.04 | -0.06 | |||
Communist Party of Denmark | 148 | 1.20 | +0.66 | |||
National Socialist Workers' Party of Denmark | 129 | 1.04 | New | |||
Independent People's Party | 94 | 0.76 | New | |||
Total | 12,362 | |||||
Source [40] |
1932 Danish Folketing election
Parties | Vote | |||||
---|---|---|---|---|---|---|
Votes | % | + / - | ||||
Social Democrats | 5,245 | 43.44 | +1.30 | |||
Conservatives | 2,955 | 24.48 | +1.15 | |||
Venstre | 2,706 | 22.41 | -2.47 | |||
Social Liberals | 849 | 7.03 | -1.18 | |||
Justice Party of Denmark | 253 | 2.10 | +1.03 | |||
Communist Party of Denmark | 65 | 0.54 | +0.17 | |||
Total | 12,073 | |||||
Source [41] |
1929 Danish Folketing election
Parties | Vote | |||||
---|---|---|---|---|---|---|
Votes | % | + / - | ||||
Social Democrats | 4,785 | 42.14 | +1.89 | |||
Venstre | 2,825 | 24.88 | +1.30 | |||
Conservatives | 2,649 | 23.33 | -5.31 | |||
Social Liberals | 932 | 8.21 | +1.16 | |||
Justice Party of Denmark | 122 | 1.07 | +0.85 | |||
Communist Party of Denmark | 42 | 0.37 | +0.11 | |||
Total | 11,355 | |||||
Source [42] |
1926 Danish Folketing election
Parties | Vote | |||||
---|---|---|---|---|---|---|
Votes | % | + / - | ||||
Social Democrats | 4,593 | 40.25 | +1.10 | |||
Conservatives | 3,268 | 28.64 | -0.87 | |||
Venstre | 2,690 | 23.58 | +1.41 | |||
Social Liberals | 804 | 7.05 | -0.75 | |||
Communist Party of Denmark | 30 | 0.26 | +0.02 | |||
Justice Party of Denmark | 25 | 0.22 | -0.18 | |||
Total | 11,410 | |||||
Source [43] |
1924 Danish Folketing election
Parties | Vote | |||||
---|---|---|---|---|---|---|
Votes | % | + / - | ||||
Social Democrats | 4,285 | 39.15 | +3.17 | |||
Conservatives | 3,230 | 29.51 | +0.17 | |||
Venstre | 2,426 | 22.17 | -2.81 | |||
Social Liberals | 854 | 7.80 | +1.92 | |||
Farmer Party | 79 | 0.72 | New | |||
Justice Party of Denmark | 44 | 0.40 | New | |||
Communist Party of Denmark | 26 | 0.24 | New | |||
Total | 10,944 | |||||
Source [44] |
September 1920 Danish Folketing election
Parties | Vote | |||||
---|---|---|---|---|---|---|
Votes | % | + / - | ||||
Social Democrats | 3,860 | 35.98 | +4.03 | |||
Conservatives | 3,148 | 29.34 | -1.97 | |||
Venstre | 2,680 | 24.98 | -2.82 | |||
Social Liberals | 631 | 5.88 | +0.70 | |||
Industry Party | 400 | 3.73 | -0.03 | |||
Danish Left Socialist Party | 10 | 0.09 | New | |||
Total | 10,729 | |||||
Source [45] |
July 1920 Danish Folketing election
Parties | Vote | |||||
---|---|---|---|---|---|---|
Votes | % | + / - | ||||
Social Democrats | 2,967 | 31.95 | +0.03 | |||
Conservatives | 2,908 | 31.31 | -0.04 | |||
Venstre | 2,582 | 27.80 | -0.04 | |||
Social Liberals | 481 | 5.18 | -0.16 | |||
Industry Party | 349 | 3.76 | +0.21 | |||
Total | 9,287 | |||||
Source [46] |
April 1920 Danish Folketing election
Parties | Vote | |||||
---|---|---|---|---|---|---|
Votes | % | |||||
Social Democrats | 3,065 | 31.92 | ||||
Conservatives | 3,011 | 31.35 | ||||
Venstre | 2,673 | 27.84 | ||||
Social Liberals | 513 | 5.34 | ||||
Industry Party | 341 | 3.55 | ||||
Total | 9,603 | |||||
Source [47] |
2024 European Parliament election in Denmark
Parties | Vote | |||||
---|---|---|---|---|---|---|
Votes | % | + / - | ||||
Green Left | 6,368 | 20.16 | +5.55 | |||
Social Democrats | 5,830 | 18.46 | -4.53 | |||
Venstre | 4,344 | 13.75 | -6.17 | |||
Red–Green Alliance | 2,764 | 8.75 | +1.75 | |||
Denmark Democrats | 2,280 | 7.22 | New | |||
Danish People's Party | 2,065 | 6.54 | -4.00 | |||
Conservatives | 1,979 | 6.27 | -0.03 | |||
Moderates | 1,833 | 5.80 | New | |||
Social Liberals | 1,702 | 5.39 | -3.09 | |||
Liberal Alliance | 1,663 | 5.27 | +3.50 | |||
The Alternative | 754 | 2.39 | -1.47 | |||
Total | 31,582 | |||||
Source [48] |
2019 European Parliament election in Denmark
Parties | Vote | |||||
---|---|---|---|---|---|---|
Votes | % | + / - | ||||
Social Democrats | 8,109 | 22.99 | +4.88 | |||
Venstre | 7,024 | 19.92 | +7.44 | |||
Green Left | 5,154 | 14.61 | +1.04 | |||
Danish People's Party | 3,716 | 10.54 | -15.15 | |||
Social Liberals | 2,990 | 8.48 | +3.46 | |||
Red–Green Alliance | 2,468 | 7.00 | New | |||
Conservatives | 2,222 | 6.30 | -7.34 | |||
People's Movement against the EU | 1,599 | 4.53 | -5.20 | |||
The Alternative | 1,361 | 3.86 | New | |||
Liberal Alliance | 626 | 1.77 | +0.02 | |||
Total | 35,269 | |||||
Source [49] |
2014 European Parliament election in Denmark
Parties | Vote | |||||
---|---|---|---|---|---|---|
Votes | % | + / - | ||||
Danish People's Party | 7,800 | 25.69 | +11.86 | |||
Social Democrats | 5,500 | 18.11 | -5.13 | |||
Conservatives | 4,142 | 13.64 | -0.26 | |||
Green Left | 4,121 | 13.57 | -3.44 | |||
Venstre | 3,791 | 12.48 | -5.00 | |||
People's Movement against the EU | 2,956 | 9.73 | +2.10 | |||
Social Liberals | 1,525 | 5.02 | +1.57 | |||
Liberal Alliance | 532 | 1.75 | +1.33 | |||
Total | 30,367 | |||||
Source [50] |
2009 European Parliament election in Denmark
Parties | Vote | |||||
---|---|---|---|---|---|---|
Votes | % | + / - | ||||
Social Democrats | 7,671 | 23.24 | -8.28 | |||
Venstre | 5,770 | 17.48 | -1.39 | |||
Green Left | 5,614 | 17.01 | +8.00 | |||
Conservatives | 4,590 | 13.90 | +3.36 | |||
Danish People's Party | 4,565 | 13.83 | +6.64 | |||
People's Movement against the EU | 2,518 | 7.63 | +1.97 | |||
Social Liberals | 1,139 | 3.45 | -2.74 | |||
June Movement | 1,006 | 3.05 | -7.33 | |||
Liberal Alliance | 139 | 0.42 | New | |||
Total | 33,012 | |||||
Source [51] |
2004 European Parliament election in Denmark
Parties | Vote | |||||
---|---|---|---|---|---|---|
Votes | % | + / - | ||||
Social Democrats | 6,229 | 31.52 | +9.07 | |||
Venstre | 3,728 | 18.87 | -1.79 | |||
Conservatives | 2,082 | 10.54 | +3.06 | |||
June Movement | 2,051 | 10.38 | -6.10 | |||
Green Left | 1,781 | 9.01 | +2.18 | |||
Danish People's Party | 1,420 | 7.19 | +1.56 | |||
Social Liberals | 1,223 | 6.19 | -2.65 | |||
People's Movement against the EU | 1,118 | 5.66 | -1.83 | |||
Christian Democrats | 128 | 0.65 | -0.72 | |||
Total | 19,760 | |||||
Source [52] |
1999 European Parliament election in Denmark
Parties | Vote | |||||
---|---|---|---|---|---|---|
Votes | % | + / - | ||||
Social Democrats | 4,796 | 22.45 | +5.04 | |||
Venstre | 4,413 | 20.66 | +1.99 | |||
June Movement | 3,521 | 16.48 | +2.47 | |||
Social Liberals | 1,888 | 8.84 | -0.84 | |||
People's Movement against the EU | 1,599 | 7.49 | -5.05 | |||
Conservatives | 1,597 | 7.48 | -8.01 | |||
Green Left | 1,459 | 6.83 | -1.63 | |||
Danish People's Party | 1,202 | 5.63 | New | |||
Centre Democrats | 592 | 2.77 | +2.12 | |||
Christian Democrats | 293 | 1.37 | +0.81 | |||
Progress Party | 120 | 0.56 | -1.98 | |||
Total | 21,360 | |||||
Source [53] |
1994 European Parliament election in Denmark
Parties | Vote | |||||
---|---|---|---|---|---|---|
Votes | % | + / - | ||||
Venstre | 4,123 | 18.67 | -0.78 | |||
Social Democrats | 3,845 | 17.41 | -8.61 | |||
Conservatives | 3,422 | 15.49 | +3.98 | |||
June Movement | 3,094 | 14.01 | New | |||
People's Movement against the EU | 2,769 | 12.54 | -4.02 | |||
Social Liberals | 2,138 | 9.68 | +6.37 | |||
Green Left | 1,869 | 8.46 | -0.79 | |||
Progress Party | 561 | 2.54 | -2.55 | |||
Centre Democrats | 144 | 0.65 | -6.59 | |||
Christian Democrats | 124 | 0.56 | -1.01 | |||
Total | 22,089 | |||||
Source [54] |
1989 European Parliament election in Denmark
Parties | Vote | |||||
---|---|---|---|---|---|---|
Votes | % | + / - | ||||
Social Democrats | 4,869 | 26.02 | +4.61 | |||
Venstre | 3,640 | 19.45 | +4.36 | |||
People's Movement against the EU | 3,098 | 16.56 | -2.11 | |||
Conservatives | 2,153 | 11.51 | -9.00 | |||
Green Left | 1,730 | 9.25 | +0.89 | |||
Centre Democrats | 1,354 | 7.24 | +1.16 | |||
Progress Party | 952 | 5.09 | +2.04 | |||
Social Liberals | 620 | 3.31 | -0.61 | |||
Christian Democrats | 294 | 1.57 | -0.11 | |||
Total | 18,710 | |||||
Source [55] |
1984 European Parliament election in Denmark
Parties | Vote | |||||
---|---|---|---|---|---|---|
Votes | % | |||||
Social Democrats | 4,539 | 21.41 | ||||
Conservatives | 4,348 | 20.51 | ||||
People's Movement against the EU | 3,959 | 18.67 | ||||
Venstre | 3,199 | 15.09 | ||||
Green Left | 1,773 | 8.36 | ||||
Centre Democrats | 1,289 | 6.08 | ||||
Social Liberals | 831 | 3.92 | ||||
Progress Party | 647 | 3.05 | ||||
Christian Democrats | 356 | 1.68 | ||||
Left Socialists | 262 | 1.24 | ||||
Total | 21,203 | |||||
Source [56] |
2022 Danish European Union opt-out referendum [57]
Option | Votes | % |
---|---|---|
✓ YES | 23,954 | 65.43 |
X NO | 12,656 | 34.57 |
2015 Danish European Union opt-out referendum [58]
Option | Votes | % |
---|---|---|
X NO | 22,266 | 57.70 |
✓ YES | 16,326 | 42.30 |
2014 Danish Unified Patent Court membership referendum [59]
Option | Votes | % |
---|---|---|
✓ YES | 18,429 | 62.21 |
X NO | 11,194 | 37.79 |
2009 Danish Act of Succession referendum [60]
Option | Votes | % |
---|---|---|
✓ YES | 26,455 | 84.58 |
X NO | 4,823 | 15.42 |
2000 Danish euro referendum [61]
Option | Votes | % |
---|---|---|
X NO | 21,628 | 57.33 |
✓ YES | 16,095 | 42.67 |
1998 Danish Amsterdam Treaty referendum [62]
Option | Votes | % |
---|---|---|
✓ YES | 17,558 | 52.93 |
X NO | 15,613 | 47.07 |
1993 Danish Maastricht Treaty referendum [63]
Option | Votes | % |
---|---|---|
✓ YES | 20,070 | 53.88 |
X NO | 17,179 | 46.12 |
1992 Danish Maastricht Treaty referendum [64]
Option | Votes | % |
---|---|---|
X NO | 19,772 | 54.11 |
✓ YES | 16,768 | 45.89 |
1986 Danish Single European Act referendum [65]
Option | Votes | % |
---|---|---|
✓ YES | 18,181 | 57.65 |
X NO | 13,358 | 42.35 |
1972 Danish European Communities membership referendum [66]
Option | Votes | % |
---|---|---|
✓ YES | 22,193 | 66.23 |
X NO | 11,318 | 33.77 |
1953 Danish constitutional and electoral age referendum [67]
Option | Votes | % |
---|---|---|
✓ YES | 10,214 | 84.32 |
X NO | 1,900 | 15.68 |
23 years | 6,265 | 50.54 |
21 years | 6,132 | 49.46 |
1939 Danish constitutional referendum [68]
Option | Votes | % |
---|---|---|
✓ YES | 6,180 | 89.04 |
X NO | 761 | 10.96 |
Aalborg East nominating district is one of the 92 nominating districts that was created for Danish elections following the 2007 municipal reform. It is one of the nominating districts from Aalborg Municipality, the others being Aalborg West and Aalborg North. It was created in 1915 as a constituency, and has been a nomination district since 1920, though its boundaries have been changed since then.
Skive nominating district is one of the 92 nominating districts that exists for Danish elections following the 2007 municipal reform. It consists of Skive municipality. It was created in 1849 as a constituency, and has been a nomination district since 1920, though its boundaries have been changed since then.
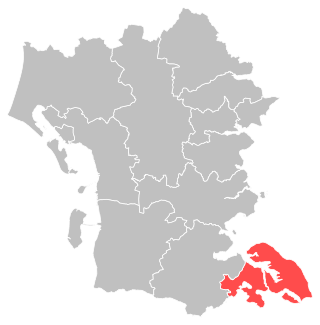
Holstebro nominating district is one of the 92 nominating districts that exists for Danish elections following the 2007 municipal reform. It consists of Holstebro Municipality. It was created in 1849 as a constituency, and has been a nomination district since 1920, though its boundaries have been changed since then.
Sønderborg nominating district is one of the 92 nominating districts that exists for Danish elections following the 2007 municipal reform. It consists of Sønderborg municipality. It was created in 1920 following its reunification with Denmark, though its boundaries have been changed since then.
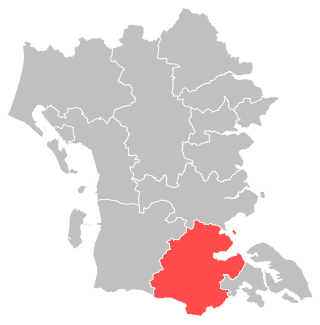
Aabenraa nominating district is one of the 92 nominating districts that exists for Danish elections following the 2007 municipal reform. It consists of Aabenraa Municipality. It was created in 1920 following its reunification with Denmark, though its boundaries have been changed since then.
Varde nominating district is one of the 92 nominating districts that exists for Danish elections following the 2007 municipal reform. It consists of Varde Municipality. It was created in 1849 as a constituency, and has been a nomination district since 1920, though its boundaries have been changed since then.
Fredericia nominating district is one of the 92 nominating districts that exits for Danish elections following the 2007 municipal reform. It consists of Fredericia Municipality. It was created in 1849 as a constituency, and has been a nomination district since 1920, though its boundaries have been changed since then.
Odense South nominating district is one of the 92 nominating districts that exists for Danish elections following the 2007 municipal reform. It is one of the three nomination districts in Odense Municipality, the others being Odense East and Odense West. It was established as a constituency in 1895 as Odense County 2, and became a nomination district in 1920. It was named Odense County 1 from 1964 to 1970. It obtained its current boundaries and name in 1970.
Middelfart nominating district is one of the 92 nominating districts that exists for Danish elections following the 2007 municipal reform. It consists of Middelfart and Nordfyn municipality. It was created in 1849 as a constituency, and has been a nomination district since 1920, though its boundaries have been changed since then.
Næstved nominating district is one of the 92 nominating districts that exists for Danish elections following the 2007 municipal reform. It consists of Næstved Municipality. It was created in 1849 as a constituency, and has been a nomination district since 1920, though its boundaries have been changed since then.
Kalundborg nominating district is one of the 92 nominating districts that exists for Danish elections following the 2007 municipal reform. It consists of Kalundborg and Odsherred municipality. It was created in 1849 as a constituency, and has been a nomination district since 1920, though its boundaries have been changed since then. Prior to 1970 it was known as Kalundborg-Onsbjerg.
Helsingør nominating district is one of the 92 nominating districts that exists for Danish elections following the 2007 municipal reform. It consists of Helsingør Municipality. It was created in 1849 as a constituency, and has been a nomination district since 1920. It is the only current nomination district whose boundaries have been unchanged since 1849.
Fredensborg nominating district is one of the 92 nominating districts that was created for Danish elections following the 2007 municipal reform. It consists of Fredensborg and Hørsholm municipality. It was created in 1849 as a constituency, and has been a nomination district since 1920, though its boundaries have been changed since then.
Gentofte nominating district is one of the 92 nominating districts that exists for Danish elections following the 2007 municipal reform. It consists of Gentofte Municipality. It was created in 1915 with its current boundary, though from 1950 to 2007 the other half of the municipality was part of a separate Hellerup nomination district.
Østerbro nominating district is one of the 92 nominating districts in Denmark. It was latest updated following the 2007 municipal reform. It is one of the 9 nominating districts in Copenhagen Municipality. It was created in 1915, though its boundaries have been changed since then.
Bispebjerg nominating district is one of the 92 nominating districts that exists for Danish elections following the 2007 municipal reform. It is one of the 9 nominating districts in Copenhagen Municipality. It was created in 1915, though its boundaries have been changed since then.
Valby nominating district is one of the 92 nominating districts that was created for Danish elections following the 2007 municipal reform. It is one of the 9 nominating districts in Copenhagen Municipality. It was created in 1895. In 1915 its boundaries were changed, and it became a nomination district. In 1953 it was divided into Valby-vest and Valby-øst. Valby-vest was renamed Valby from 1970 onwards, and this nomination district was expanded in area in 2007.
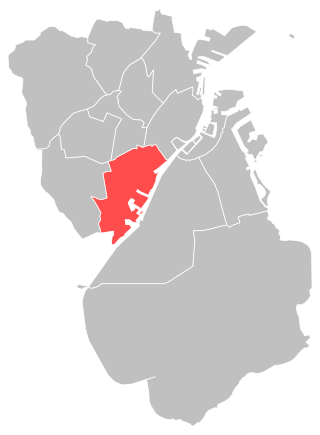
Vesterbro nominating district is one of the 92 nominating districts exists for Danish elections following the 2007 municipal reform. It is one of the 9 nominating districts in Copenhagen Municipality. It was created in 1915, though its boundaries have been changed since then.
Falkoner nominating district is one of the 92 nominating districts that exists for Danish elections following the 2007 municipal reform. It is one of the 2 nominating districts in Frederiksberg Municipality, the other being Slots. It was created in 1915, though its boundaries have been changed since then.
Slots nominating district is one of the 92 nominating districts that exists for Danish elections following the 2007 municipal reform. It is one of the 2 nominating districts in Frederiksberg Municipality, the other being Falkoner. It was created in 1915 and has maintained its boundaries since then.