Tarragona | |
|---|---|
| Municipality of Tarragona | |
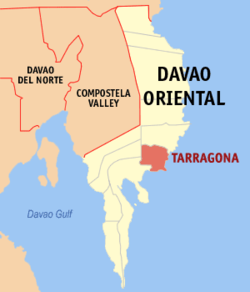
| Map of Davao Oriental with Tarragona highlighted | |
Location within the Philippines | |
| Coordinates: 7°02′57″N126°26′49″E / 7.0491°N 126.44708°E | |
| Country | Philippines |
| Region | Davao Region |
| Province | Davao Oriental |
| District | 1st district |
| Named after | Tarragona, Spain |
| Barangays | 10 (see Barangays) |
| Government | |
| • Type | Sangguniang Bayan |
| • Mayor | Samuel L. Uy |
| • Vice Mayor | Nestor L. Uy |
| • Representative | Nelson L. Dayanghirang |
| • Municipal Council | Members |
| • Electorate | 24,884 voters (2025) |
| Area | |
• Total | 300.76 km2 (116.12 sq mi) |
| Elevation | 178 m (584 ft) |
| Highest elevation | 1,733 m (5,686 ft) |
| Lowest elevation | 0 m (0 ft) |
| Population (2024 census) [3] | |
• Total | 27,349 |
| • Density | 91/km2 (240/sq mi) |
| • Households | 5,632 |
| Economy | |
| • Income class | 3rd municipal income class |
| • Poverty incidence | 34.47 |
| • Revenue | ₱ 207.5 million (2022) |
| • Assets | ₱ 423.1 million (2022) |
| • Expenditure | ₱ 202.3 million (2022) |
| • Liabilities | ₱ 75.16 million (2022) |
| Service provider | |
| • Electricity | Davao Oriental Electric Cooperative (DORECO) |
| Time zone | UTC+8 (PST) |
| ZIP code | 8201 |
| PSGC | |
| IDD : area code | +63 (0)87 |
| Native languages | Davawenyo Surigaonon Cebuano Kalagan Kamayo Tagalog |
| Website | www |
Tarragona, officially the Municipality of Tarragona (Cebuano : Lungsod sa Tarragona; Tagalog : Bayan ng Tarragona), is a municipality in the province of Davao Oriental, Philippines. According to the 2020 census, it has a population of 26,996 people. [5]
Tarragona is politically subdivided into 10 barangays. Each barangay consists of puroks while some have sitios.
Tarragona has a tropical rainforest climate (Af) with heavy rainfall year-round.
| Climate data for Tarragona | |||||||||||||
|---|---|---|---|---|---|---|---|---|---|---|---|---|---|
| Month | Jan | Feb | Mar | Apr | May | Jun | Jul | Aug | Sep | Oct | Nov | Dec | Year |
| Mean daily maximum °C (°F) | 30.4 (86.7) | 30.6 (87.1) | 31.5 (88.7) | 32.2 (90.0) | 32.0 (89.6) | 31.4 (88.5) | 31.2 (88.2) | 31.4 (88.5) | 31.7 (89.1) | 31.8 (89.2) | 31.6 (88.9) | 30.9 (87.6) | 31.4 (88.5) |
| Daily mean °C (°F) | 26.0 (78.8) | 26.2 (79.2) | 26.7 (80.1) | 27.4 (81.3) | 27.5 (81.5) | 27.0 (80.6) | 26.8 (80.2) | 26.9 (80.4) | 27.0 (80.6) | 27.2 (81.0) | 27.0 (80.6) | 26.5 (79.7) | 26.9 (80.3) |
| Mean daily minimum °C (°F) | 21.7 (71.1) | 21.8 (71.2) | 22.0 (71.6) | 22.6 (72.7) | 23.0 (73.4) | 22.6 (72.7) | 22.4 (72.3) | 22.5 (72.5) | 22.4 (72.3) | 22.6 (72.7) | 22.4 (72.3) | 22.2 (72.0) | 22.3 (72.2) |
| Average rainfall mm (inches) | 321 (12.6) | 254 (10.0) | 184 (7.2) | 142 (5.6) | 132 (5.2) | 148 (5.8) | 129 (5.1) | 115 (4.5) | 106 (4.2) | 146 (5.7) | 151 (5.9) | 234 (9.2) | 2,062 (81) |
| Source: Climate-Data.org [6] | |||||||||||||
| Year | Pop. | ±% p.a. |
|---|---|---|
| 1970 | 9,468 | — |
| 1975 | 11,149 | +3.33% |
| 1980 | 14,122 | +4.84% |
| 1990 | 18,495 | +2.73% |
| 1995 | 19,779 | +1.27% |
| 2000 | 22,846 | +3.14% |
| 2007 | 24,363 | +0.89% |
| 2010 | 25,671 | +1.92% |
| 2015 | 26,225 | +0.41% |
| 2020 | 26,996 | +0.61% |
| 2024 | 27,349 | +0.31% |
| Source: Philippine Statistics Authority [7] [8] [9] [10] [11] | ||
Poverty incidence of Tarragona
10 20 30 40 50 60 70 2000 60.26 2003 62.30 2006 39.00 2009 62.31 2012 56.86 2015 34.92 2018 38.21 2021 34.47 Source: Philippine Statistics Authority [12] [13] [14] [15] [16] [17] [18] [19] |