A visual variable, in cartographic design, graphic design, and data visualization, is an aspect of a graphical object that can visually differentiate it from other objects, and can be controlled during the design process. The concept was first systematized by Jacques Bertin, a French cartographer and graphic designer, and published in his 1967 book, Sémiologie Graphique.[1] Bertin identified a basic set of these variables and provided guidance for their usage; the concept and the set of variables has since been expanded, especially in cartography, where it has become a core principle of education and practice.[2][3]
Graphic techniques have been used in maps and statistical charts to represent non-visual information since the 17th Century, and information visualization blossomed in the 19th Century, highlighted by the work of William Playfair and Charles Joseph Minard. However, the direct study of this abstract use of graphical appearance began with the emergence of cartography as an academic research discipline in the mid-20th Century. In The Look of Maps (1952), often considered the genesis of American cartographic theory, Arthur H. Robinson discussed the role of size, shape, and color in establishing contrast in maps.[4] At the same time in France, Jacques Bertin published an early version of his list of visual variables: shape, value, and "sparkling" (grain).[5] Robinson, in his 1960 Elements of Cartography, which quickly became the dominant textbook on the subject, discussed size, shape, color, and pattern as the qualities of map symbols that establish contrast and represent geographic information.[6]
Bertin was a cartographer at the École pratique des hautes études (EPHE) in Paris, where he created maps and graphics for faculty from various disciplines using a wide variety of data. Seeing recurring patterns, he created a system for symbolizing qualitative and quantitative information, apparently inspired by the sciences of semiotics, Human vision, and Gestalt psychology (it is sometimes hard to tell because his early works rarely cite any sources), culminating in Sémiologie Graphique.[5] Despite having a background in cartography, and deriving many of his ideas by evaluating maps, he intended for Sémiologie Graphique to be applied to all forms of graphic design and information visualization. Soon the idea was gaining international acceptance; in 1974 Joel Morrison presented a very similar system in the context of cartographic generalization, citing neither Bertin nor Robinson but saying that it was a "traditional categorization," suggesting its widespread nature by that point.[7] Several terms were proposed for this set of categories, including Bertin's "retinal variables" (used to distinguish them from his two spatial location variables), as well as "Graphic Variables,"[8] "Symbol Dimensions,"[7] and "Primary Graphic Elements," before eventually settling on "Visual Variables," as used almost universally (in English) today.
Bertin has largely been given credit for the system of visual variables; even though he was not the first to mention the idea, Sémiologie Graphique was the first systematic and theoretical treatment, and his overall approach to graphical symbolization is still in use today with only minor modifications. Despite the title of Bertin's work, it actually contained little reference to the scientific knowledge in the field of Semiotics or any other, and was primarily a practical summation of patterns he found in practice. The "truth" of the visual variables concept was largely established by its widespread and long-lasting acceptance. Thirty years later, MacEachren connected the scientific support for this and other aspects of cartographic design in How Maps Work, bringing together research in Semiotics (especially the Semiotic theory of Charles Sanders Peirce), Gestalt psychology, Human vision, and 40 years of cartographic research.[9]
The earliest lists commonly suggested six variables: location size, shape, value, hue, orientation, and grain (pattern spacing). To this list, several additions have been suggested, with a few entering the canonical lists found in textbooks, while other suggestions have largely been dropped in cartography. With the rise of multimedia as a cartographic tool, analogous sets of non-visual communication variables have also been presented.
Core visual variables
Starting with Robinson and Bertin, a core set of visual variables has become largely canonical, appearing in cartography and information visualization textbooks, and built into most design software in some form.
Size
A cartogram representing population (a ratio or count-level property) by size.
The size of a symbol is how much space it occupies.[2] This commonly refers to the area of point symbols, and the thickness of line symbols. Size differences are relatively easy to recognize, making it a useful variable to convey information, such as a quantitative amount of something, or relative importance. Studies have shown that humans are better at judging relative differences in linear distance (e.g. one road being twice as thick as another) than relative differences in area (e.g., one circle having twice the area of another). Such estimations are the most accurate from squares. Area differences of circles are generally underestimated, but there is a large variation between people in ability to estimate two-dimensional size.[10] Correctly estimating relative volume has proven even more difficult.
Because geographical features have an actual size on the Earth, this cannot always be controlled, and sometimes works against the wishes of a cartographer; for example, it can be difficult to make a world map in which Russia does not stand out. In a cartogram the size of features is purposefully distorted to represent a variable other than area.
Shape
A selection of National Park standard point symbols, using shape to represent different types of facilities, a nominal variable.
A shape is a simple design that is used to symbolize an attribute on a map.[11] Shape is most commonly attached to point features in maps. Some shapes are simple in nature and thus are more abstract, while other shapes are more pictorial and are easy for the reader to comprehend what is trying to be conveyed.[12] Some aspects of shape are inherent to the phenomenon and may not be easily manipulable, especially in line and region symbols, such as the shape of a road or a country.[13] However, shape can still play a role in line and region symbols, such as a region filled with tree symbols or an arrowhead on a line. Also, the shape of a feature may be purposefully distorted by Cartographic generalization, especially when creating schematic representations such as many transit maps, although this distortion is rarely used to convey information, only to reduce emphasis on shape and location.
Hue is the visual perceptual property corresponding in humans to the categories called red, green, blue, and others. Maps often use hue to differentiate categories of nominal variables, such as land cover types or geologic layers.[14] Hue is also often used for its psychological connotations, such as red implying heat or danger and blue implying cold or water.
Color: value/lightness
Population density (a ratio-level variable) represented as color value, with an intuitive correspondence (i.e., dark looks like more people). Value also establishes figure-ground (color vs. white). Hue does not carry information here, but serves an aesthetic purpose.
As an aspect of color, value refers to how light or dark an object appears. Value effectively connotes "more" and "less," an ordinal measure; this makes it a very useful form of symbology in thematic maps, especially choropleth maps. Value contributes strongly to Visual hierarchy; elements that contrast most with the value of the background tend to stand out most (e.g., black on a white sheet of paper, white on a black computer screen).
Color: saturation/chroma/intensity
The synergy of Saturation (color vs. gray), value (dark vs. light), and position (centrality) to strongly establish figure-ground and visual hierarchy
The saturation of a color is its purity or intensity, created by the variety of light composing it; a single wavelength of light is of the highest saturation, while white, black, or gray has no saturation (being an even mixture of all visible wavelengths). Of the three psychological aspects of color, this is the least effective at conveying specific information, but it is very effective at establishing figure-ground and visual hierarchy, with bright colors generally standing out more than muted tones or shades of gray.
Bertin mentions saturation in his discussion of "color" (hue), but did not include it as a distinct variable. However, it has been included in almost all lists since the 1970s[7][8]
Orientation
Orientation refers to the direction labels and symbols are facing on a map (occasionally called "direction" or "angle"). Although it is not used as often as many of the other visual variables, it can be useful for communicating information about the real-world orientation of features. Common examples include wind direction and the direction in which a spring flows.
Pattern/Texture
Texture (dot density) representing disease incidence (a ratio or count-level variable), which gives the appearance of density. Also, saturation (color vs. gray) is used to create a visual hierarchy, and value (gray vs. white) establishes a figure-ground contrast for Africa.
Although terminology for this aspect still varies somewhat today, texture or pattern in this context generally refers to an aggregate symbol composed of recurring sub-symbols. This can include areas (such as a forest filled with small tree point symbols) and line symbols (such as a railroad with recurring cross-hatches). These sub-symbols can themselves be created by any or all of the above visual variables, but a few variables apply to the overall pattern:
Grain/Spacing
The amount of white space between the sub-symbols in the pattern. Bertin's French term grain was translated as "texture" in the 1983 English edition,[1] and appeared frequently as such in subsequent lists, but others have suggested that granularity or just grain is a better translation.
Arrangement
The orderliness of the location of the sub-symbols in the pattern, generally either regularly spaced in rows and columns (often indicating a human construction, such as an orchard), or randomly spaced (often indicating a natural distribution). This variable first appears in Morrison's 1974 list[7]
Additional Variables
A number of additional variables have been suggested at times. Some are recent technology-driven proposals, while others are earlier entries that have fallen out of favor.
Position
The absolute location of the symbol in the design, specified as (x,y) coordinates. This was a core part of Bertin's model, who distinguished these "imposition variables" from the other "retinal variables." This has largely been dropped from most subsequent lists by cartographers, since location in a map is predetermined by geography. However, it is crucial for representing information in charts and other data visualizations; for example, position is the main method of visualizing quantitative values in a scatterplot. Even in cartography, position becomes a variable when labeling and laying out the non-map elements on the page. It is also relevant when representing fields; for example, the location of an isoline is an abstract visualization of a property, not the location of a real-world linear feature.
Pattern Orientation
In a regular arrangement, the direction in which the sub-symbols are arrayed. Bertin considered this just the area version of the primary variable of orientation, but Morrison included it as a separate variable,[7] likely because the orientation of the individual sub-symbols may be different than the angle in which they are arranged. In recent years, it has rarely been included, likely due to the overall decrease in the use of fill patterns in the era of digital cartography.
Transparency/opacity
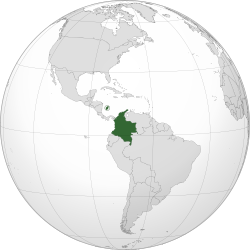
Transparency and fuzziness is used effectively here to indicate overlapping sovereignty claims.
These corollary terms refer to the degree to which a symbol blends with other symbols at the same location, giving the illusion of the symbol in front being translucent. A fairly recent addition, the control of opacity has become common in digital cartography.[2] While it is rarely used to convey specific information, it is effective for reducing contrast or to retain underlying information. Despite its widespread use, it is rarely mentioned in textbooks.
Crispness/fuzziness
This is the degree to which a symbol is drawn with crisp or fuzzy edges. Briefly mentioned in the Elements textbook in 1978,[15] the concept was more fully developed by Alan MacEachren in 1992 as a tool for representing locational uncertainty;[16] he first called it focus, then chose crispness, which has been the most common term in subsequent lists.
Resolution
This is the technique of purposefully pixelating a symbol or feature as a way of generalizing and obscuring it, usually for communicating some form of uncertainty about the feature. This was also first introduced in that context by MacEachren,[16] but is not commonly used, and has rarely been mentioned since.[2] By extension, this can also refer to the general level of detail in a symbol, which is used more often than pixelation, especially in the context of cartographic generalization.
Height
On three-dimensional perspective maps, it is common to extrude shapes in the z direction, so that height represents a property.[17]
Non-visual variables
Following on the widespread usefulness of Bertin's variables, cartographers have proposed analogous sets of controllable variables for media beyond static paper maps:
Dynamic/animated maps: Duration, Order/sequence, Rate of change, Display time, Frequency of change, Synchronization (of multiple series). Many of these have entered mainstream use.[18][19]
Haptic (touch) maps: Vibration, Flutter, Pressure, Temperature, Resistance, Friction, Location, Height/Elevation, and analogues of most of the core visual variables.[20][21]
Sound: Location, Loudness, Pitch, Register, Timbre, Duration, Rate of Change, Order (sequential), Attack/Decay.[22] To date, sound has been rarely used to encode information in maps and information displays.
Visualizing Information
According to Bertin, each of the visual variables suggests its own mode of perception and interpretation, which MacEachren ties to the cognitive theory of Image schema (e.g., size: Large-small ~ more-less).[9] These modes make each variable better for representing certain kinds of information, and serving certain purposes, than others. Specifically, Bertin introduces four properties of these variables, which tie them directly to their role in the visual hierarchy and to their ability to represent data in each of Steven's levels of measurement.
Associative variables have variations that can be mentally subdued so they are easily grouped together, with none naturally standing out from the others so they do not contribute much to visual hierarchy. Bertin included Shape, Orientation, Color (Hue), and Grain (Pattern spacing) in this list; Of the post-1967 variables, Pattern Orientation and Arrangement are also associative, while Color Saturation is a possibility. These are well-suited for representing nominal variables.
In contrast, Dissociative variables have variations that are harder to ignore, because some values stand out much more than others; therefore, they play a strong role in the visual hierarchy. Size and Value are the original members of this group, 3-D Height, Color Saturation, Transparency, Crispness, and Resolution are also dissociative.
Selective variables are those with sufficiently strong variation so that the reader can isolate one value from all the others (e.g., "where are all the blue points?" amid points of various hues). All of the dissociative variables are also selective, plus Pattern Spacing and Hue (and Pattern Arrangement post-1967). These are generally better for representing precise information than non-selective variables (Orientation and Shape, although even they can be made selective if they are made distinct enough).
Ordered variables show a clear linear order between different values. Bertin listed Size, Value, and Grain as ordered; later ordered variables would include Height, Saturation, Transparency, Crispness, and Resolution. This ordering makes them useful for representing Ordinal and Interval data. Hue and Orientation are ordered; not in a typical "more-less" metaphor, but in a cyclical order. Thus they can be used to represent cyclical data.
Quantitative variables have values that can be directly measured, and are thus best for representing quantitative properties, especially Ratio-level. Bertin included only size in this variable, although some would argue that value is quantitative, if less easily measured than size.
Bertin's classification is rarely mentioned as such, but the resultant applicability preferences form a core part of symbolization, including the power of Size, Value, Saturation, and Resolution for establishing a visual hierarchy, and the following ties to Steven's levels of measurement[2]
Each of these variables may be employed to convey information, to provide contrast between different features and layers, to establish figure-ground contrast and a clear visual hierarchy, or add to the aesthetic appeal of the map.
Map symbols commonly employ multiple visual variables simultaneously. This can be used to reinforce the depiction of a single property; for example, a capital city having a symbol that is larger and a different shape than other cities, or a color progression on a choropleth map from pale yellow to dark green, using both hue and value. Alternatively, different visual variables may be used to represent different properties; for example, symbols for cities may be differentiated by size to indicate population, and by shape to indicate provincial and national capitals. Some visual variable can be combined harmoniously to make a map clearer and more informative, while other combinations tend to add more confusion than usefulness. For example, early experiments with using Chernoff faces on maps have been criticized as difficult to interpret correctly.[23]
References
12Jacque Bertin, Sémiologie Graphique. Les diagrammes, les réseaux, les cartes. With Marc Barbut [et al.]. Paris: Gauthier-Villars. Semiology of Graphics, English Edition, Translation by William J. Berg, University of Wisconsin Press, 1983.)
12345Roth, Robert E. Visual Variables, in D. Richardson, N. Castree, M.F. Goodchild, A. Kobayashki, W. Liu, and R.A. Marston, eds. The International Encyclopedia of Geography, Wiley, 2016. doi:10.1002/9781118786352.wbieg0761
↑Tyner, J. A. (2010). Principles of map design. New York: The Guilford Press.
↑Robinson, Arthur, The Look of Maps, University of Wisconsin Press, 1952
12Palsky, Gilles (2019) Jacques Bertin, from classical training to systematic thinking of graphic signs, Cartography and Geographic Information Science, 46:2, 189-193, DOI: 10.1080/15230406.2018.1523026
↑Robinson, Arthur, Elements of Cartography, Wiley, 1960, p.137
12345Morrison, Joel, A Theoretical Framework for Cartographic Generalization With Emphasis on the Process of Symbolization, International Yearbook of Cartography, V.14 (1974), p.115
12Keates, John S., Cartographic Design and Production, London: Longman, 1973
12MacEachren, Alan M., How Maps Work: Representation, Visualization, and Design, Guilford, 1995
↑Slocum, Terry A., Robert B. McMaster, Fritz C. Kessler, Hugh H. Howard, Thematic Cartography and Geovisualization, 3rd Edition, Pearson-Prentice Hall, 2009, p.84.
↑DiBiase, D., MacEachren, A. M., Krygier, J. B., & Reeves, C. (1992). Animation and the role of map design in scientific visualization. Cartography and geographic information systems, 19(4), 201–214.
↑MacEachren, A. M. (1994). Some truth with maps: A primer on symbolization and design. Association of American Geographers.
↑Griffin, A. L. (2001). Feeling it out: the use of haptic visualization for exploratory geographic analysis. Cartographic Perspectives, (39), 12–29. DOI: 10.14714/CP39.636
↑Vasconcellos, R. (1992) Knowing the Amazon through tactual graphics. Proceedings, 15th Conference of the International Cartographic Association, Bournemouth, UK, pp.206-210
↑Krygier, J. B. (1994). Sound and geographic visualization. In Visualization in Modern Cartography. A. M. MacEachren and D. R. F. Taylor (Eds.). Oxford: Pergamon, pp. 149–166
This page is based on this Wikipedia article Text is available under the CC BY-SA 4.0 license; additional terms may apply. Images, videos and audio are available under their respective licenses.