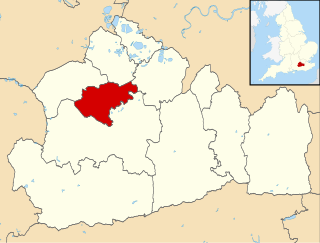
The 2000 Woking Council election took place on 4 May 2000 to elect members of Woking Borough Council in Surrey, England. The whole council was up for election with boundary changes since the last election in 1999 increasing the number of seats by one. [1] The council stayed under no overall control, [2] and overall turnout in the election was 34.32%. [3]
Borough status in the United Kingdom is granted by royal charter to local government districts in England, Wales and Northern Ireland. The status is purely honorary, and does not give any additional powers to the council or inhabitants of the district. In Scotland, similarly chartered communities were known as royal burghs, although the status is no longer granted.
Surrey is a subdivision of the English region of South East England in the United Kingdom. A historic and ceremonial county, Surrey is also one of the home counties. The county borders Kent to the east, East Sussex and West Sussex to the south, Hampshire to the west, Berkshire to the northwest, and Greater London to the northeast.
England is a country that is part of the United Kingdom. It shares land borders with Wales to the west and Scotland to the north-northwest. The Irish Sea lies west of England and the Celtic Sea lies to the southwest. England is separated from continental Europe by the North Sea to the east and the English Channel to the south. The country covers five-eighths of the island of Great Britain, which lies in the North Atlantic, and includes over 100 smaller islands, such as the Isles of Scilly and the Isle of Wight.
Party | Seats | Gains | Losses | Net gain/loss | Seats % | Votes % | Votes | +/− | |
---|---|---|---|---|---|---|---|---|---|
Liberal Democrat | 16 | +3 | 44.4 | 36.8 | 18,876 | ||||
Conservative | 14 | +1 | 38.9 | 45.0 | 23,092 | ||||
Labour | 5 | -2 | 13.9 | 15.8 | 8,008 | ||||
Independent | 1 | -1 | 2.8 | 2.5 | 1,306 |
Party | Candidate | Votes | % | ± | |
---|---|---|---|---|---|
Conservative | Mark Pritchard | 390 | 62.9 | ||
Liberal Democrat | Deryck Fowler | 188 | 30.3 | ||
Labour | Linda Kendall | 42 | 6.8 | ||
Majority | 202 | 32.6 | |||
Turnout | 620 |
Party | Candidate | Votes | % | ± | |
---|---|---|---|---|---|
Liberal Democrat | Elsie Stranks | 1,011 | |||
Liberal Democrat | Alfred Stranks | 992 | |||
Liberal Democrat | Joan Mackintosh | 959 | |||
Conservative | James Brady | 743 | |||
Conservative | Daniel Todd | 736 | |||
Conservative | Geoffrey Marlow | 717 | |||
Labour | Raymond Holroyde | 201 | |||
Labour | Brian Cozens | 165 | |||
Labour | Michael Roberts | 161 | |||
Turnout | 5,685 |
Party | Candidate | Votes | % | ± | |
---|---|---|---|---|---|
Liberal Democrat | Rosie Sharpley | 897 | |||
Liberal Democrat | Geoffrey Smith | 805 | |||
Liberal Democrat | Bryan Cross | 803 | |||
Conservative | Antony Mitchell | 587 | |||
Conservative | Hilary Addison | 584 | |||
Conservative | Simon Bellord | 556 | |||
Labour | Richard Ford | 379 | |||
Labour | Vincenzo Conigliaro | 378 | |||
Labour | David Percey | 355 | |||
Turnout | 5,344 |
Party | Candidate | Votes | % | ± | |
---|---|---|---|---|---|
Liberal Democrat | Ian Eastwood | 523 | |||
Liberal Democrat | Diana Landon | 484 | |||
Conservative | Valerian Hopkins | 334 | |||
Conservative | Sharon Lawrence | 324 | |||
Labour | James Lewis | 107 | |||
Labour | Celia Wand | 81 | |||
Turnout | 1,853 |
Party | Candidate | Votes | % | ± | |
---|---|---|---|---|---|
Liberal Democrat | Fiona Williams | 727 | |||
Liberal Democrat | Ken Howard | 718 | |||
Conservative | Clive Howse | 506 | |||
Conservative | Tariq Assi | 482 | |||
Labour | Graeme Carman | 180 | |||
Labour | Matthew Pollard | 180 | |||
Turnout | 2,793 |
Party | Candidate | Votes | % | ± | |
---|---|---|---|---|---|
Conservative | Margaret Gammon | 859 | |||
Conservative | Gordon Brown | 833 | |||
Liberal Democrat | Ann-Marie Barker | 399 | |||
Liberal Democrat | John Doran | 361 | |||
Labour | Michael Long | 96 | |||
Labour | David Mitchell | 64 | |||
Turnout | 2,642 |
Party | Candidate | Votes | % | ± | |
---|---|---|---|---|---|
Conservative | Tony Branagan | 1,060 | |||
Conservative | Jim Armitage | 1,058 | |||
Liberal Democrat | Richard Sanderson | 1,016 | |||
Conservative | Noreen Golding | 1,013 | |||
Liberal Democrat | Anthony Kremer | 943 | |||
Liberal Democrat | Gareth Davies | 937 | |||
Labour | Audrey Worgan | 160 | |||
Labour | Geraldine Clayton | 139 | |||
Labour | Colin Bright | 135 | |||
Turnout | 6,461 |
Party | Candidate | Votes | % | ± | |
---|---|---|---|---|---|
Labour | John Pattison | 651 | |||
Labour | John Martin | 560 | |||
Conservative | Norma Gruselle | 394 | |||
Conservative | Pauline Brown | 373 | |||
Liberal Democrat | Ronald Strutt | 185 | |||
Liberal Democrat | Louise Morales | 180 | |||
Turnout | 2,343 |
Party | Candidate | Votes | % | ± | |
---|---|---|---|---|---|
Independent | Michael Smith | 1,004 | |||
Liberal Democrat | Neville Hinks | 762 | |||
Liberal Democrat | Tony Hayes-Allen | 602 | |||
Conservative | Christopher Jarvis | 547 | |||
Conservative | Robin Harper | 534 | |||
Conservative | Sidney Ball | 524 | |||
Liberal Democrat | Perveen Baluch-Jenkins | 348 | |||
Labour | George Dyball | 118 | |||
Labour | Michael Eden | 116 | |||
Labour | Janis Peppitt | 111 | |||
Turnout | 4,666 |
Party | Candidate | Votes | % | ± | |
---|---|---|---|---|---|
Labour | Mohammad Raja | 946 | |||
Labour | Elizabeth Evans | 807 | |||
Labour | Barry Pope | 788 | |||
Conservative | Michael Gammon | 350 | |||
Conservative | Christopher Vardy | 297 | |||
Conservative | Michael Hopgood | 296 | |||
Liberal Democrat | David Farrow | 247 | |||
Liberal Democrat | Kevin Scott | 216 | |||
Liberal Democrat | Ian Pitwell | 208 | |||
Turnout | 4,155 |
Party | Candidate | Votes | % | ± | |
---|---|---|---|---|---|
Conservative | James Palmer | 615 | 75.5 | ||
Liberal Democrat | Sinclair Webster | 149 | 18.3 | ||
Labour | Susan Stocker | 51 | 6.3 | ||
Majority | 466 | 57.2 | |||
Turnout | 815 |
Party | Candidate | Votes | % | ± | |
---|---|---|---|---|---|
Conservative | Valerie Tinney | 739 | |||
Conservative | David Bittleston | 735 | |||
Liberal Democrat | Peter Hough | 270 | |||
Liberal Democrat | Enid McCrum | 268 | |||
Labour | Michael Kelly | 107 | |||
Labour | Ruth Callis | 102 | |||
Turnout | 2,221 |
Party | Candidate | Votes | % | ± | |
---|---|---|---|---|---|
Liberal Democrat | Ian Johnson | 672 | |||
Liberal Democrat | Hugh Shirley | 637 | |||
Conservative | Beryl Marlow | 482 | |||
Conservative | Allen Taylor | 477 | |||
Labour | Catherine Green | 80 | |||
Labour | Mark Townsend | 68 | |||
Turnout | 2,416 |
Party | Candidate | Votes | % | ± | |
---|---|---|---|---|---|
Liberal Democrat | Rosemary Johnson | 303 | 52.9 | ||
Labour | Christopher Martin | 167 | 29.1 | ||
Conservative | Sandra Palmer | 103 | 18.0 | ||
Majority | 136 | 23.8 | |||
Turnout | 573 |
Party | Candidate | Votes | % | ± | |
---|---|---|---|---|---|
Conservative | Ian Fidler | 1,114 | |||
Conservative | Peter Ankers | 1,111 | |||
Liberal Democrat | Andrew Grimshaw | 558 | |||
Liberal Democrat | Valerie Sargent | 479 | |||
Labour | Richard Cowley | 74 | |||
Labour | Suzanne Pope | 71 | |||
Turnout | 3,407 |
Party | Candidate | Votes | % | ± | |
---|---|---|---|---|---|
Conservative | Graham Cundy | 947 | |||
Conservative | John Kingsbury | 871 | |||
Liberal Democrat | Robert Leach | 257 | |||
Liberal Democrat | Marian Elsden | 255 | |||
Labour | John Bramall | 77 | |||
Labour | Celia Dyball | 68 | |||
Turnout | 2,475 |
Party | Candidate | Votes | % | ± | |
---|---|---|---|---|---|
Conservative | Mehala Gosling | 910 | |||
Conservative | Michael Popham | 891 | |||
Independent | Richard Wilson | 302 | |||
Liberal Democrat | Ian Oxford | 266 | |||
Liberal Democrat | Hasnain Bilgrami | 251 | |||
Labour | Michael Bryne | 132 | |||
Labour | Michael Barr | 91 | |||
Turnout | 2,843 |
The Borough of Woking is a local government district with borough status in the west of Surrey, England. It is one of eleven districts in the county which has administrative status as to a different set of local government powers and responsibilities.
One third of Runnymede Borough Council in Surrey, England is elected each year, followed by one year where there is an election to Surrey County Council instead. The council is divided up into 14 wards, electing 41 councillors, since the last boundary changes in 2019.
Redcar and Cleveland is a unitary authority in North Yorkshire, England. Until 1 April 1996 it was a non-metropolitan district in Cleveland.
One third of Woking Borough Council in Surrey, England is elected each year, followed by one year without election. Since the last boundary changes in 2016, 30 councillors have been elected from 10 wards.
The 1999 Woking Council election took place on 6 May 1999 to elect members of Woking Borough Council in Surrey, England.
The 2002 Woking Council election took place on 2 May 2002 to elect members of Woking Borough Council in Surrey, England. One third of the council was up for election and the council stayed under no overall control. Overall turnout in the election was 33.28%, down from 34.32% in 2000.
The 2003 Woking Council election took place on 1 May 2003 to elect members of Woking Borough Council in Surrey, England. One third of the council was up for election and the council stayed under no overall control.
The 2004 Woking Council election took place on 10 June 2004 to elect members of Woking Borough Council in Surrey, England. One third of the council was up for election and the council stayed under no overall control.
The 2006 Woking Council election took place on 4 May 2006 to elect members of Woking Borough Council in Surrey, England. One third of the council was up for election and the council stayed under no overall control.
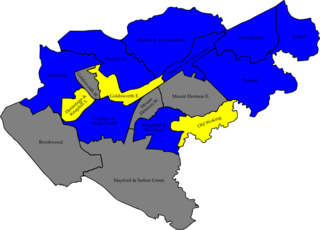
The 2007 Woking Council election took place on 3 May 2007 to elect members of Woking Borough Council in Surrey, England. One third of the council was up for election and the Conservative party gained overall control of the council from no overall control.
The 2008 Woking Council election took place on 1 May 2008 to elect members of Woking Borough Council in Surrey, England. One third of the council was up for election and the Conservative party stayed in overall control of the council.
The 2000 South Tyneside Council Metropolitan Borough election took place on 4 May 2000 to elect members of South Tyneside Metropolitan Borough Council in Tyne and Wear, England. One third of the council was up for election and the Labour party kept overall control of the council.
The 2000 Rushmoor Council election took place on 4 May 2000 to elect members of Rushmoor Borough Council in Hampshire, England. One third of the council was up for election and the Conservative party gained overall control of the council from no overall control.
The 2010 Harrogate Council election took place on 6 May 2010 to elect members of Harrogate Borough Council in North Yorkshire, England. One third of the council was up for election and the Conservative party gained overall control of the council from no overall control.
The 2010 Pendle Borough Council election took place on 6 May 2010 to elect members of Pendle Borough Council in Lancashire, England. One third of the council was up for election and the council stayed under no overall control.
The 2010 Woking Council election took place on 1 May 2010, on the same day as the 2010 general election, to elect members of Woking Borough Council in Surrey, England. One third of the council was up for election and the council stayed under no overall control.
The 2000 Maidstone Borough Council election took place on 4 May 2000 to elect members of Maidstone Borough Council in Kent, England. One third of the council was up for election and the council stayed under no overall control.
The 2000 Havant Borough Council election took place on 4 May 2000 to elect members of Havant Borough Council in Hampshire, England. One third of the council was up for election and the council stayed under no overall control.
The 2015 Woking Borough Council election took place on 7 May 2015 to elect one third of members to Woking Borough Council in England coinciding with other local elections held simultaneously with a General Election which resulted in increased turnout compared to the election four years before. Elections in each ward are held in three years out of four.
The 2018 Woking Borough Council election took place on 3 May 2018 to elect one third of members to Woking Borough Council in England coinciding with other local elections held across much of England. Elections in each ward are held in three years out of four.