York City Council election, 1992

Last updated

York City Council Election, 1992
Flag of York.svg
  1991 May 1992 1994  

Fifteen seats to York City Council

The 1992 York City Councils elections were held in May 1992 to elect members of York City Council in North Yorkshire, England. Fifteen seats, previously contested in 1988, were up for election: eleven were won by the Labour Party, three by the Conservative Party and one by the Liberal Democrats. [1] [2] The Labour Party retained overall control of the council; the composition of the council after the election was: Labour Party 34 seats, Conservative Party seven seats and Liberal Democrats four seats. [1]

City of York Council local authority of the City of York, England

City of York Council is the unitary council for the City of York, Yorkshire. It is responsible for all local government services in the City of York, except for services provided by York's town and parish councils.

North Yorkshire County of England

North Yorkshire is a non-metropolitan county and largest ceremonial county in England. It is located primarily in the region of Yorkshire and the Humber but partly in the region of North East England. The estimated population of North Yorkshire was 602,300 in mid 2016.

England Country in north-west Europe, part of the United Kingdom

England is a country that is part of the United Kingdom. It shares land borders with Wales to the west and Scotland to the north-northwest. The Irish Sea lies west of England and the Celtic Sea lies to the southwest. England is separated from continental Europe by the North Sea to the east and the English Channel to the south. The country covers five-eighths of the island of Great Britain, which lies in the North Atlantic, and includes over 100 smaller islands, such as the Isles of Scilly and the Isle of Wight.

Contents

Election results

York local election results 1992 [1] [2]
PartySeatsGainsLossesNet gain/lossSeats %Votes %Votes+/−
  Labour 1101Decrease2.svg1-45.1--
  Conservative 310Increase2.svg1-38.1--
  Liberal Democrat 1000-13.3--
  Green 0000-3.5--

Ward results

Acomb Ward

Acomb (1) [3]
PartyCandidateVotes%±
Labour B. Carradice116051.6
Conservative J. Steel87839.1
Liberal Democrat G. Whitaker1577.0
Green H. Dunnett532.4
Turnout 40.2
Labour hold Swing

Beckfield Ward

Beckfield (1) [3]
PartyCandidateVotes%±
Conservative J. Raper115149.2
Labour M. Ross101243.3
Liberal Democrat J. Dales1345.7
Green A. Hutcheon421.8
Turnout 43.8
Conservative gain from Labour Swing

Bishophill Ward

Bishophill (1) [3]
PartyCandidateVotes%±
Labour M. Long96849.3
Conservative R. Atkinson78840.1
Liberal Democrat G. Thompson1246.3
Green E. Sourbut834.2
Turnout 37.8
Labour hold Swing

Bootham Ward

Bootham (1) [3]
PartyCandidateVotes%±
Labour R. Hills92759.2
Conservative S. Thompson44728.5
Liberal Democrat D. Begbie1167.4
Green C. Everett774.9
Turnout 31.6
Labour hold Swing

Clifton Ward

Clifton (1) [3]
PartyCandidateVotes%±
Labour D. Yellen113455.0
Conservative A. Reeson72635.2
Liberal Democrat J. Telfer1386.7
Green M. Nicholson653.2
Turnout 38.3
Labour hold Swing

Fishergate Ward

Fishergate (1) [3]
PartyCandidateVotes%±
Labour J. Boardman121045.8
Conservative N. Heslop116344.0
Liberal Democrat M. Pack1555.9
Green A. Jenkins1164.4
Turnout 44.6
Labour hold Swing

Foxwood Ward

Foxwood (1) [3]
PartyCandidateVotes%±
Liberal Democrat A. Doig*146557.9
Labour I. Robertson57222.6
Conservative N. Bartram44417.5
Green J. Forrester512.0
Turnout 34.8
Liberal Democrat hold Swing
*In 1988, the seat was won by the SDP–Liberal Alliance. The members of the alliance, the Social Democratic Party (SDP) and the Liberal Party, merged in 1988 to become the Liberal Democrats.

Guildhall Ward

Guildhall (1) [3]
PartyCandidateVotes%±
Labour B. Watson93546.8
Conservative J. Butchard71835.9
Green H. Nightingale1979.9
Liberal Democrat A. Rothwell1487.4
Turnout 34.1
Labour hold Swing

Heworth Ward

Heworth (1) [3]
PartyCandidateVotes%±
Labour C. Waite129452.9
Conservative K. Stanton98440.2
Liberal Democrat A. Normandale1275.2
Green J. Tapp431.8
Turnout 44.2
Labour hold Swing

Holgate Ward

Holgate (1) [3]
PartyCandidateVotes%±
Labour R. Scrase107653.2
Conservative M. Slater74536.9
Liberal Democrat D. Horwell1607.9
Green P. Ward402.0
Turnout 38.1
Labour hold Swing

Knavesmire Ward

Knavesmire (1) [3]
PartyCandidateVotes%±
Labour R. Fletcher123955.2
Conservative J. Heaps85137.9
Green A. Layram1536.8
Turnout 42.1
Labour hold Swing

Micklegate Ward

Micklegate (1) [3]
PartyCandidateVotes%±
Conservative C. Burnett125350.6
Labour P. Hudson76630.9
Liberal Democrat A Waller40516.4
Green C. Hustwayte512.1
Turnout 46.3
Conservative hold Swing

Monk Ward

Monk (1) [3]
PartyCandidateVotes%±
Conservative S. Cook130153.6
Labour O. Rochester63326.1
Liberal Democrat G. Riding42017.3
Green J. Cossham743.0
Turnout 45.9
Conservative hold Swing

Walmgate Ward

Walmgate (1) [3]
PartyCandidateVotes%±
Labour C. Brown 94952.7
Conservative P. Thompson68538.0
Liberal Democrat D. Makin1106.1
Green K. Hacker573.2
Turnout 32.3
Labour hold Swing

Westfield Ward

Westfield (1) [3]
PartyCandidateVotes%±
Labour L. Thackeray*96345.5
Liberal Democrat D. Barker72434.2
Conservative T. Marks39318.6
Green J. Forrester351.7
Turnout 42.7
Liberal Democrat hold Swing
* In 1988, the seat was won by the SDP–Liberal Alliance. The members of the alliance, the Social Democratic Party (SDP) and the Liberal Party, merged in 1988 to become the Liberal Democrats.

Related Research Articles

2003 Bolton Metropolitan Borough Council election

Elections to Bolton Metropolitan Borough Council were held on 1 May 2003. One third of the council was up for election and the Labour party lost overall control of the council to no overall control, for the first time since 1980.

Dorset County Council elections

Dorset County Council is elected every four years by the first past the post system of election. The council currently consists of 46 councillors, representing 40 electoral divisions. The Conservative Party is currently the largest party on the council, having gained overall control in the 2001 local elections. The council meets at County Hall in Dorchester, on the site of Colliton Park adjacent to a Roman Town House.

1981 United Kingdom local elections

Local elections were held in the United Kingdom in May 1981. The results were a mid-term setback for the Conservative government, which lost 1,193 seats, leaving them with 10,545 councillors. The projected share of the vote was more respectable for the government, however: Labour 41%, Conservatives 38%, Liberals 17%. This was in spite of opinion polls showing a much wider Labour lead over the Conservatives. These were the first elections to be contested by Labour under the leadership of Michael Foot, who had succeeded James Callaghan in late 1980.

1983 United Kingdom local elections

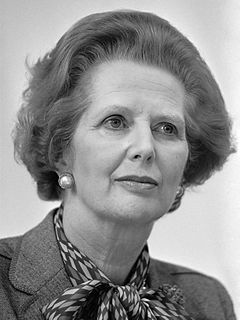
Local elections were held in the United Kingdom in 1983. The results were a success for Conservative Prime Minister Margaret Thatcher, who soon afterwards called a general election in which the Conservatives won a landslide victory. The projected share of the vote was Conservative 39%, Labour Party 36%, Liberal-SDP Alliance 20%.

1984 United Kingdom local elections

Local elections were held in the United Kingdom in 1984. There was a slight reversal in the Conservative government's fortunes, but the party remained ahead. The projected share of the vote was Conservatives 38%, Labour 37%, Liberal-SDP Alliance 21%.

1985 United Kingdom local elections

Local elections were held in the United Kingdom in 1985. The projected share of the vote was Labour 39%, Conservative 32%, Liberal-SDP Alliance 26%. Labour had the largest share of the vote in local council elections for the first time since 1981.

1986 United Kingdom local elections

Local elections were held in the United Kingdom in 1986. There was a 3% reduction in the number of councillors, owing to the abolition of the Greater London Council and the Metropolitan County Councils.

1987 United Kingdom local elections

Local elections were held in the United Kingdom in 1987. The projected share of the vote was Conservatives 38%, Labour 32%, Liberal-SDP Alliance 27%. It was the first time since 1983 that the Conservatives had enjoyed the largest share of the vote in local council elections.

1988 United Kingdom local elections

Local elections were held in the United Kingdom in 1988. The Conservative government held its ground and remained ahead in the projected popular vote.

1996 Bolton Metropolitan Borough Council election

The 1996 Bolton Metropolitan Borough Council election took place on 2 May 1996 to elect members of Bolton Metropolitan Borough Council in Greater Manchester, England. One third of the council was up for election and the Labour party kept overall control of the council

1984 Bolton Metropolitan Borough Council election

The 1984 Bolton Metropolitan Borough Council election took place on 3 May 1984 to elect members of Bolton Metropolitan Borough Council in Greater Manchester, England. One third of the council was up for election and the Labour party kept overall control of the council

1986 Bolton Metropolitan Borough Council election

The 1986 Bolton Metropolitan Borough Council election took place on 8 May 1986 to elect members of Bolton Metropolitan Borough Council in Greater Manchester, England. One third of the council was up for election and the Labour party kept overall control of the council

1987 Bolton Metropolitan Borough Council election

The 1987 Bolton Metropolitan Borough Council election took place on 7 May 1987 to elect members of Bolton Metropolitan Borough Council in Greater Manchester, England. One third of the council was up for election and the Labour party kept overall control of the council.

1988 Bolton Metropolitan Borough Council election

The 1988 Bolton Metropolitan Borough Council election took place on 5 May 1988 to elect members of Bolton Metropolitan Borough Council in Greater Manchester, England. One third of the council was up for election and the Labour party kept overall control of the council.

1990 Bolton Metropolitan Borough Council election

The 1990 Bolton Metropolitan Borough Council election took place on 4 May 1990 to elect members of Bolton Metropolitan Borough Council in Greater Manchester, England. One third of the council was up for election and the Labour party kept overall control of the council

1991 Bolton Metropolitan Borough Council election

The 1991 Bolton Metropolitan Borough Council election took place on 6 May 1991 to elect members of Bolton Metropolitan Borough Council in Greater Manchester, England. One third of the council was up for election and the Labour party kept overall control of the council.

1992 Bolton Metropolitan Borough Council election

The 1992 Bolton Metropolitan Borough Council election took place on 7 May 1992 to elect members of Bolton Metropolitan Borough Council in Greater Manchester, England. One third of the council was up for election and the Labour party kept overall control of the council.

1994 Bolton Metropolitan Borough Council election

The 1994 Bolton Metropolitan Borough Council election took place on 5 May 1994 to elect members of Bolton Metropolitan Borough Council in Greater Manchester, England. One third of the council was up for election and the Labour party kept overall control of the council.

The 1994 York City Council elections took place in May 1994 to elect the members of York City Council in North Yorkshire, England. These were the final elections to York City Council. Fifteen seats, previously contested in 1990, were up for election: twelve were won by the Labour Party, two by the Liberal Democrats and one by the Conservative Party.

References

  1. 1 2 3 "Local election results 1992". The Times (London). NewsBank. 22 May 1992.
  2. 1 2 Rallings, Colin; Thrasher, Michael (1992). Local Elections Handbook 1992 (PDF). Plymouth: Local Government Chronicle Elections Centre. p. 7. ISBN   0948858141 . Retrieved 26 July 2017.
  3. 1 2 3 4 5 6 7 8 9 10 11 12 13 14 15 Rallings, Colin; Thrasher, Michael (1992). Local Elections Handbook 1992 (PDF). Plymouth: Local Government Chronicle Elections Centre. p. 92. ISBN   0948858141 . Retrieved 26 July 2017.