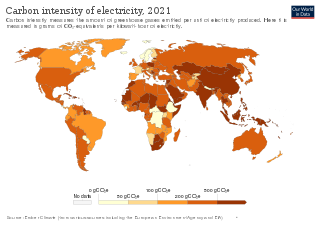
An emission intensity is the emission rate of a given pollutant relative to the intensity of a specific activity, or an industrial production process; for example grams of carbon dioxide released per megajoule of energy produced, or the ratio of greenhouse gas emissions produced to gross domestic product (GDP). Emission intensities are used to derive estimates of air pollutant or greenhouse gas emissions based on the amount of fuel combusted, the number of animals in animal husbandry, on industrial production levels, distances traveled or similar activity data. Emission intensities may also be used to compare the environmental impact of different fuels or activities. In some case the related terms emission factor and carbon intensity are used interchangeably. The jargon used can be different, for different fields/industrial sectors; normally the term "carbon" excludes other pollutants, such as particulate emissions. One commonly used figure is carbon intensity per kilowatt-hour (CIPK), which is used to compare emissions from different sources of electrical power.

A carbon footprint (or greenhouse gas footprint) is a calculated value or index that makes it possible to compare the total amount of greenhouse gases that an activity, product, company or country adds to the atmosphere. Carbon footprints are usually reported in tonnes of emissions (CO2-equivalent) per unit of comparison. Such units can be for example tonnes CO2-eq per year, per kilogram of protein for consumption, per kilometer travelled, per piece of clothing and so forth. A product's carbon footprint includes the emissions for the entire life cycle. These run from the production along the supply chain to its final consumption and disposal.

The energy policy of the United States is determined by federal, state, and local entities. It addresses issues of energy production, distribution, consumption, and modes of use, such as building codes, mileage standards, and commuting policies. Energy policy may be addressed via legislation, regulation, court decisions, public participation, and other techniques.
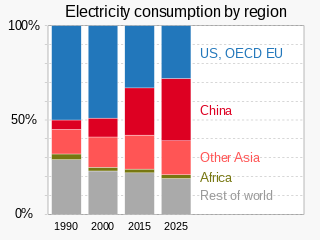
Electric energy consumption is energy consumption in the form of electrical energy. About a fifth of global energy is consumed as electricity: for residential, industrial, commercial, transportation and other purposes. Quickly increasing this share by further electrification is extremely important to limit climate change, because most other energy is consumed by burning fossil fuels thus emitting greenhouse gases which trap heat.

Energy in the United States is obtained from a diverse portfolio of sources, although the majority came from fossil fuels in 2021, as 36% of the nation's energy originated from petroleum, 32% from natural gas, and 11% from coal. Electricity from nuclear power supplied 8% and renewable energy supplied 12%, which includes biomass, wind, hydro, solar and geothermal.

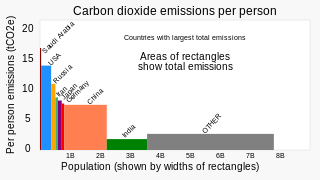
Greenhouse gas (GHG) emissions from human activities intensify the greenhouse effect. This contributes to climate change. Carbon dioxide, from burning fossil fuels such as coal, oil, and natural gas, is one of the most important factors in causing climate change. The largest emitters are China followed by the United States. The United States has higher emissions per capita. The main producers fueling the emissions globally are large oil and gas companies. Emissions from human activities have increased atmospheric carbon dioxide by about 50% over pre-industrial levels. The growing levels of emissions have varied, but have been consistent among all greenhouse gases. Emissions in the 2010s averaged 56 billion tons a year, higher than any decade before. Total cumulative emissions from 1870 to 2017 were 425±20 GtC from fossil fuels and industry, and 180±60 GtC from land use change. Land-use change, such as deforestation, caused about 31% of cumulative emissions over 1870–2017, coal 32%, oil 25%, and gas 10%.
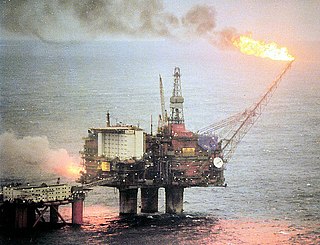
Norway is a large energy producer, and one of the world's largest exporters of oil. Most of the electricity in the country is produced by hydroelectricity. Norway is one of the leading countries in the electrification of its transport sector, with the largest fleet of electric vehicles per capita in the world.

The United States produced 5.2 billion metric tons of carbon dioxide equivalent greenhouse gas (GHG) emissions in 2020, the second largest in the world after greenhouse gas emissions by China and among the countries with the highest greenhouse gas emissions per person. In 2019 China is estimated to have emitted 27% of world GHG, followed by the United States with 11%, then India with 6.6%. In total the United States has emitted a quarter of world GHG, more than any other country. Annual emissions are over 15 tons per person and, amongst the top eight emitters, is the highest country by greenhouse gas emissions per person. However, the IEA estimates that the richest decile in the US emits over 55 tonnes of CO2 per capita each year. Because coal-fired power stations are gradually shutting down, in the 2010s emissions from electricity generation fell to second place behind transportation which is now the largest single source. In 2020, 27% of the GHG emissions of the United States were from transportation, 25% from electricity, 24% from industry, 13% from commercial and residential buildings and 11% from agriculture. In 2021, the electric power sector was the second largest source of U.S. greenhouse gas emissions, accounting for 25% of the U.S. total. These greenhouse gas emissions are contributing to climate change in the United States, as well as worldwide.
The Emissions & Generation Resource Integrated Database (eGRID) is a comprehensive source of data on the environmental characteristics of almost all electric power generated in the United States. eGRID is issued by the U.S. Environmental Protection Agency (EPA).

Coal generated about 19.5% of the electricity at utility-scale facilities in the United States in 2022, down from 38.6% in 2014 and 51% in 2001. In 2021, coal supplied 9.5 quadrillion British thermal units (2,800 TWh) of primary energy to electric power plants, which made up 90% of coal's contribution to U.S. energy supply. Utilities buy more than 90% of the coal consumed in the United States. There were over 200 coal powered units across the United States in 2022. Coal plants have been closing since the 2010s due to cheaper and cleaner natural gas and renewables. Due to measures such as scrubbers air pollution from the plants kills far fewer people nowadays, but deaths in 2020 from PM 2.5 have been estimated at 1600. Environmentalists say that political action is needed to close them faster, to also reduce greenhouse gas emissions by the United States and better limit climate change.
The Kyoto Protocol was an international treaty which extended the 1992 United Nations Framework Convention on Climate Change. A number of governments across the world took a variety of actions.

The United States Climate Alliance is a bipartisan coalition of states and unincorporated self-governing territories in the United States that are committed to upholding the objectives of the 2015 Paris Agreement on climate change within their borders, by achieving the U.S. goal of reducing greenhouse gas economy-wide emissions 26–28% from 2005 levels by 2025 and meeting or exceeding the targets of the federal Clean Power Plan.
China's greenhouse gas emissions are the largest of any country in the world both in production and consumption terms, and stem mainly from coal burning, including coal power, coal mining, and blast furnaces producing iron and steel. When measuring production-based emissions, China emitted over 14 gigatonnes (Gt) CO2eq of greenhouse gases in 2019, 27% of the world total. When measuring in consumption-based terms, which adds emissions associated with imported goods and extracts those associated with exported goods, China accounts for 13 gigatonnes (Gt) or 25% of global emissions.

The Netherlands is already affected by climate change. The average temperature in the Netherlands rose by more than 2 °C from 1901 to 2020. Climate change has resulted in increased frequency of droughts and heatwaves. Because significant portions of the Netherlands have been reclaimed from the sea or otherwise are very near sea level, the Netherlands is very vulnerable to sea level rise.

World energy supply and consumption refers to the global supply of energy resources and its consumption. The system of global energy supply consists of the energy development, refinement, and trade of energy. Energy supplies may exist in various forms such as raw resources or more processed and refined forms of energy. The raw energy resources include for example coal, unprocessed oil & gas, uranium. In comparison, the refined forms of energy include for example refined oil that becomes fuel and electricity. Energy resources may be used in various different ways, depending on the specific resource, and intended end use. Energy production and consumption play a significant role in the global economy. It is needed in industry and global transportation. The total energy supply chain, from production to final consumption, involves many activities that cause a loss of useful energy.

