List of U.S. states and territories by income

Last updated

This is a list of U.S. states, territories, and Washington, D.C. by income. Data is given according to the 2021 American Community Survey (ACS) 1-Year Estimates, except for the American Samoa, Guam, the Northern Mariana Islands and the U.S. Virgin Islands, for which the data comes from 2010, as ACS does not operate in these areas. [note 1]

Contents

States and territories ranked by median household income

Data given in 2019 dollars. No data was given for 2020. Tables do not reflect the margin of error in the values. [2]

Territory RankTerritory20212019201820172016201520142013201220112010Average annual growth rate (current dollars) in 2010–2019, %
1Flag of Guam.svg  Guam $48,274 [3] [note 2] N/A
2 Flag of the United States Virgin Islands.svg Virgin Islands (U.S.) $37,254 [4] [note 2] N/A
3Flag of American Samoa.svg  American Samoa $23,892 [5] [note 2] N/A
4Flag of the Northern Mariana Islands.svg  Northern Mariana Islands $19,958 [6] [note 2] N/A
5Flag of Puerto Rico.svg  Puerto Rico $22,237$20,474$20,296$19,343$20,078$18,626$18,928$19,183$19,429$18,660$18,8621.57%

Maps

Map of states by median household income in 2019 Map of states by median household income in 2019.svg
Map of states by median household income in 2019
Map of states by annual increase of median household income in 2010-2019 Map of US states by average annual growth of median household income, 2010-2019.svg
Map of states by annual increase of median household income in 2010–2019

States and territories ranked by per capita income

Data for the American Samoa, Guam, the Northern Mariana Islands and the U.S. Virgin Islands is given as of 2010 (source: American FactFinder). [3] Resident population given as of the 2020 United States Census. [7] [8]

RankState or territoryPer capita
income (2019), ACS [9]
Personal per capita income (2020), BEA [10] Of which disposable personal per capita income (2020), BEA [11] Median
household
income (2019), ACS [9]
Median
family
income (2019) [9]
Population (April 1, 2020)Number of
households (2019)
Number of
families (2019)
Flag of the United States.svg  United States $35,672$59,510$52,853$65,712$80,944335,073,176122,802,85279,594,270
1Flag of Washington, D.C.svg  Washington, D.C. $59,808$86,567$73,568$92,266$130,291689,545291,570124,978
2Flag of Massachusetts.svg  Massachusetts $46,241$78,458$66,978$85,843$108,3487,029,9172,650,6801,665,005
3Flag of Connecticut.svg  Connecticut $45,359$78,609$67,110$78,833$101,2723,605,9441,377,166885,911
4Flag of New Jersey.svg  New Jersey $44,888$73,460$64,031$85,751$105,7059,288,2943,286,2642,241,555
5Flag of Maryland.svg  Maryland $43,325$66,799$57,829$86,738$105,6796,177,2242,226,7671,462,070
6 Flag of New York.svg New York $41,857$74,472$62,773$72,108$89,47520,201,2497,446,8124,636,356
7 Flag of Washington.svg Washington $41,521$67,126$60,468$78,687$94,7097,705,2812,932,4771,882,896
8Flag of New Hampshire.svg  New Hampshire $41,241$67,097$60,715$77,933$97,1121,377,529541,396346,413
9Flag of Colorado.svg  Colorado $41,053$63,776$56,415$77,127$95,1645,773,7142,235,1031,421,844
10Flag of Virginia.svg  Virginia $40,635$61,958$54,283$76,456$93,4978,631,3933,191,8472,094,763
11Flag of California.svg  California $39,393$70,192$60,796$80,440$91,37739,538,22313,157,8738,972,643
12Flag of Minnesota.svg  Minnesota $39,025$62,005$54,403$74,593$93,5845,706,4942,222,5681,401,623
13Flag of Illinois.svg  Illinois $37,728$62,930$55,409$69,187$87,77112,812,5084,866,0063,059,067
14Flag of Rhode Island.svg  Rhode Island $37,525$60,825$54,610$71,169$89,3731,097,379407,174249,987
15Flag of Hawaii.svg  Hawaii $36,989$58,655$52,872$83,102$96,4621,455,271465,299316,206
16Flag of Alaska.svg  Alaska $36,978$63,502$59,053$75,463$91,971733,391252,199163,134
17Flag of Delaware.svg  Delaware $36,858$56,097$49,804$70,176$87,148989,948376,239242,584
18Flag of North Dakota.svg  North Dakota $36,611$61,530$56,569$64,577$87,055779,094323,519189,509
19Flag of Pennsylvania.svg  Pennsylvania $35,804$61,700$55,271$63,463$81,07513,002,7005,119,2493,228,224
20Flag of Vermont.svg  Vermont $35,702$59,187$53,632$63,001$83,458643,077262,767156,153
21Flag of Oregon.svg  Oregon $35,531$56,312$49,576$67,058$82,5404,237,2561,649,3521,021,588
22Flag of Wisconsin.svg  Wisconsin $34,568$55,593$49,577$64,168$81,8295,893,7182,386,6231,470,116
23Flag of Wyoming.svg  Wyoming $34,104$61,855$56,418$65,003$79,946576,851233,128152,859
24Flag of Maine.svg  Maine $34,078$54,211$48,939$58,924$76,3161,362,359573,618342,894
25Flag of Nevada.svg  Nevada $33,575$53,720$48,767$63,276$76,1243,104,6141,143,557723,755
26Flag of Nebraska.svg  Nebraska $33,272$57,570$52,064$63,229$80,0621,961,504771,444493,013
27Flag of Iowa.svg  Iowa $33,107$53,478$48,210$61,691$78,1523,190,3691,287,221808,802
28Flag of Michigan.svg  Michigan $32,892$53,259$47,982$59,584$75,70310,077,3313,969,8802,496,550
29Flag of Florida.svg  Florida $32,887$55,675$50,194$59,227$71,34821,538,1877,905,8325,083,272
30Flag of Kansas.svg  Kansas $32,885$56,099$50,579$62,087$79,0062,937,8801,138,329733,489
31Flag of Ohio.svg  Ohio $32,780$53,641$48,390$58,642$74,91111,799,4484,730,3402,942,581
32 Flag of Georgia (U.S. state).svg Georgia $32,657$51,780$46,568$61,980$74,83310,711,9083,852,7142,555,440
33Flag of Montana.svg  Montana $32,625$53,361$48,127$57,153$73,0141,084,225437,651269,009
34Flag of Texas.svg  Texas $32,267$55,129$50,523$64,034$76,72729,145,5059,985,1266,857,641
35Flag of Arizona.svg  Arizona $32,173$49,648$45,025$62,055$74,4687,151,5022,670,4411,740,704
36Flag of North Carolina.svg  North Carolina $32,021$50,305$45,060$57,341$72,04910,439,3884,046,3482,630,365
37Flag of Utah.svg  Utah $31,771$52,204$46,931$75,780$86,1523,271,6161,023,855760,968
38Flag of Missouri.svg  Missouri $31,756$51,697$46,598$57,409$73,4576,154,9132,458,3371,546,045
39Flag of South Dakota.svg  South Dakota $31,550$59,281$54,984$59,533$76,826886,667353,799223,964
40Flag of South Carolina.svg  South Carolina $31,295$48,021$43,471$56,227$70,5375,118,4251,975,9151,286,326
41Flag of Tennessee.svg  Tennessee $31,224$51,046$47,192$56,071$69,9936,910,8402,654,7371,727,895
42Flag of Indiana.svg  Indiana $30,988$51,926$46,872$57,603$73,8766,785,5282,597,7651,639,230
43Flag of Oklahoma.svg  Oklahoma $29,666$49,878$45,727$54,449$68,3583,959,3531,495,151975,754
44Flag of Idaho.svg  Idaho $29,606$48,759$44,138$60,999$72,3651,839,106655,859448,979
45Flag of Kentucky.svg  Kentucky $29,029$47,339$42,720$52,295$66,1834,505,8361,748,7321,129,276
46Flag of Louisiana.svg  Louisiana $28,662$50,874$46,771$51,073$65,1054,657,7571,741,0761,113,831
47Flag of Alabama.svg  Alabama $28,650$46,479$42,392$51,734$66,1715,024,2791,897,5761,237,883
48Flag of New Mexico.svg  New Mexico $28,423$46,338$42,803$51,945$61,8262,117,522793,420496,961
49Flag of West Virginia.svg  West Virginia $27,446$44,994$41,251$48,850$60,9201,793,716728,175470,472
50Flag of Arkansas.svg  Arkansas $27,274$47,235$43,083$48,952$62,3873,011,5241,163,647755,305
51Flag of Mississippi.svg  Mississippi $25,301$42,129$39,083$45,792$58,5032,961,2791,100,229718,382
52 [note 3] Flag of the United States Virgin Islands.svg  U.S. Virgin Islands $21,362N/AN/A$37,254$45,05887,14643,21426,237
53 [note 3] Flag of Guam.svg  Guam $16,549N/AN/A$48,274$50,607153,83642,02634,199
54Flag of Puerto Rico.svg  Puerto Rico $13,345N/AN/A$20,474$25,3883,195,1531,170,982773,798
55 [note 3] Flag of the Northern Mariana Islands.svg  Northern Mariana Islands $9,656N/AN/A$19,958$22,45547,32916,03510,714
56 [note 3] Flag of American Samoa.svg  American Samoa $6,311N/AN/A$23,892$24,70649,7109,6888,834

Historical development of per capita personal income (2023–1930)

States by historical development of per capita personal income in nominal US Dollar.

See also

Notes

  1. The U.S. Census Bureau collects data for the 50 states, the District of Columbia and Puerto Rico every year (in American Community Survey estimates). However, the U.S. Census Bureau collects data for American Samoa, Guam, the Northern Mariana Islands and the U.S. Virgin Islands only once every 10 years. [1]
  2. 1 2 3 4 2010 median income
  3. 1 2 3 4 2010 data (population according to 2020 Census)

Related Research Articles

<span class="mw-page-title-main">Saluda County, South Carolina</span> County in South Carolina, United States

Saluda County is a county in the U.S. state of South Carolina. As of the 2020 census, the population was 18,862. Its county seat is Saluda. The county was formed from northern and eastern portions of Edgefield County.

<span class="mw-page-title-main">Jasper County, South Carolina</span> County in South Carolina, United States

Jasper County is the southernmost county in the U.S. state of South Carolina. As of the 2020 census, the population was 28,791. Its county seat is Ridgeland and its largest community is Hardeeville. The county was formed in 1912 from portions of Hampton County and Beaufort County.

<span class="mw-page-title-main">Hampton County, South Carolina</span> County in South Carolina, United States

Hampton County is a rural county located in the U.S. state of South Carolina. As of the 2020 census, the population was 18,561. Its county seat is Hampton. It was named for Confederate Civil War general Wade Hampton, who in the late 1870s, with the ending of Reconstruction, was elected as governor of South Carolina.

<span class="mw-page-title-main">Georgetown County, South Carolina</span> County in South Carolina, United States

Georgetown County is a county located in the U.S. state of South Carolina. As of the 2020 census, the population was 63,404. Its county seat is Georgetown. The county was founded in 1769. It is named for George III of the United Kingdom.

<span class="mw-page-title-main">Florence County, South Carolina</span> County in South Carolina, United States

Florence County is a county located in the U.S. state of South Carolina. As of the 2020 census, its population was 137,059. Its county seat is Florence.

<span class="mw-page-title-main">Dorchester County, South Carolina</span> County in South Carolina, United States

Dorchester County is a county located in the U.S. state of South Carolina. As of the 2020 census, the population was 161,540. Its county seat is St. George.

<span class="mw-page-title-main">Dillon County, South Carolina</span> County in South Carolina, United States

Dillon County is a county located in the U.S. state of South Carolina. As of the 2020 census, the county's population was 28,292. The county seat is Dillon.

<span class="mw-page-title-main">Darlington County, South Carolina</span> County in South Carolina, United States

Darlington County is a county in the U.S. state of South Carolina. As of the 2020 census, its population was 62,905. Its county seat is Darlington. Hartsville is the largest community in the county. Darlington County is home to the Darlington Raceway, which hosts the annual NASCAR Southern 500. Darlington County is also home to Coker College in Hartsville. Darlington County was named by an act in March 1785.

<span class="mw-page-title-main">Colleton County, South Carolina</span> County in South Carolina, United States

Colleton County is in the Lowcountry region of the U.S. state of South Carolina. As of the 2020 census, the population was 38,604. Its county seat is Walterboro. The county is named after Sir John Colleton, 1st Baronet, one of the eight Lords Proprietor of the Province of Carolina. After two previous incarnations, the current Colleton County was created in 1800.

<span class="mw-page-title-main">Chesterfield County, South Carolina</span> County in South Carolina, United States

Chesterfield County is a county located in the U.S. state of South Carolina. As of the 2020 census, its population was 43,273. Its county seat is Chesterfield. The largest community in the county is Cheraw. It is located north of the Midlands, in the Pee Dee region, on its border with North Carolina.

<span class="mw-page-title-main">Chester County, South Carolina</span> County in South Carolina, United States

Chester County is a county located in the U.S. state of South Carolina. As of the 2020 census, its population was 32,294. Its county seat is Chester.

<span class="mw-page-title-main">Berkeley County, South Carolina</span> County in South Carolina, United States

Berkeley County is a county in the U.S. state of South Carolina. As of the 2020 census, its population was 229,861. Its county seat is Moncks Corner, and the largest community is Goose Creek. After two previous incarnations of Berkeley County, the current county was created in 1882. Berkeley County is included in the Charleston-North Charleston, SC Metropolitan Statistical Area.

<span class="mw-page-title-main">Beaufort County, South Carolina</span> County in South Carolina, United States

Beaufort County is a county in the U.S. state of South Carolina. As of the 2020 census, its population was 187,117. Its county seat is Beaufort and its largest community is Hilton Head Island.

<span class="mw-page-title-main">Barnwell County, South Carolina</span> County in South Carolina, United States

Barnwell County is a county in the U.S. state of South Carolina. As of the 2020 census, its population was 20,589. It is located in the Central Savannah River Area. Its county seat is Barnwell.

<span class="mw-page-title-main">Bamberg County, South Carolina</span> County in South Carolina, United States

Bamberg County is a county located in the southwestern portion of U.S. state of South Carolina. As of the 2020 census, the population was 13,311, making the rural county the fourth-least populous of any in South Carolina. Its county seat is Bamberg.

<span class="mw-page-title-main">Anderson County, South Carolina</span> County in South Carolina, United States

Anderson County is a county located in the U.S. state of South Carolina. As of the 2020 census, its population was 203,718. Its county seat is Anderson. Named for Revolutionary War leader Robert Anderson, the county is located in northwestern South Carolina, along the state line of Georgia. Anderson County is included in the Greenville-Anderson-Greer, SC Metropolitan Statistical Area. Anderson County contains 55,950-acre (22,640 ha) Lake Hartwell, a U.S. Army Corps of Engineers lake with nearly 1,000 miles (1,600 km) of shoreline for residential and recreational use. The area is a growing industrial, commercial and tourist center. It is the home of Anderson University, a private, selective comprehensive university of approximately 4,000 undergraduate and graduate students.

<span class="mw-page-title-main">Allendale County, South Carolina</span> County in South Carolina, United States

Allendale County is a county located in the U.S. state of South Carolina. As of the 2020 census, the population was 8,039, making it the least populous county in South Carolina. Its county seat is Allendale.

<span class="mw-page-title-main">Economy of Virginia</span>

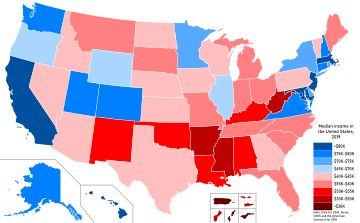
The economy of the Commonwealth of Virginia is well balanced with diverse sources of income. From the Hampton Roads area to Richmond and down to Lee County in the southwest includes military installations, cattle, tobacco and peanut farming in Southside Virginia. Tomatoes recently surpassed soy as the most profitable crop in Virginia. Tobacco, peanuts and hay are also important agricultural products from the commonwealth. Wineries and vineyards in the Northern Neck and along the Blue Ridge Mountains also have become increasingly popular. Northern Virginia hosts software, communications, consulting, defense contracting, diplomats, and considerable components of the professional government sector. As of the 2000 census, Virginia had the highest number of counties and independent cities (15) in the top 100 wealthiest jurisdictions in the United States based upon median income, in addition, Virginia tied with Colorado as having the most counties (10) in the top 100 based on per capita income. Loudoun and Fairfax counties in Northern Virginia have the highest and second highest median household income, respectively, of all counties in the United States as of 2017.

References

  1. https://www.hhs.gov/sites/default/files/section-1557-top-15-languages-faqs.pdf Hhs.gov. Section 1557 FAQs. Retrieved July 5, 2019.
  2. "S1901: INCOME IN THE PAST 12 MONTHS (IN 2018 INFLATION-ADJUSTED DOLLARS)". data.census.gov. December 19, 2019. Retrieved December 20, 2019.
  3. 1 2 White, Stuart (August 28, 2019), "Spanish-American and Philippine-American Wars", Oxford Research Encyclopedia of American History, Oxford University Press, doi:10.1093/acrefore/9780199329175.013.746, ISBN   978-0-19-932917-5 , retrieved January 5, 2021
  4. "Rural health for U.S. Virgin Islands Introduction - Rural Health Information Hub". www.ruralhealthinfo.org. Retrieved January 5, 2021.
  5. "Rural health for American Samoa Introduction - Rural Health Information Hub". www.ruralhealthinfo.org. Retrieved January 5, 2021.
  6. "Rural health for Commonwealth of the Northern Mariana Islands Introduction - Rural Health Information Hub". www.ruralhealthinfo.org. Retrieved January 5, 2021.
  7. "RESIDENT POPULATION FOR THE 50 STATES, THE DISTRICT OF COLUMBIA, AND PUERTO RICO: 2020 CENSUS" (PDF). U.S. Census Bureau.
  8. 2020 Population of U.S. Island Areas Just Under 339,000, U.S. Census Bureau, October 28, 2021.
  9. 1 2 3 "DP03 - Selected Economic Characteristics". United States Census Bureau. Retrieved February 6, 2022.
  10. "SAINC1 Personal Income Summary: Personal Income, Population, Per Capita Personal Income: Per Capita Personal Income". Bureau of Economic Analysis . Retrieved February 8, 2022.
  11. "SAINC51 Disposable Personal Income Summary: Disposable Personal Income, Population, Per Capita Disposable Personal Income: Per Capita Disposable Personal Income". Bureau of Economic Analysis. Retrieved February 8, 2022.
  12. U.S. Bureau of Economic Analysis; Federal Reserve Bank of St. Louis (1929-01-01). "Per Capita Personal Income in the District of Columbia". FRED, Federal Reserve Bank of St. Louis. Retrieved 2024-05-04.
  13. U.S. Bureau of Economic Analysis; Federal Reserve Bank of St. Louis (1929-01-01). "Per Capita Personal Income in Massachusetts". FRED, Federal Reserve Bank of St. Louis. Retrieved 2024-05-04.
  14. U.S. Bureau of Economic Analysis; Federal Reserve Bank of St. Louis (1929-01-01). "Per Capita Personal Income in Connecticut". FRED, Federal Reserve Bank of St. Louis. Retrieved 2024-05-04.
  15. U.S. Bureau of Economic Analysis; Federal Reserve Bank of St. Louis (1929-01-01). "Per Capita Personal Income in New Jersey". FRED, Federal Reserve Bank of St. Louis. Retrieved 2024-05-04.
  16. U.S. Bureau of Economic Analysis; Federal Reserve Bank of St. Louis (1929-01-01). "Per Capita Personal Income in California". FRED, Federal Reserve Bank of St. Louis. Retrieved 2024-05-04.
  17. U.S. Bureau of Economic Analysis; Federal Reserve Bank of St. Louis (1929-01-01). "Per Capita Personal Income in Washington". FRED, Federal Reserve Bank of St. Louis. Retrieved 2024-05-04.
  18. U.S. Bureau of Economic Analysis; Federal Reserve Bank of St. Louis (1929-01-01). "Per Capita Personal Income in New York". FRED, Federal Reserve Bank of St. Louis. Retrieved 2024-05-04.
  19. U.S. Bureau of Economic Analysis; Federal Reserve Bank of St. Louis (1929-01-01). "Per Capita Personal Income in Colorado". FRED, Federal Reserve Bank of St. Louis. Retrieved 2024-05-04.
  20. U.S. Bureau of Economic Analysis; Federal Reserve Bank of St. Louis (1929-01-01). "Per Capita Personal Income in Wyoming". FRED, Federal Reserve Bank of St. Louis. Retrieved 2024-05-04.
  21. U.S. Bureau of Economic Analysis; Federal Reserve Bank of St. Louis (1929-01-01). "Per Capita Personal Income in New Hampshire". FRED, Federal Reserve Bank of St. Louis. Retrieved 2024-05-04.
  22. U.S. Bureau of Economic Analysis; Federal Reserve Bank of St. Louis (1929-01-01). "Per Capita Personal Income in Maryland". FRED, Federal Reserve Bank of St. Louis. Retrieved 2024-05-04.
  23. U.S. Bureau of Economic Analysis; Federal Reserve Bank of St. Louis (1929-01-01). "Per Capita Personal Income in North Dakota". FRED, Federal Reserve Bank of St. Louis. Retrieved 2024-05-04.
  24. U.S. Bureau of Economic Analysis; Federal Reserve Bank of St. Louis (1929-01-01). "Per Capita Personal Income in Virginia". FRED, Federal Reserve Bank of St. Louis. Retrieved 2024-05-04.
  25. U.S. Bureau of Economic Analysis; Federal Reserve Bank of St. Louis (1929-01-01). "Per Capita Personal Income in Minnesota". FRED, Federal Reserve Bank of St. Louis. Retrieved 2024-05-04.
  26. U.S. Bureau of Economic Analysis; Federal Reserve Bank of St. Louis (1950-01-01). "Per Capita Personal Income in Alaska". FRED, Federal Reserve Bank of St. Louis. Retrieved 2024-05-04.
  27. U.S. Bureau of Economic Analysis; Federal Reserve Bank of St. Louis (1929-01-01). "Per Capita Personal Income in Illinois". FRED, Federal Reserve Bank of St. Louis. Retrieved 2024-05-04.
  28. U.S. Bureau of Economic Analysis; Federal Reserve Bank of St. Louis (1929-01-01). "Per Capita Personal Income in South Dakota". FRED, Federal Reserve Bank of St. Louis. Retrieved 2024-05-04.
  29. U.S. Bureau of Economic Analysis (1929-01-01). "Personal income per capita". FRED, Federal Reserve Bank of St. Louis. Retrieved 2024-05-04.
  30. U.S. Bureau of Economic Analysis; Federal Reserve Bank of St. Louis (1929-01-01). "Per Capita Personal Income in Pennsylvania". FRED, Federal Reserve Bank of St. Louis. Retrieved 2024-05-04.
  31. U.S. Bureau of Economic Analysis; Federal Reserve Bank of St. Louis (1929-01-01). "Per Capita Personal Income in Nebraska". FRED, Federal Reserve Bank of St. Louis. Retrieved 2024-05-04.
  32. U.S. Bureau of Economic Analysis; Federal Reserve Bank of St. Louis (1929-01-01). "Per Capita Personal Income in Rhode Island". FRED, Federal Reserve Bank of St. Louis. Retrieved 2024-05-04.
  33. U.S. Bureau of Economic Analysis; Federal Reserve Bank of St. Louis (1929-01-01). "Per Capita Personal Income in Vermont". FRED, Federal Reserve Bank of St. Louis. Retrieved 2024-05-04.
  34. U.S. Bureau of Economic Analysis; Federal Reserve Bank of St. Louis (1929-01-01). "Per Capita Personal Income in Oregon". FRED, Federal Reserve Bank of St. Louis. Retrieved 2024-05-04.
  35. U.S. Bureau of Economic Analysis; Federal Reserve Bank of St. Louis (1929-01-01). "Per Capita Personal Income in Texas". FRED, Federal Reserve Bank of St. Louis. Retrieved 2024-05-04.
  36. U.S. Bureau of Economic Analysis; Federal Reserve Bank of St. Louis (1929-01-01). "Per Capita Personal Income in Nevada". FRED, Federal Reserve Bank of St. Louis. Retrieved 2024-05-04.
  37. U.S. Bureau of Economic Analysis; Federal Reserve Bank of St. Louis (1950-01-01). "Per Capita Personal Income in Hawaii". FRED, Federal Reserve Bank of St. Louis. Retrieved 2024-05-04.
  38. U.S. Bureau of Economic Analysis; Federal Reserve Bank of St. Louis (1929-01-01). "Per Capita Personal Income in Delaware". FRED, Federal Reserve Bank of St. Louis. Retrieved 2024-05-04.
  39. U.S. Bureau of Economic Analysis; Federal Reserve Bank of St. Louis (1929-01-01). "Per Capita Personal Income in Wisconsin". FRED, Federal Reserve Bank of St. Louis. Retrieved 2024-05-04.
  40. U.S. Bureau of Economic Analysis; Federal Reserve Bank of St. Louis (1929-01-01). "Per Capita Personal Income in Montana". FRED, Federal Reserve Bank of St. Louis. Retrieved 2024-05-04.
  41. U.S. Bureau of Economic Analysis; Federal Reserve Bank of St. Louis (1929-01-01). "Per Capita Personal Income in Kansas". FRED, Federal Reserve Bank of St. Louis. Retrieved 2024-05-04.
  42. U.S. Bureau of Economic Analysis; Federal Reserve Bank of St. Louis (1929-01-01). "Per Capita Personal Income in Florida". FRED, Federal Reserve Bank of St. Louis. Retrieved 2024-05-04.
  43. U.S. Bureau of Economic Analysis; Federal Reserve Bank of St. Louis (1929-01-01). "Per Capita Personal Income in Maine". FRED, Federal Reserve Bank of St. Louis. Retrieved 2024-05-04.
  44. U.S. Bureau of Economic Analysis; Federal Reserve Bank of St. Louis (1929-01-01). "Per Capita Personal Income in Utah". FRED, Federal Reserve Bank of St. Louis. Retrieved 2024-05-04.
  45. U.S. Bureau of Economic Analysis; Federal Reserve Bank of St. Louis (1929-01-01). "Per Capita Personal Income in Iowa". FRED, Federal Reserve Bank of St. Louis. Retrieved 2024-05-04.
  46. U.S. Bureau of Economic Analysis; Federal Reserve Bank of St. Louis (1929-01-01). "Per Capita Personal Income in Arizona". FRED, Federal Reserve Bank of St. Louis. Retrieved 2024-05-04.
  47. U.S. Bureau of Economic Analysis; Federal Reserve Bank of St. Louis (1929-01-01). "Per Capita Personal Income in Missouri". FRED, Federal Reserve Bank of St. Louis. Retrieved 2024-05-04.
  48. U.S. Bureau of Economic Analysis; Federal Reserve Bank of St. Louis (1929-01-01). "Per Capita Personal Income in Tennessee". FRED, Federal Reserve Bank of St. Louis. Retrieved 2024-05-04.
  49. U.S. Bureau of Economic Analysis; Federal Reserve Bank of St. Louis (1929-01-01). "Per Capita Personal Income in North Carolina". FRED, Federal Reserve Bank of St. Louis. Retrieved 2024-05-04.
  50. U.S. Bureau of Economic Analysis; Federal Reserve Bank of St. Louis (1929-01-01). "Per Capita Personal Income in Ohio". FRED, Federal Reserve Bank of St. Louis. Retrieved 2024-05-04.
  51. U.S. Bureau of Economic Analysis; Federal Reserve Bank of St. Louis (1929-01-01). "Per Capita Personal Income in Indiana". FRED, Federal Reserve Bank of St. Louis. Retrieved 2024-05-04.
  52. U.S. Bureau of Economic Analysis; Federal Reserve Bank of St. Louis (1929-01-01). "Per Capita Personal Income in Michigan". FRED, Federal Reserve Bank of St. Louis. Retrieved 2024-05-04.
  53. U.S. Bureau of Economic Analysis; Federal Reserve Bank of St. Louis (1929-01-01). "Per Capita Personal Income in Idaho". FRED, Federal Reserve Bank of St. Louis. Retrieved 2024-05-04.
  54. U.S. Bureau of Economic Analysis; Federal Reserve Bank of St. Louis (1929-01-01). "Per Capita Personal Income in Georgia". FRED, Federal Reserve Bank of St. Louis. Retrieved 2024-05-04.
  55. U.S. Bureau of Economic Analysis; Federal Reserve Bank of St. Louis (1929-01-01). "Per Capita Personal Income in Louisiana". FRED, Federal Reserve Bank of St. Louis. Retrieved 2024-05-04.
  56. U.S. Bureau of Economic Analysis; Federal Reserve Bank of St. Louis (1929-01-01). "Per Capita Personal Income in South Carolina". FRED, Federal Reserve Bank of St. Louis. Retrieved 2024-05-04.
  57. U.S. Bureau of Economic Analysis; Federal Reserve Bank of St. Louis (1929-01-01). "Per Capita Personal Income in Oklahoma". FRED, Federal Reserve Bank of St. Louis. Retrieved 2024-05-04.
  58. U.S. Bureau of Economic Analysis; Federal Reserve Bank of St. Louis (1929-01-01). "Per Capita Personal Income in New Mexico". FRED, Federal Reserve Bank of St. Louis. Retrieved 2024-05-04.
  59. U.S. Bureau of Economic Analysis; Federal Reserve Bank of St. Louis (1929-01-01). "Per Capita Personal Income in Arkansas". FRED, Federal Reserve Bank of St. Louis. Retrieved 2024-05-04.
  60. U.S. Bureau of Economic Analysis; Federal Reserve Bank of St. Louis (1929-01-01). "Per Capita Personal Income in Kentucky". FRED, Federal Reserve Bank of St. Louis. Retrieved 2024-05-04.
  61. U.S. Bureau of Economic Analysis; Federal Reserve Bank of St. Louis (1929-01-01). "Per Capita Personal Income in Alabama". FRED, Federal Reserve Bank of St. Louis. Retrieved 2024-05-04.
  62. U.S. Bureau of Economic Analysis; Federal Reserve Bank of St. Louis (1929-01-01). "Per Capita Personal Income in West Virginia". FRED, Federal Reserve Bank of St. Louis. Retrieved 2024-05-04.
  63. U.S. Bureau of Economic Analysis; Federal Reserve Bank of St. Louis (1929-01-01). "Per Capita Personal Income in Mississippi". FRED, Federal Reserve Bank of St. Louis. Retrieved 2024-05-04.