List of U.S. states and territories by educational attainment

Last updated

This list of U.S. states and territories by educational attainment covers the 50 U.S. states, the District of Columbia, and the territory of Puerto Rico and their populations' educational attainment for all people of at least 25 years of age. The four other inhabited U.S. territories (American Samoa, Guam, the Northern Mariana Islands, and the U.S. Virgin Islands) are listed separately.

Contents

The data source for the main list is the U.S. Census Bureau's American Community Survey in 2021. [1] The data source for the territories table is from 2010 U.S. Census Bureau data, because those territories are excluded from the American Community Survey. [2] [3] The American Community Survey is a large demographic survey collected throughout the year using mailed questionnaires, telephone interviews, and visits from Census Bureau field representatives to about 3.5 million household addresses annually, regardless of their legal immigration status. The survey does not measure graduation rates from different educational institutions, but instead, it measures the percentage of adult residents with a high school diploma. [4]

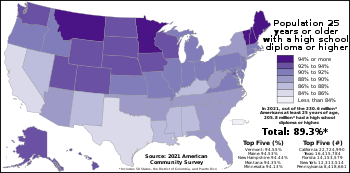
Overall, 90.3% of Americans over the age of 25 had graduated from high school in 2021, with the highest level found in the state of Massachusetts at 96.1% and the lowest in the state of California at 84.4%. In Puerto Rico, the proportion was even lower, though, at 79.6%. [1]

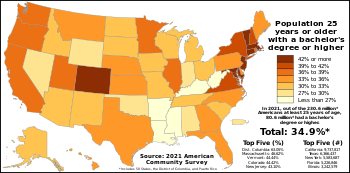
34.9% of Americans over the age of 25 had educational attainment of having a bachelor's degree or higher in 2019. The state with the highest percentage of people having a bachelor's degree or higher educational attainment was Massachusetts at 50.6%, and the lowest was West Virginia at 24.1%. The District of Columbia had a percentage significantly higher than that of any U.S. state at 63.0%. [1]

Advanced Degrees, such as Master's Degrees and Doctorates were held by 16.7% of Americans at least 25 years old in 2019. Advanced Degrees were most common in Massachusetts, with 26.3% of Massachusetts residents holding an advanced degree of any type since 2019 (it is regarded as the best state for Higher Education), and they were least common in Mississippi, with 9.3% of Mississippi residents holding an advanced degree. The District of Columbia had a percentage of 37.8%, higher than that of any state, while in the Commonwealth of Puerto Rico, 7.9% of Americans had an advanced degree, a proportion lower than any state in the U.S. [1]

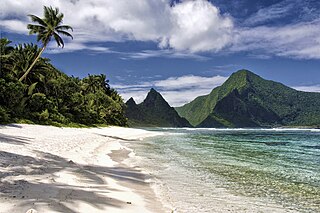
As of the 2010 census, four U.S. territories (American Samoa, Guam, the Northern Mariana Islands, and the U.S. Virgin Islands) had educational attainment numbers below every U.S. state (and the District of Columbia). In the U.S. Virgin Islands, 68.9% had attained a high school degree or higher; in American Samoa, 9.9% had attained a bachelor's degree or higher. [2] [3]

List

In the list below, one can find the population in each state and territory of the U.S. who has attained a specific education level (out of people 25 years or over), and the percentage of the population who has attained that education level. The list is initially sorted in Alphabetical order but one can click the table headers to sort by any column. [1]

State or TerritoryPopulation over the age of 25With a High School Diploma or higherWith a Bachelor's Degree or higherWith an Advanced Degree
PopulationPctPopulationPctPopulationPct
Flag of Alabama.svg  Alabama 3,451,2083,034,74187.93%946,76627.43%374,49010.85%
Flag of Alaska.svg  Alaska 485,779453,28993.31%159,29032.79%57,86811.91%
Flag of Arizona.svg  Arizona 4,980,2974,430,93488.97%1,615,08132.43%629,40812.64%
Flag of Arkansas.svg  Arkansas 2,037,7631,806,87388.67%515,03425.27%190,8979.37%
Flag of California.svg  California 26,909,86922,724,99084.45%9,737,81736.19%3,779,78714.05%
Flag of Colorado.svg  Colorado 4,044,1823,738,20892.43%1,796,24044.42%688,93117.04%
Flag of Connecticut.svg  Connecticut 2,534,3762,309,18591.11%1,067,67142.13%479,98118.94%
Flag of Delaware.svg  Delaware 711,104649,63891.36%253,29235.62%106,99715.05%
Flag of Washington, D.C.svg  District of Columbia 478,774444,23392.79%301,85263.05%181,08137.82%
Flag of Florida.svg  Florida 15,762,12214,153,57989.79%5,226,84633.16%1,978,62512.55%
Flag of Georgia (U.S. state).svg  Georgia 7,234,2716,436,39488.97%2,505,07634.63%991,06213.70%
Flag of Hawaii.svg  Hawaii 1,021,687949,47692.93%360,68135.30%133,83213.10%
Flag of Idaho.svg  Idaho 1,257,5661,147,65391.26%386,26430.72%132,50210.54%
Flag of Illinois.svg  Illinois 8,730,6977,872,69390.17%3,242,57937.14%1,310,29715.01%
Flag of Indiana.svg  Indiana 4,559,6314,132,89790.64%1,316,78728.88%473,71810.39%
Flag of Iowa.svg  Iowa 2,137,2611,994,59593.32%652,74230.54%210,8649.87%
Flag of Kansas.svg  Kansas 1,942,1331,784,71191.89%687,45235.40%259,98813.39%
Flag of Kentucky.svg  Kentucky 3,077,8672,708,14787.99%830,41426.98%341,86811.11%
Flag of Louisiana.svg  Louisiana 3,117,1862,701,88986.68%824,36926.45%300,8949.65%
Flag of Maine.svg  Maine 1,015,078959,53394.53%365,30535.99%140,31813.82%
Flag of Maryland.svg  Maryland 4,273,2603,892,44291.09%1,818,20248.55%861,66924.16%
Flag of Massachusetts.svg  Massachusetts 4,934,7554,495,56396.10%2,300,42350.62%1,049,67528.27%
Flag of Michigan.svg  Michigan 6,971,8956,411,59791.96%2,208,17031.67%870,00812.48%
Flag of Minnesota.svg  Minnesota 3,898,7423,669,89594.13%1,516,42638.90%522,54313.40%
Flag of Mississippi.svg  Mississippi 1,968,1671,702,17886.49%487,66324.78%184,0079.35%
Flag of Missouri.svg  Missouri 4,226,6343,871,24991.59%1,340,64331.72%517,42812.24%
Flag of Montana.svg  Montana 766,758723,45094.35%266,82034.80%95,44312.45%
Flag of Nebraska.svg  Nebraska 1,292,5361,191,22192.16%445,26134.45%158,75112.28%
Flag of Nevada.svg  Nevada 2,192,8261,911,17387.16%604,62627.57%211,4189.64%
Flag of New Hampshire.svg  New Hampshire 1,008,318952,23894.44%405,81540.98%158,45915.72%
Flag of New Jersey.svg  New Jersey 6,474,4275,890,49490.98%2,790,64643.10%1,126,29317.40%
Flag of New Mexico.svg  New Mexico 1,450,5491,268,95587.48%435,93030.05%204,18514.08%
Flag of New York.svg  New York 13,987,09412,313,51488.03%5,583,68740.90%2,477,84817.72%
Flag of North Carolina.svg  North Carolina 7,245,6326,499,14589.70%2,529,65734.91%955,97613.19%
Flag of North Dakota.svg  North Dakota 506,739474,43293.62%160,84731.74%47,5339.38%
Flag of Ohio.svg  Ohio 8,117,9737,447,65991.74%2,493,91030.72%957,28611.79%
Flag of Oklahoma.svg  Oklahoma 2,639,8892,341,87588.71%737,18327.92%254,0159.62%
Flag of Oregon.svg  Oregon 3,030,6352,784,37391.87%1,101,06136.33%420,75513.88%
Flag of Pennsylvania.svg  Pennsylvania 9,161,9458,418,66195.89%3,164,98536.54%1,277,26316.94%
Flag of Puerto Rico.svg  Puerto Rico 2,401,4091,912,62979.65%683,89428.48%190,5387.93%
Flag of Rhode Island.svg  Rhode Island 773,464689,44889.14%282,32636.50%120,73215.61%
Flag of South Carolina.svg  South Carolina 3,598,3983,224,40189.61%1,134,63631.53%429,89611.95%
Flag of South Dakota.svg  South Dakota 590,377549,36493.05%186,94631.67%59,68810.11%
Flag of Tennessee.svg  Tennessee 4,814,5334,320,48589.74%1,467,48130.48%543,07711.28%
Flag of Texas.svg  Texas 19,224,68816,415,78485.39%6,366,43733.12%2,288,61611.90%
Flag of Utah.svg  Utah 2,010,7271,873,47993.17%740,09736.81%255,21512.69%
Flag of Vermont.svg  Vermont 462,705437,47894.55%205,62144.44%85,24818.42%
Flag of Virginia.svg  Virginia 5,942,6725,430,70091.38%2,484,46041.81%1,089,58518.33%
Flag of Washington.svg  Washington 5,401,1494,987,84492.35%2,104,66240.97%817,19715.13%
Flag of West Virginia.svg  West Virginia 1,265,4391,123,97188.82%305,18824.12%125,8129.94%
Flag of Wisconsin.svg  Wisconsin 4,076,3393,804,26593.33%1,326,47832.54%450,01111.04%
Flag of Wyoming.svg  Wyoming 395,348369,99293.59%115,61829.24%42,36310.72%
Flag of the United States.svg  United States 230,594,873205,833,61290.3%80,587,35734.9%31,611,94116.7%

U.S. territories

Below is a table of the educational attainment of four U.S. territories (American Samoa, Guam, the Northern Mariana Islands, and the U.S. Virgin Islands. [2] [3] The data in the table below is from the 2010 census because these territories are not included in the American Community Survey. Puerto Rico is not included in this table because Puerto Rico is included in the American Community Survey (with the name "Puerto Rico Community Survey") [5] — Puerto Rico is included in the table above.

The data below is for people 25 years and older.

Territory % High school
graduate
or higher
(2010 census)
 % Bachelor's
degree
or higher
(2010 census)
 % Advanced
degree
(2010 census)
Total population
(2010 census)
Population with
high school degree
or higher
(2010 census)
Population with
bachelor's degree
or higher
(2010 census)
Population with
advanced degree
(2010 census)
Flag of American Samoa.svg  American Samoa 82.1%9.9%3.5%25,90721,2654,940906
Flag of Guam.svg  Guam 79.4%20.4%5.2%89,25370,90518,1794,666
Flag of the Northern Mariana Islands.svg  Northern Mariana Islands 82.4%20.2%3.7%32,60226,8656,5851,202
Flag of the United States Virgin Islands.svg  U.S. Virgin Islands 68.9%19.2%7.4%70,81348,7915,4505,229

Maps

Proportion of Americans with a high school diploma or higher in each U.S. state, the District of Columbia, and Puerto Rico as of the 2021 American Community Survey Americans with a high school education or higher by state.svg
Proportion of Americans with a high school diploma or higher in each U.S. state, the District of Columbia, and Puerto Rico as of the 2021 American Community Survey
Proportion of Americans with a bachelor's degree or higher in each U.S. state, the District of Columbia, and Puerto Rico as of the 2021 American Community Survey Americans with a bachelor's degree or higher by state.svg
Proportion of Americans with a bachelor's degree or higher in each U.S. state, the District of Columbia, and Puerto Rico as of the 2021 American Community Survey
Proportion of Americans with an advanced degree (e.g. Master's, Doctorate) in each U.S. state, the District of Columbia, and Puerto Rico as of the 2021 American Community Survey Americans with an advanced degree by state.svg
Proportion of Americans with an advanced degree (e.g. Master's, Doctorate) in each U.S. state, the District of Columbia, and Puerto Rico as of the 2021 American Community Survey
US bachelor's degree by county in the United States US bachelor's degree by county in the United States.png
US bachelor's degree by county in the United States

See also

Related Research Articles

<span class="mw-page-title-main">Insular area</span> U.S. territory that is neither a U.S. state nor the District of Columbia

In the law of the United States, an insular area is a U.S.-associated jurisdiction that is not part of a U.S. state or the District of Columbia. This includes fourteen U.S. territories administered under U.S. sovereignty, as well as three sovereign states each with a Compact of Free Association with the United States. The term also may be used to refer to the previous status of the Swan Islands, Hawaii, Puerto Rico, and the Philippines, as well as the Trust Territory of the Pacific Islands when it existed.

<span class="mw-page-title-main">Territories of the United States</span>

Territories of the United States are sub-national administrative divisions overseen by the federal government of the United States. The various American territories differ from the U.S. states and Indian reservations as they are not sovereign entities. In contrast, each state has a sovereignty separate from that of the federal government and each federally recognized Native American tribe possesses limited tribal sovereignty as a "dependent sovereign nation." Territories are classified by incorporation and whether they have an "organized" government through an organic act passed by the Congress. American territories are under American sovereignty and, consequently, may be treated as part of the United States proper in some ways and not others. Unincorporated territories in particular are not considered to be integral parts of the United States, and the Constitution of the United States applies only partially in those territories.

<span class="mw-page-title-main">American Community Survey</span> Demographic survey in the United States

The American Community Survey (ACS) is an annual demographics survey program conducted by the U.S. Census Bureau. It regularly gathers information previously contained only in the long form of the decennial census, including ancestry, US citizenship status, educational attainment, income, language proficiency, migration, disability, employment, and housing characteristics. These data are used by many public-sector, private-sector, and not-for-profit stakeholders to allocate funding, track shifting demographics, plan for emergencies, and learn about local communities.

<span class="mw-page-title-main">Office of Insular Affairs</span> Subsidiary of the Department of the Interior

The Office of Insular Affairs (OIA) is a unit of the United States Department of the Interior that oversees federal administration of several United States insular areas. It is the successor to the Bureau of Insular Affairs of the War Department, which administered certain territories from 1902 to 1939, and the Office of Territorial Affairs in the Interior Department, which was responsible for certain territories from the 1930s to the 1990s. The word "insular" comes from the Latin word insula ("island").

<span class="mw-page-title-main">Race and ethnicity in the United States</span>

The United States has a racially and ethnically diverse population. At the federal level, race and ethnicity have been categorized separately. The most recent United States census recognized five racial categories, as well as people who belong to two or more of the racial categories. The United States also recognizes the broader notion of ethnicity. The 2000 census and 2010 American Community Survey inquired about the "ancestry" of residents, while the 2020 census allowed people to enter their "origins". The Census Bureau also classified respondents as either Hispanic or Latino, identifying as an ethnicity, which comprises the minority group in the nation.

<span class="mw-page-title-main">Household income in the United States</span> US family income

Household income is an economic standard that can be applied to one household, or aggregated across a large group such as a county, city, or the whole country. It is commonly used by the United States government and private institutions to describe a household's economic status or to track economic trends in the US.

<span class="mw-page-title-main">Educational attainment in the United States</span> American levels of education

The educational attainment of the U.S. population refers to the highest level of education completed. The educational attainment of the U.S. population is similar to that of many other industrialized countries with the vast majority of the population having completed secondary education and a rising number of college graduates that outnumber high school dropouts. As a whole, the population of the United States is spending more years in formal educational programs. As with income, levels differ by race, age, household configuration, and geography.

<span class="mw-page-title-main">Demographics of Hispanic and Latino Americans</span>

The demographics of Hispanic and Latino Americans depict a population that is the second-largest ethnic group in the United States, 62 million people or 18.7% of the national population.

<span class="mw-page-title-main">Forest cover by state and territory in the United States</span>

In the United States, the forest cover by state and territory is estimated from tree-attributes using the basic statistics reported by the Forest Inventory and Analysis (FIA) program of the Forest Service. Tree volumes and weights are not directly measured in the field, but computed from other variables that can be measured.

References

  1. 1 2 3 4 5 "EDUCATIONAL ATTAINMENT". U.S. Census Bureau. Archived from the original on 19 September 2022. Retrieved 18 September 2022.
  2. 1 2 3 "SEX BY EDUCATIONAL ATTAINMENT FOR THE POPULATION 25 YEARS AND OVER in Guam". data.census.gov. Archived from the original on 22 December 2022. Retrieved 21 July 2022.
  3. 1 2 3 "SEX BY EDUCATIONAL ATTAINMENT FOR THE POPULATION 25 YEARS AND OVER in Virgin Islands". data.census.gov. Archived from the original on 22 December 2022. Retrieved 21 July 2022.
  4. Bureau, US Census. "American Community Survey (ACS)". Census.gov. Archived from the original on 5 December 2021. Retrieved 23 December 2022.
  5. Bureau, US Census. "About the Puerto Rico Community Survey". Census.gov. Archived from the original on 25 May 2023. Retrieved 15 July 2022.