Buchillon is first mentioned in 1228 as Chanliva. In 1339 it was mentioned as Buschillion.[3]
Geography
Buchillon has an area, as of 2009[update], of 2.1 square kilometers (0.81sqmi). Of this area, 0.89km2 (0.34sqmi) or 41.8% is used for agricultural purposes, while 0.67km2 (0.26sqmi) or 31.5% is forested. Of the rest of the land, 0.55km2 (0.21sqmi) or 25.8% is settled (buildings or roads), 0.04km2 (9.9 acres) or 1.9% is either rivers or lakes.[4]
Of the built up area, housing and buildings made up 20.2% and transportation infrastructure made up 5.2%. Out of the forested land, all of the forested land area is covered with heavy forests. Of the agricultural land, 28.6% is used for growing crops and 6.1% is pastures, while 7.0% is used for orchards or vine crops. All the water in the municipality is flowing water.[4]
The municipality was part of the Morges District until it was dissolved on 31 August 2006, and Buchillon became part of the new district of Morges.[5]
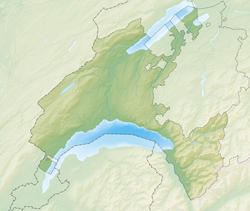
The municipality is located along Lake Geneva. It consists of the village of Buchillon and settlement of Chanivaz in the Aubonne river delta.
Coat of arms
The blazon of the municipal coat of arms is Gules, between two crossed oars Or a barrel of the same.[6]
Demographics
Buchillon has a population (as of December 2020[update]) of 687.[7]As of 2008[update], 21.0% of the population are resident foreign nationals.[8] Over the last 10 years (1999–2009 ) the population has changed at a rate of -5.7%. It has changed at a rate of -8.5% due to migration and at a rate of 3.2% due to births and deaths.[9]
Most of the population (as of 2000[update]) speaks French (495 or 82.0%), with German being second most common (45 or 7.5%) and English being third (20 or 3.3%). There are 14 people who speak Italian.[10]
Of the population in the municipality 92 or about 15.2% were born in Buchillon and lived there in 2000. There were 237 or 39.2% who were born in the same canton, while 133 or 22.0% were born somewhere else in Switzerland, and 128 or 21.2% were born outside of Switzerland.[10]
In 2008[update] there were 3 live births to Swiss citizens and 1 birth to non-Swiss citizens, and in same time span there were 2 deaths of Swiss citizens. Ignoring immigration and emigration, the population of Swiss citizens increased by 1 while the foreign population increased by 1. There were 6 Swiss men and 3 Swiss women who immigrated back to Switzerland. At the same time, there were 12 non-Swiss men and 12 non-Swiss women who immigrated from another country to Switzerland. The total Swiss population change in 2008 (from all sources, including moves across municipal borders) was a decrease of 11 and the non-Swiss population increased by 25 people. This represents a population growth rate of 2.5%.[8]
The age distribution, as of 2009[update], in Buchillon is; 54 children or 9.6% of the population are between 0 and 9 years old and 62 teenagers or 11.0% are between 10 and 19. Of the adult population, 62 people or 11.0% of the population are between 20 and 29 years old. 71 people or 12.6% are between 30 and 39, 86 people or 15.3% are between 40 and 49, and 71 people or 12.6% are between 50 and 59. The senior population distribution is 92 people or 16.3% of the population are between 60 and 69 years old, 40 people or 7.1% are between 70 and 79, there are 20 people or 3.6% who are between 80 and 89, and there are 5 people or 0.9% who are 90 and older.[11]
As of 2000[update], there were 226 people who were single and never married in the municipality. There were 328 married individuals, 27 widows or widowers and 23 individuals who are divorced.[10]
As of 2000[update], there were 245 private households in the municipality, and an average of 2.4 persons per household.[9] There were 69 households that consist of only one person and 19 households with five or more people. Out of a total of 250 households that answered this question, 27.6% were households made up of just one person and there was 1 adult who lived with their parents. Of the rest of the households, there are 74 married couples without children, 86 married couples with children There were 11 single parents with a child or children. There were 4 households that were made up of unrelated people and 5 households that were made up of some sort of institution or another collective housing.[10]
In 2000[update] there were 160 single-family homes (or 78.8% of the total) out of a total of 203 inhabited buildings. There were 23 multi-family buildings (11.3%), along with 18 multi-purpose buildings that were mostly used for housing (8.9%) and 2 other use buildings (commercial or industrial) that also had some housing (1.0%). Of the single-family homes 27 were built before 1919, while 16 were built between 1990 and 2000. The greatest number of single-family homes (28) were built between 1971 and 1980. The most multi-family homes (7) were built before 1919 and the next most (4) were built between 1971 and 1980. There were 2 multi-family houses built between 1996 and 2000.[12]
In 2000[update] there were 259 apartments in the municipality. The most common apartment size was 4 rooms of which there were 56. There were 6 single-room apartments and 132 apartments with five or more rooms. Of these apartments, a total of 227 apartments (87.6% of the total) were permanently occupied, while 26 apartments (10.0%) were seasonally occupied and 6 apartments (2.3%) were empty.[12]As of 2009[update], the construction rate of new housing units was 10.6 new units per 1000 residents.[9] The vacancy rate for the municipality, in 2010[update], was 2.18%.[9]
The historical population is given in the following chart:[3][13]
Politics
In the 2007 federal election the most popular party was the LPS Party which received 28.08% of the vote. The next three most popular parties were the SVP (16.45%), the FDP (13.92%) and the Green Party (12.04%). In the federal election, a total of 221 votes were cast, and the voter turnout was 58.5%.[14]
Economy
As of 2010[update], Buchillon had an unemployment rate of 2.3%. As of 2008[update], there were 13 people employed in the primary economic sector and about 5 businesses involved in this sector. 2 people were employed in the secondary sector and there was 1 business in this sector. 48 people were employed in the tertiary sector, with 18 businesses in this sector.[9] There were 300 residents of the municipality who were employed in some capacity, of which females made up 43.7% of the workforce.
In 2008[update] the total number of full-time equivalent jobs was 51. The number of jobs in the primary sector was 10, of which 8 were in agriculture and 2 were in fishing or fisheries. The number of jobs in the secondary sector was 1, all of which were in manufacturing. The number of jobs in the tertiary sector was 40. In the tertiary sector; 3 or 7.5% were in wholesale or retail sales or the repair of motor vehicles, 1 was in the movement and storage of goods, 12 or 30.0% were in a hotel or restaurant, 7 or 17.5% were in the information industry, 6 or 15.0% were technical professionals or scientists, 7 or 17.5% were in education and 1 was in health care.[15]
In 2000[update], there were 38 workers who commuted into the municipality and 230 workers who commuted away. The municipality is a net exporter of workers, with about 6.1 workers leaving the municipality for every one entering.[16] Of the working population, 11% used public transportation to get to work, and 66.3% used a private car.[9]
Religion
From the 2000 census[update], 158 or 26.2% were Roman Catholic, while 287 or 47.5% belonged to the Swiss Reformed Church. Of the rest of the population, there was 1 member of an Orthodox church, there were 2 individuals (or about 0.33% of the population) who belonged to the Christian Catholic Church, and there were 44 individuals (or about 7.28% of the population) who belonged to another Christian church. There were 2 individuals (or about 0.33% of the population) who were Jewish, and 2 (or about 0.33% of the population) who were Islamic. 107 (or about 17.72% of the population) belonged to no church, are agnostic or atheist, and 23 individuals (or about 3.81% of the population) did not answer the question.[10]
Education
In Buchillon about 198 or (32.8%) of the population have completed non-mandatory upper secondary education, and 167 or (27.6%) have completed additional higher education (either university or a Fachhochschule). Of the 167 who completed tertiary schooling, 48.5% were Swiss men, 30.5% were Swiss women, 15.0% were non-Swiss men and 6.0% were non-Swiss women.[10]
In the 2009/2010 school year there were a total of 59 students in the Buchillon school district. In the Vaud cantonal school system, two years of non-obligatory pre-school are provided by the political districts.[17] During the school year, the political district provided pre-school care for a total of 631 children of which 203 children (32.2%) received subsidized pre-school care. The canton's primary school program requires students to attend for four years. There were 33 students in the municipal primary school program. The obligatory lower secondary school program lasts for six years and there were 26 students in those schools.[18]
As of 2000[update], there were 87 students in Buchillon who came from another municipality, while 85 residents attended schools outside the municipality.[16]
Related Research Articles
Boussens is a municipality in the district of Gros-de-Vaud in the canton of Vaud in Switzerland.
Daillens is a municipality of the canton of Vaud in Switzerland, located in the district of Gros-de-Vaud.
Clarmont is a municipality in the Swiss canton of Vaud, located in the district of Morges.
Vaux-sur-Morges is a municipality in the Swiss canton of Vaud, located in the district of Morges.
Lussery-Villars is a municipality of the canton of Vaud in Switzerland, located in the district of Gros-de-Vaud. On 1 January 1999, Lussery and Villars-Lussery were united to form the municipality.
Dizy is a municipality of the canton of Vaud in Switzerland, located in the district of Morges.
Suscévaz is a municipality in the district of Jura-Nord Vaudois of the canton of Vaud in Switzerland.
Bercher is a municipality in the district of Gros-de-Vaud in the canton of Vaud in Switzerland.
Le Vaud is a municipality in the district of Nyon in the canton of Vaud, Switzerland.
Penthéréaz is a municipality in the district of Gros-de-Vaud in the canton of Vaud in Switzerland.
Boulens is a municipality in the district Gros-de-Vaud in the canton of Vaud in Switzerland.
Chavannes-sur-Moudon is a municipality in the district Broye-Vully in the canton of Vaud in Switzerland.
Lovatens is a municipality in the district Broye-Vully in the canton of Vaud in Switzerland.
Ogens is a municipality in the district of Gros-de-Vaud in the canton of Vaud in Switzerland.
Bottens is a municipality in the district of Gros-de-Vaud in the canton of Vaud in Switzerland.
Essertines-sur-Yverdon is a municipality in the district of Gros-de-Vaud in the canton of Vaud in Switzerland.
Oulens-sous-Échallens is a municipality in the district of Gros-de-Vaud in the canton of Vaud in Switzerland.
For people with the surname, see Bettens (surname).
La Praz is a municipality in the district of Jura-Nord Vaudois in the canton of Vaud in Switzerland.
Chigny is a municipality in the Swiss canton of Vaud, located in the district of Morges.
This page is based on this Wikipedia article Text is available under the CC BY-SA 4.0 license; additional terms may apply. Images, videos and audio are available under their respective licenses.