| ||||||||||||||||
All 81 seats to Cambridgeshire County Council 41 seats needed for a majority | ||||||||||||||||
---|---|---|---|---|---|---|---|---|---|---|---|---|---|---|---|---|
| ||||||||||||||||
Results by electoral division. Striped wards have mixed representation. | ||||||||||||||||
|
An election to Cambridgeshire County Council took place on 4 June 2009 as part of the United Kingdom local elections, 2009. The election was delayed from 7 May to coincide with elections to the European Parliament. 69 councillors were elected from 60 electoral divisions, which returned either one or two county councillors each by first-past-the-post voting. The Conservative Party retained their majority on the council, while the Green Party and UKIP gained their first seats.
Cambridgeshire County Council is the county council of Cambridgeshire, England. The council consists of 61 councillors, representing 59 electoral divisions. The Conservative Party took control of the council at the 2017 election after four years of no party having overall control. The council meets at Shire Hall in Cambridge. It is a member of the East of England Local Government Association.
All locally registered electors (British, Irish, Commonwealth and European Union citizens) who were aged 18 or over on Thursday 4 June 2009 were entitled to vote in the local elections. Those who were temporarily away from their ordinary address (for example, away working, on holiday, in student accommodation or in hospital) were also entitled to vote in the local elections, [1] although those who had moved abroad and registered as overseas electors cannot vote in the local elections. It is possible to register to vote at more than one address (such as a university student who had a term-time address and lives at home during holidays) at the discretion of the local Electoral Register Office, but it remains an offence to vote more than once in the same local government election. [2] The next election is scheduled for 4 May 2017.
In general, a Commonwealth citizen is a citizen of a member state of the Commonwealth of Nations. This designation is given legal effect in the nationality laws of some Commonwealth countries, and Commonwealth citizens may enjoy some privileges in the United Kingdom and, less commonly, other member states. Each Commonwealth country determines what special rights, if any, are accorded to citizens of other Commonwealth countries. The status is most significant in British law and has little effect in many other Commonwealth countries, such as Canada.
The European Union (EU) is a political and economic union of 28 member states that are located primarily in Europe. It has an area of 4,475,757 km2 (1,728,099 sq mi) and an estimated population of about 513 million. The EU has developed an internal single market through a standardised system of laws that apply in all member states in those matters, and only those matters, where members have agreed to act as one. EU policies aim to ensure the free movement of people, goods, services and capital within the internal market, enact legislation in justice and home affairs and maintain common policies on trade, agriculture, fisheries and regional development. For travel within the Schengen Area, passport controls have been abolished. A monetary union was established in 1999 and came into full force in 2002 and is composed of 19 EU member states which use the euro currency.
In Cambridge, the Labour Party lost two seats, to the Green Party in Abbey and to the Liberal Democrats in King's Hedges. The Conservatives, despite improving their vote in many electoral divisions and coming second citywide, failed to gain any seats. South Cambridgeshire saw three seats change hands from Conservatives to Liberal Democrats, including in Hardwick which the Liberal Democrats had held since a by-election in 2008. In East Cambridgeshire however, the Conservatives gained four seats from the Liberal Democrats, with Labour fielding candidates in several electoral divisions they did not contest in 2005. There was no change in representation from Fenland, where Conservatives won every seat. In Huntingdonshire, Liberal Democrats lost a seat to Conservatives in St Neots Eaton Socon and Eynesbury, but gained one in Godmanchester and Huntingdon East, a two-member division which subsequently had split representation. The election in the Ramsey electoral division was delayed until 23 July 2009 due to the death of one of the candidates. The election in that division was won by the United Kingdom Independence Party.
The Labour Party is a centre-left political party in the United Kingdom which has been described as an alliance of social democrats, democratic socialists and trade unionists. The party's platform emphasises greater state intervention, social justice and strengthening workers' rights.
The Liberal Democrats are a liberal political party in the United Kingdom. They presently have 11 Members of Parliament in the House of Commons, 96 members of the House of Lords, and one member of the European Parliament. They also have five Members of the Scottish Parliament and a member each in the Welsh Assembly and London Assembly. The party reached the height of its influence in the early 2010s, forming a junior partner in a coalition government from 2010 to 2015. It is presently led by Vince Cable.
King's Hedges is an electoral ward in the north of the city of Cambridge, England.
Party | Seats | Gains | Losses | Net gain/loss | Seats % | Votes % | Votes | +/− | |
---|---|---|---|---|---|---|---|---|---|
Conservative | 42 | 5 | 5 | 0 | 60.9% | 45.6% | 94,806 | ||
Liberal Democrat | 23 | 5 | 5 | 0 | 33.3% | 33.7% | 70,030 | ||
Labour | 2 | 0 | 1 | −1 | 2.9% | 9.1% | 18,824 | ||
Green | 1 | 1 | 0 | +1 | 1.4% | 4.9% | 10,351 | ||
UKIP | 1 | 1 | 0 | +1 | 1.4% | 3.3% | 6,780 | ||
Independent | 0 | 0 | 0 | 0 | 0.0% | 2.2% | 4,672 | ||
Labour Co-op | 0 | 0 | 1 | −1 | 0.0% | 0.7% | 1,409 | ||
Monster Raving Loony | 0 | 0 | 0 | 0 | 0.0% | 0.3% | 566 | ||
Libertarian | 0 | 0 | 0 | 0 | 0.0% | 0.1% | 140 | ||
UK First | 0 | 0 | 0 | 0 | 0.0% | 0.1% | 117 |
Note: the election in the Ramsey electoral division, previously held by the Conservative Party, was delayed until 23 July 2009 due to the death of one of the candidates. The election in that division was won by the United Kingdom Independence Party.
Ramsey is a small market town and civil parish in Cambridgeshire, England. The town is about 9 miles (14 km) north of Huntingdon in the non-metropolitan district and former county of Huntingdonshire, which since 1974 has been part of Cambridgeshire. Ramsey parish includes the settlements of Ramsey Forty Foot, Ramsey Heights, Ramsey Mereside, Ramsey Hollow and Ramsey St Mary's.
The following maps show the percentage of the vote each party obtained by electoral division. A colour key for each map can be viewed by clicking on the image.
Conservative Party | Liberal Democrats | Labour Party |
---|---|---|
Green Party | UKIP | |
Party | Candidate | Votes | % | ± | |
---|---|---|---|---|---|
Green | Simon Sedgwick-Jell | 855 | 40.2 | +28.2 | |
Labour Co-op | Paul Sales | 617 | 28.9 | −11.1 | |
Conservative | Timothy Haire | 362 | 17.0 | −1.2 | |
Liberal Democrat | Julian Huppert | 273 | 12.8 | −17.0 | |
Rejected ballots | 22 | 1.0 | {{{change}}} | ||
Turnout | 2,129 | 32.58 | |||
Green gain from Labour Co-op | Swing | ||||
Party | Candidate | Votes | % | ± | |
---|---|---|---|---|---|
Liberal Democrat | Rupert Moss-Eccardt | 1,146 | 41.7 | +0.7 | |
Labour Co-op | Ian Kidman | 792 | 28.8 | −4.9 | |
Conservative | Daniel Whant | 430 | 15.7 | −2.4 | |
Green | Catherine Terry | 361 | 13.1 | +5.9 | |
Rejected ballots | 19 | 0.7 | {{{change}}} | ||
Turnout | 2,747 | 40.9 | |||
Liberal Democrat hold | Swing |
Party | Candidate | Votes | % | ± | |
---|---|---|---|---|---|
Liberal Democrat | Belinda Brooks-Gordon | 1,095 | 43.1 | −9.12 | |
Independent | John Hipkin | 756 | 29.7 | N/A | |
Conservative | Edward MacNaghten | 267 | 10.5 | −8.3 | |
Green | Stephen Lawrence | 226 | 8.9 | −2.2 | |
Labour | John Buckingham | 196 | 7.7 | −10.3 | |
Rejected ballots | 13 | 0.5 | {{{change}}} | ||
Turnout | 2,543 | 37.2 | |||
Liberal Democrat hold | Swing |
Party | Candidate | Votes | % | ± | |
---|---|---|---|---|---|
Labour | Christine Carter | 1,021 | 41.9 | +1.4 | |
Conservative | Charles Harcourt | 760 | 31.2 | +5.0 | |
Green | Neil Ford | 320 | 13.1 | +7.2 | |
Liberal Democrat | Laurence Edkins | 319 | 13.1 | −14.3 | |
Rejected ballots | 17 | 0.7 | {{{change}}} | ||
Turnout | 2,436 | 38.9 | |||
Labour hold | Swing |
Party | Candidate | Votes | % | ± | |
---|---|---|---|---|---|
Labour | Tariq Sadiq | 929 | 36.1 | +0.2 | |
Conservative | Andrew Bower | 830 | 32.3 | +11.8 | |
Liberal Democrat | Thomas Yates | 325 | 12.6 | −21.8 | |
Green | Valerie Hopkins | 314 | 12.2 | +5.3 | |
UKIP | Albert Watts | 159 | 6.2 | +4.0 | |
Rejected ballots | 14 | 0.5 | {{{change}}} | ||
Turnout | 2,572 | 41.2 | |||
Labour hold | Swing |
Party | Candidate | Votes | % | ± | |
---|---|---|---|---|---|
Liberal Democrat | Siep Wijsenbeek | 807 | 35.5 | −3.7 | |
Conservative | James Strachan | 559 | 24.6 | +5.3 | |
Labour | Leonard Freeman | 339 | 14.9 | −18.1 | |
Green | Peter Pope | 331 | 14.6 | +6.1 | |
UKIP | Peter Burkinshaw | 220 | 9.7 | N/A | |
Rejected ballots | 18 | 0.8 | {{{change}}} | ||
Turnout | 2,273 | 36.1 | |||
Liberal Democrat hold | Swing |
Party | Candidate | Votes | % | ± | |
---|---|---|---|---|---|
Liberal Democrat | Andrew Pellew | 751 | 38.7 | +4.8 | |
Labour | Primrose Hughes | 500 | 25.8 | −11.1 | |
Conservative | Matthew Adams | 439 | 22.6 | +0.7 | |
Green | James Youd | 228 | 11.8 | +4.5 | |
Rejected ballots | 18 | 0.9 | {{{change}}} | ||
Turnout | 1,940 | 33.0 | |||
Liberal Democrat gain from Labour | Swing | ||||
Party | Candidate | Votes | % | ± | |
---|---|---|---|---|---|
Liberal Democrat | Sarah Whitebread | 847 | 44.5 | −5.6 | |
Conservative | Sheila Lawlor | 406 | 21.3 | +3.5 | |
Green | Keith Garrett | 401 | 21.1 | +5.3 | |
Labour | George Owers | 239 | 12.6 | −3.69 | |
Rejected ballots | 9 | 0.5 | {{{change}}} | ||
Turnout | 1,902 | 27.4 | |||
Liberal Democrat hold | Swing |
Party | Candidate | Votes | % | ± | |
---|---|---|---|---|---|
Liberal Democrat | Lucy Nethsingha | 1,051 | 45.9 | −4.7 | |
Conservative | James Sharpe | 503 | 22.0 | +4.0 | |
Green | Robert Young | 393 | 17.2 | +3.0 | |
Labour | Malcolm Schofield | 323 | 14.1 | −3.1 | |
Rejected ballots | 14 | 0.6 | {{{change}}} | ||
Turnout | 2,285 | 34.3 | |||
Liberal Democrat hold | Swing |
Party | Candidate | Votes | % | ± | |
---|---|---|---|---|---|
Liberal Democrat | Nichola Harrison | 1,009 | 41.6 | +1.3 | |
Labour | Jennifer May | 718 | 29.6 | −1.7 | |
Green | Shayne Mitchell | 353 | 14.6 | −1.1 | |
Conservative | Shapour Meftah | 335 | 13.8 | +1.1 | |
Rejected ballots | 10 | 0.4 | {{{change}}} | ||
Turnout | 2,425 | 38.5 | |||
Liberal Democrat hold | Swing |
Party | Candidate | Votes | % | ± | |
---|---|---|---|---|---|
Liberal Democrat | Geoffrey Heathcock | 1,521 | 56.2 | −3.0 | |
Conservative | Donald Douglas | 651 | 24.0 | +3.0 | |
Green | Brian Westcott | 329 | 12.2 | +6.6 | |
Labour | Jonathan Goodacre | 199 | 7.4 | −6.8 | |
Rejected ballots | 7 | 0.3 | {{{change}}} | ||
Turnout | 2,707 | 42.5 | |||
Liberal Democrat hold | Swing |
Party | Candidate | Votes | % | ± | |
---|---|---|---|---|---|
Liberal Democrat | Kilian Bourke | 829 | 34.3 | −10.7 | |
Labour | Christine Freeman | 493 | 20.4 | −12.9 | |
Independent | Thomas Woodcock | 425 | 17.6 | N/A | |
Green | Philip Richards | 297 | 12.3 | +1.5 | |
Conservative | Samuel Barker | 270 | 11.2 | +1.5 | |
UKIP | Marjorie Barr | 96 | 3.9 | +2.7 | |
Rejected ballots | 9 | 0.4 | {{{change}}} | ||
Turnout | 2,418 | 36.9 | |||
Liberal Democrat hold | Swing |
Party | Candidate | Votes | % | ± | |
---|---|---|---|---|---|
Liberal Democrat | Caroline Shepherd | 991 | 43.2 | −7.8 | |
Conservative | John Ionides | 819 | 35.7 | +8.1 | |
Green | Ceri Galloway | 292 | 12.7 | +4.6 | |
Labour | Pamela Stacey | 170 | 7.4 | −5.9 | |
Rejected ballots | 20 | 0.9 | {{{change}}} | ||
Turnout | 2,292 | 39.7 | |||
Liberal Democrat hold | Swing |
Party | Candidate | Votes | % | ± | |
---|---|---|---|---|---|
Liberal Democrat | Kevin Wilkins | 1,157 | 45.5 | −1.2 | |
Conservative | Michael Morley | 522 | 20.5 | +3.0 | |
Green | Alexandra Collis | 459 | 18.1 | +6.4 | |
Labour | Michael Sargeant | 394 | 15.5 | −8.6 | |
Rejected ballots | 10 | 0.4 | {{{change}}} | ||
Turnout | 2,542 | 41.2 | |||
Liberal Democrat hold | Swing |
Party | Candidate | Votes | % | ± | |
---|---|---|---|---|---|
Conservative | David Brown | 1,321 | 47.0 | +2.9 | |
Liberal Democrat | Hazel Williams | 1,290 | 45.9 | −10.0 | |
Labour | Sandra Wilson | 165 | 5.9 | N/A | |
Rejected ballots | 31 | 1.1 | {{{change}}} | ||
Turnout | 2,808 | 44.7 | |||
Conservative gain from Liberal Democrat | Swing | ||||
Party | Candidate | Votes | % | ± | |
---|---|---|---|---|---|
Liberal Democrat | Nigel Bell | 1,414 | 46.4 | −13.2 | |
Conservative | David Ambrose-Smith | 1,355 | 44.5 | +4.1 | |
Labour | Robin Hay | 233 | 7.6 | N/A | |
Rejected ballots | 43 | 1.4 | {{{change}}} | ||
Turnout | 3,047 | 38.0 | |||
Liberal Democrat hold | Swing |
Party | Candidate | Votes | % | ± | |
---|---|---|---|---|---|
Liberal Democrat | Sue Austen | 1,374 | 51.1 | −5.1 | |
Conservative | Anna Bailey | 1,115 | 41.5 | −2.3 | |
Labour | Michele Wilkinson | 153 | 5.7 | N/A | |
Rejected ballots | 40 | 1.5 | {{{change}}} | ||
Turnout | 2,688 | 42.6 | |||
Liberal Democrat hold | Swing |
Party | Candidate | Votes | % | ± | |
---|---|---|---|---|---|
Conservative | Bill Hunt | 1,642 | 50.1 | +9.5 | |
Liberal Democrat | Gareth Wilson | 1,427 | 44.1 | +7.1 | |
Labour | Christopher Wilson | 131 | 4.1 | −10.6 | |
Rejected ballots | 28 | 0.9 | {{{change}}} | ||
Turnout | 3,233 | 42.9 | |||
Conservative hold | Swing |
Party | Candidate | Votes | % | ± | |
---|---|---|---|---|---|
Conservative | Fred Brown | 926 | 53.4 | +8.6 | |
Liberal Democrat | Aaron Broadley | 647 | 37.3 | −17.9 | |
Labour | Edna Simms | 134 | 7.7 | N/A | |
Rejected ballots | 27 | 1.6 | {{{change}}} | ||
Turnout | 1,734 | 28.7 | |||
Conservative gain from Liberal Democrat | Swing | ||||
Party | Candidate | Votes | % | ± | |
---|---|---|---|---|---|
Conservative | James Palmer | 2,331 | 31.6 | +8.2 | |
Conservative | John Powley | 1,919 | 26.0 | +0.9 | |
Liberal Democrat | Charles Warner | 1,347 | 18.3 | −9.6 | |
Liberal Democrat | Michael Allan | 1,238 | 16.8 | −6.9 | |
Labour | Jessica Blair | 280 | 3.8 | N/A | |
Labour | Kerry Murphy | 257 | 3.5 | N/A | |
Rejected ballots | 77 | 1.9 | {{{change}}} | ||
Turnout | 4,047 | 31.95 | |||
Conservative gain from Liberal Democrat | Swing | ||||
Conservative hold | Swing |
Party | Candidate | Votes | % | ± | |
---|---|---|---|---|---|
Conservative | Philip Read | 1,131 | 45.3 | +1.0 | |
Liberal Democrat | Ian Dewar | 593 | 23.7 | −33.1 | |
Independent | Owen Winters | 584 | 23.4 | N/A | |
Labour | Peter Allenson | 178 | 7.1 | N/A | |
Rejected ballots | 14 | 0.6 | {{{change}}} | ||
Turnout | 2,498 | 38.9 | |||
Conservative gain from Liberal Democrat | Swing | ||||
Party | Candidate | Votes | % | ± | |
---|---|---|---|---|---|
Conservative | Mathew Shuter | 1,811 | 53.9 | +4.2 | |
Liberal Democrat | Christine Bryant | 1,288 | 38.3 | +5.3 | |
Labour | Steven O'Dell | 216 | 6.4 | −10.8 | |
Rejected ballots | 34 | 1.0 | {{{change}}} | ||
Turnout | 3,359 | 43.5 | |||
Conservative hold | Swing |
Party | Candidate | Votes | % | ± | |
---|---|---|---|---|---|
Conservative | Alan Melton | 1,140 | 49.3 | +3.3 | |
Liberal Democrat | Chris Howes | 975 | 42.2 | +14.8 | |
Labour | Max Kelly | 157 | 6.8 | −19.8 | |
Rejected ballots | 30 | 1.3 | {{{change}}} | ||
Turnout | 2,312 | 39.2 | |||
Conservative hold | Swing |
Party | Candidate | Votes | % | ± | |
---|---|---|---|---|---|
Conservative | Geoffrey Harper | 981 | 38.4 | −14.2 | |
Independent | Mark Archer | 767 | 30.0 | N/A | |
UKIP | Callum Duffy | 380 | 14.9 | N/A | |
Liberal Democrat | Roy Benford | 167 | 6.5 | −12.5 | |
Labour | Bill Ashby | 123 | 4.8 | −23.6 | |
UK First | Len Baynes | 117 | 4.6 | N/A | |
Rejected ballots | 24 | 0.9 | {{{change}}} | ||
Turnout | 2,556 | 36.8 | |||
Conservative hold | Swing |
Party | Candidate | Votes | % | ± | |
---|---|---|---|---|---|
Conservative | Fred Yeulett | 1,229 | 57.6 | +13.1 | |
Liberal Democrat | Heather Kinnear | 497 | 23.3 | +8.2 | |
Labour | Carol Jones | 372 | 17.4 | −15.2 | |
Rejected ballots | 37 | 1.7 | {{{change}}} | ||
Turnout | 2,135 | 33.9 | |||
Conservative hold | Swing |
Party | Candidate | Votes | % | ± | |
---|---|---|---|---|---|
Conservative | John West | 985 | 54.9 | +2.8 | |
Liberal Democrat | Christine Colbert | 538 | 29.9 | −17.9 | |
Labour | Harry Jones | 242 | 13.5 | N/A | |
Rejected ballots | 31 | 1.7 | {{{change}}} | ||
Turnout | 1,794 | 33.6 | |||
Conservative hold | Swing |
Party | Candidate | Votes | % | ± | |
---|---|---|---|---|---|
Conservative | John Clark | 1,175 | 53.3 | −4.3 | |
Independent | Reg Kemp | 560 | 25.4 | N/A | |
Liberal Democrat | Paul Adams | 277 | 12.6 | −29.8 | |
Labour | Joy Owen | 177 | 8.0 | N/A | |
Rejected ballots | 14 | 0.6 | {{{change}}} | ||
Turnout | 2,203 | 35.9 | |||
Conservative hold | Swing |
Party | Candidate | Votes | % | ± | |
---|---|---|---|---|---|
Conservative | Steve Tierney | 1,326 | 52.7 | −6.3 | |
UKIP | Christopher Schooling | 617 | 24.5 | N/A | |
Labour | Joan Diggle | 306 | 12.2 | N/A | |
Liberal Democrat | Frank Bellard | 254 | 10.1 | −30.9 | |
Rejected ballots | 12 | 0.5 | {{{change}}} | ||
Turnout | 2,516 | 36.9 | |||
Conservative hold | Swing |
Party | Candidate | Votes | % | ± | |
---|---|---|---|---|---|
Conservative | Jill Tuck | 936 | 40.2 | −18.6 | |
Liberal Democrat | Gavin Booth | 641 | 27.4 | −13.7 | |
Independent | Alan Burbridge | 394 | 16.9 | N/A | |
Green | Paul Carpenter | 197 | 8.5 | N/A | |
Labour | Dave Goode | 146 | 6.3 | N/A | |
Rejected ballots | 15 | 0.6 | {{{change}}} | ||
Turnout | 2,331 | 38.1 | |||
Conservative hold | Swing |
Party | Candidate | Votes | % | ± | |
---|---|---|---|---|---|
Conservative | Martin Curtis | 1,393 | 61.3 | +8.9 | |
Liberal Democrat | David Chapman | 499 | 21.9 | +9.4 | |
Labour | Jes Hibbert | 343 | 15.1 | −19.8 | |
Rejected ballots | 32 | 1.4 | {{{change}}} | ||
Turnout | 2,271 | 37.7 | |||
Conservative hold | Swing |
Party | Candidate | Votes | % | ± | |
---|---|---|---|---|---|
Conservative | Ralph Butcher | 1,444 | 66.1 | +8.3 | |
Liberal Democrat | Peter Ward | 487 | 22.3 | +7.5 | |
Labour | Aiden Hervey | 211 | 9.7 | −17.7 | |
Rejected ballots | 44 | 2.0 | {{{change}}} | ||
Turnout | 2,183 | 38.5 | |||
Conservative hold | Swing |
Party | Candidate | Votes | % | ± | |
---|---|---|---|---|---|
Conservative | Les Sims | 729 | 41.3 | −5.7 | |
UKIP | Paul Clapp | 537 | 30.4 | N/A | |
Labour | Barry Diggle | 271 | 15.4 | −19.8 | |
Liberal Democrat | Diane Baldry | 212 | 12.0 | −5.8 | |
Rejected ballots | 12 | 0.7 | {{{change}}} | ||
Turnout | 1,764 | 23.9 | |||
Conservative hold | Swing |
Party | Candidate | Votes | % | ± | |
---|---|---|---|---|---|
Conservative | Simon King | 930 | 46.3 | −7.4 | |
UKIP | William Schooling | 532 | 26.5 | +10.1 | |
Labour | Mark Plumb | 212 | 10.5 | N/A | |
Liberal Democrat | Verity Roscoe | 191 | 9.5 | −20.5 | |
Libertarian | Andrew Hunt | 140 | 6.9 | N/A | |
Rejected ballots | 6 | 0.3 | {{{change}}} | ||
Turnout | 2,010 | 31.1 | |||
Conservative hold | Swing |
Party | Candidate | Votes | % | ± | |
---|---|---|---|---|---|
Liberal Democrat | Peter Downes | 2,207 | 58.8 | +10.5 | |
Conservative | Philip Norton | 1,418 | 37.8 | −5.3 | |
Labour | Marion Kadewere | 83 | 2.2 | −6.5 | |
Rejected ballots | 43 | 1.1 | {{{change}}} | ||
Turnout | 3,756 | 51.5 | |||
Liberal Democrat hold | Swing |
Party | Candidate | Votes | % | ± | |
---|---|---|---|---|---|
Conservative | Richard West | 1,657 | 55.9 | +8.3 | |
Liberal Democrat | William Clough | 1,162 | 39.3 | +10.2 | |
Labour | Sybil Tuckwood | 117 | 3.9 | −6.1 | |
Rejected ballots | 23 | 0.8 | {{{change}}} | ||
Turnout | 2,959 | 47.9 | |||
Conservative hold | Swing |
Party | Candidate | Votes | % | ± | |
---|---|---|---|---|---|
Liberal Democrat | Graham Wilson | 2,232 | 23.9 | +5.4 | |
Conservative | Jeffery Dutton | 2,223 | 23.8 | −0.2 | |
Conservative | Colin Hyams | 2,197 | 23.4 | +1.6 | |
Liberal Democrat | Michael Shellens | 2,105 | 22.5 | +6.8 | |
Labour | Ruth Pugh | 327 | 3.5 | −6.5 | |
Labour | Patrick Kadewere | 272 | 2.9 | −7.1 | |
Rejected ballots | 59 | 1.2 | {{{change}}} | ||
Turnout | 4,920 | 43.1 | |||
Liberal Democrat gain from Conservative | Swing | ||||
Conservative hold | Swing |
Party | Candidate | Votes | % | ± | |
---|---|---|---|---|---|
Conservative | Peter Brown | 1,922 | 28.6 | +2.8 | |
Conservative | Elaine Kadic | 1,572 | 23.4 | +1.9 | |
Liberal Democrat | Michael Burrell | 908 | 13.5 | +0.9 | |
Liberal Democrat | John Morgan | 835 | 12.4 | +1.2 | |
Green | John Clare | 606 | 9.0 | N/A | |
Labour | Ann Beevor | 466 | 6.9 | −5.2 | |
Labour | David King | 400 | 5.9 | −4.3 | |
Rejected ballots | 39 | 1.0 | {{{change}}} | ||
Turnout | 3,712 | 33.3 | |||
Conservative hold | Swing | ||||
Conservative hold | Swing |
Party | Candidate | Votes | % | ± | |
---|---|---|---|---|---|
Conservative | Kenneth Churchill | 2,573 | 29.8 | +5.7 | |
Conservative | David Harty | 2,451 | 28.4 | +2.4 | |
Liberal Democrat | Robert Eaton | 1,228 | 14.2 | −3.0 | |
Liberal Democrat | Gordon Thorpe | 1,052 | 12.2 | −2.3 | |
Green | Sarah Boulton | 834 | 9.7 | N/A | |
Labour | Graham Hitchings | 280 | 3.2 | −5.9 | |
Labour | John Watson | 217 | 2.5 | −6.4 | |
Rejected ballots | 45 | 0.9 | {{{change}}} | ||
Turnout | 4,751 | 38.3 | |||
Conservative hold | Swing | ||||
Conservative hold | Swing |
Party | Candidate | Votes | % | ± | |
---|---|---|---|---|---|
Conservative | Nicholas Guyatt | 2,159 | 29.1 | +5.5 | |
Conservative | Lawrence McGuire | 2,068 | 27.8 | +1.7 | |
UKIP | Gary Shaw | 1,135 | 15.3 | N/A | |
Liberal Democrat | Michael Black | 679 | 9.1 | −3.9 | |
Liberal Democrat | Patricia Shrapnel | 612 | 8.2 | −1.8 | |
Labour | Graeme Watkins | 419 | 5.6 | −6.3 | |
Labour | Chris Gudgin | 359 | 4.8 | −10.4 | |
Rejected ballots | 27 | 0.6 | {{{change}}} | ||
Turnout | 4,178 | 33.8 | |||
Conservative hold | Swing | ||||
Conservative hold | Swing |
Party | Candidate | Votes | % | ± | |
---|---|---|---|---|---|
UKIP | Peter Reeve | 865 | 44.8 | N/A | |
Conservative | Susan Normington | 682 | 35.4 | −10.9 | |
Liberal Democrat | Anthony Hulme | 308 | 15.9 | −21.7 | |
Labour | Susan Coomey | 53 | 2.7 | −13.3 | |
Rejected ballots | 21 | 1.1 | {{{change}}} | ||
Turnout | 1,929 | 30.2 | |||
UKIP gain from Conservative | Swing | ||||
Party | Candidate | Votes | % | ± | |
---|---|---|---|---|---|
Conservative | Vivienne McGuire | 1,735 | 55.4 | −2.7 | |
UKIP | Dilys Marvin | 621 | 19.8 | N/A | |
Liberal Democrat | David Cutter | 586 | 18.7 | −6.2 | |
Labour | Kevin Goddard | 171 | 5.5 | −11.5 | |
Rejected ballots | 17 | 0.5 | {{{change}}} | ||
Turnout | 3,130 | 42.9 | |||
Conservative hold | Swing |
Party | Candidate | Votes | % | ± | |
---|---|---|---|---|---|
Conservative | Stephen Criswell | 1,974 | 62.6 | +13.4 | |
Liberal Democrat | Leona Graham-Elen | 540 | 17.1 | −20.3 | |
UKIP | Michael Horwood | 475 | 15.1 | N/A | |
Labour | Mary Howell | 139 | 4.4 | −8.9 | |
Rejected ballots | 24 | 0.8 | {{{change}}} | ||
Turnout | 3,153 | 43.2 | |||
Conservative hold | Swing |
Party | Candidate | Votes | % | ± | |
---|---|---|---|---|---|
Conservative | Kevin Reynolds | 2,553 | 28.1 | +4.3 | |
Conservative | Dennis Pegram | 2,307 | 25.4 | +4.9 | |
Liberal Democrat | David Hodge | 1,543 | 16.9 | −0.1 | |
Liberal Democrat | Robin Waters | 1,412 | 15.5 | −0.2 | |
Monster Raving Loony | Lord Toby Jug | 566 | 6.2 | N/A | |
Labour | Richard Allen | 362 | 3.9 | −4.7 | |
Labour | Angela Richards | 343 | 3.8 | −3.8 | |
Rejected ballots | 42 | 0.8 | {{{change}}} | ||
Turnout | 4,976 | 34.9 | |||
Conservative hold | Swing | ||||
Conservative hold | Swing |
Party | Candidate | Votes | % | ± | |
---|---|---|---|---|---|
Conservative | Rodney Farrer | 1,699 | 25.6 | +5.7 | |
Conservative | Catherine Hodgson Hutton | 1,642 | 24.7 | +7.9 | |
Liberal Democrat | Julia Hayward | 1,443 | 21.7 | +0.9 | |
Liberal Democrat | Martin Land | 1,305 | 19.7 | +1.9 | |
Labour | Christine Ellarby | 275 | 4.1 | −9.1 | |
Labour | William O'Connor | 273 | 4.1 | −7.5 | |
Rejected ballots | 77 | 2.1 | {{{change}}} | ||
Turnout | 3,675 | 31.2 | |||
Conservative hold | Swing | ||||
Conservative gain from Liberal Democrat | Swing | ||||
Party | Candidate | Votes | % | ± | |
---|---|---|---|---|---|
Conservative | Ian Bates | 1,945 | 65.1 | +12.3 | |
Liberal Democrat | Colin Saunderson | 806 | 26.9 | −6.7 | |
Labour | Carole Hitchings | 194 | 6.5 | −6.9 | |
Rejected ballots | 37 | 1.2 | {{{change}}} | ||
Turnout | 2,987 | 42.2 | |||
Conservative hold | Swing |
Party | Candidate | Votes | % | ± | |
---|---|---|---|---|---|
Conservative | Victor Lucas | 1,408 | 49.8 | −5.5 | |
UKIP | Robert Brown | 803 | 28.4 | N/A | |
Liberal Democrat | Robert Johnson | 504 | 17.8 | −14.6 | |
Labour | Margaret Cochrane | 98 | 3.5 | −8.8 | |
Rejected ballots | 10 | 0.4 | {{{change}}} | ||
Turnout | 2,826 | 39.0 | |||
Conservative hold | Swing |
Party | Candidate | Votes | % | ± | |
---|---|---|---|---|---|
Conservative | John Reynolds | 1,866 | 55.4 | +9.5 | |
Liberal Democrat | Brian Bromwich | 540 | 16.0 | −20.5 | |
UKIP | Helen Davies-Green | 340 | 10.1 | N/A | |
Green | Teal Riley | 320 | 9.5 | N/A | |
Labour | Christopher Jones | 284 | 8.4 | −9.2 | |
Rejected ballots | 17 | 0.5 | {{{change}}} | ||
Turnout | 3,370 | 46.3 | |||
Conservative hold | Swing |
Party | Candidate | Votes | % | ± | |
---|---|---|---|---|---|
Conservative | Linda Oliver | 1,363 | 57.3 | +2.9 | |
Green | Simon Saggers | 523 | 22.0 | +3.4 | |
Liberal Democrat | Ashley Woodford | 262 | 11.0 | −15.9 | |
Labour | Gabriele Falcini | 203 | 8.5 | N/A | |
Rejected ballots | 19 | 0.8 | {{{change}}} | ||
Turnout | 2,377 | 44.5 | |||
Conservative hold | Swing |
Party | Candidate | Votes | % | ± | |
---|---|---|---|---|---|
Conservative | Lister Wilson | 897 | 48.7 | +3.4 | |
Liberal Democrat | Jon Hansford | 672 | 36.5 | +3.9 | |
Labour | Mark Hurn | 251 | 13.6 | −2.7 | |
Rejected ballots | 23 | 1.2 | {{{change}}} | ||
Turnout | 1,842 | 35.6 | |||
Conservative hold | Swing |
Party | Candidate | Votes | % | ± | |
---|---|---|---|---|---|
Liberal Democrat | David Jenkins | 2,419 | 23.7 | +2.8 | |
Liberal Democrat | Susan Gymer | 2,202 | 21.6 | +6.1 | |
Conservative | Matthew Bradney | 2,168 | 21.2 | −0.1 | |
Conservative | Simon Edwards | 2,074 | 20.3 | +2.6 | |
Green | Jenny Butler | 698 | 6.8 | +0.6 | |
Labour | Val Ross | 363 | 3.6 | −5.9 | |
Labour | Niamh Sweeney | 281 | 2.8 | −6.1 | |
Rejected ballots | 32 | 0.6 | {{{change}}} | ||
Turnout | 5,516 | 42.8 | |||
Liberal Democrat gain from Conservative | Swing | ||||
Liberal Democrat hold | Swing |
Party | Candidate | Votes | % | ± | |
---|---|---|---|---|---|
Liberal Democrat | Timothy Stone | 1,735 | 51.2 | +7.3 | |
Conservative | James Hoskins | 1,195 | 35.3 | −7.8 | |
Independent | James Quinlan | 280 | 8.3 | N/A | |
Labour | Lucy Howson | 150 | 4.4 | −8.6 | |
Rejected ballots | 24 | 0.7 | {{{change}}} | ||
Turnout | 3,388 | 49.9 | |||
Liberal Democrat hold | Swing |
Party | Candidate | Votes | % | ± | |
---|---|---|---|---|---|
Conservative | Nick Clarke | 1,064 | 35.4 | −7.8 | |
Independent | Neil Scarr | 906 | 30.1 | N/A | |
Liberal Democrat | John Williams | 785 | 26.1 | −15.5 | |
Labour | Josephine Teague | 235 | 7.8 | N/A | |
Rejected ballots | 16 | 0.5 | {{{change}}} | ||
Turnout | 3,005 | 40.1 | |||
Conservative hold | Swing |
Party | Candidate | Votes | % | ± | |
---|---|---|---|---|---|
Liberal Democrat | Sebastian Kindersley | 2,089 | 56.8 | +11.7 | |
Conservative | Helen Rees | 1,351 | 36.7 | −0.2 | |
Labour | Valerie Brooker | 192 | 5.2 | −6.5 | |
Rejected ballots | 47 | 1.3 | {{{change}}} | ||
Turnout | 3,678 | 47.3 | |||
Liberal Democrat hold | Swing |
Party | Candidate | Votes | % | ± | |
---|---|---|---|---|---|
Liberal Democrat | Fiona Whelan | 1,881 | 54.1 | +18.8 | |
Conservative | Bill Hensley | 1,091 | 31.4 | −9.9 | |
Green | William Connolley | 323 | 9.3 | +0.9 | |
Labour | John Shepherd | 158 | 4.5 | −10.4 | |
Rejected ballots | 22 | 0.6 | {{{change}}} | ||
Turnout | 3,476 | 46.4 | |||
Liberal Democrat gain from Conservative | Swing | ||||
Party | Candidate | Votes | % | ± | |
---|---|---|---|---|---|
Liberal Democrat | John Batchelor | 1,812 | 47.9 | +4.2 | |
Conservative | Roger Hickford | 1,737 | 45.9 | +7.4 | |
Labour | Shannon Revel | 195 | 5.2 | −8.1 | |
Rejected ballots | 39 | 1.0 | {{{change}}} | ||
Turnout | 3,782 | 52.9 | |||
Liberal Democrat hold | Swing |
Party | Candidate | Votes | % | ± | |
---|---|---|---|---|---|
Liberal Democrat | Susan Van de Ven | 1,717 | 49.6 | +12.2 | |
Conservative | David McCraith | 1,347 | 38.9 | −3.2 | |
Green | Sam Morris | 227 | 6.6 | +0.9 | |
Labour | Hywel Jackson | 155 | 4.5 | −10.4 | |
Rejected ballots | 16 | 0.5 | {{{change}}} | ||
Turnout | 3,462 | 48.9 | |||
Liberal Democrat gain from Conservative | Swing | ||||
Party | Candidate | Votes | % | ± | |
---|---|---|---|---|---|
Conservative | Mandy Smith | 1,601 | 63.4 | +10.9 | |
Liberal Democrat | Peter Fane | 684 | 27.1 | −20.4 | |
Labour | Mumtaz Khan | 213 | 8.4 | N/A | |
Rejected ballots | 28 | 1.1 | {{{change}}} | ||
Turnout | 2,526 | 43.6 | |||
Conservative hold | Swing |
Party | Candidate | Votes | % | ± | |
---|---|---|---|---|---|
Conservative | Tony Orgee | 2,584 | 27.3 | +7.4 | |
Conservative | Gail Kenney | 2,501 | 26.4 | +6.3 | |
Liberal Democrat | Michael Kilpatrick | 1,782 | 18.8 | +0.9 | |
Green | Linda Whitebread | 1,464 | 15.5 | +10.1 | |
Labour | Mike Nettleton | 672 | 7.1 | −2.6 | |
Labour | Marie Baker | 459 | 4.9 | −4.5 | |
Rejected ballots | 27 | 0.5 | {{{change}}} | ||
Turnout | 5,355 | 41.79 | |||
Conservative hold | Swing | ||||
Conservative hold | Swing |
Party | Candidate | Votes | % | ± | |
---|---|---|---|---|---|
Liberal Democrat | Michael Williamson | 1,618 | 51.9 | −9.2 | |
Conservative | Peter Johnson | 1,325 | 42.5 | +3.7 | |
Labour | Godson Lawal | 152 | 4.9 | N/A | |
Rejected ballots | 35 | 1.1 | {{{change}}} | ||
Turnout | 3,114 | 44.7 | |||
Liberal Democrat hold | Swing |
Party | Candidate | Votes | % | ± | |
---|---|---|---|---|---|
Conservative | Shona Johnstone | 1,485 | 56.5 | +9.9 | |
Liberal Democrat | Rob Falla | 888 | 33.8 | −8.5 | |
Labour | Charlie Wilson | 185 | 7.0 | N/A | |
Rejected ballots | 52 | 1.9 | {{{change}}} | ||
Turnout | 2,627 | 37.1 | |||
Conservative hold | Swing |
Elections to Suffolk County Council were held on 4 June 2009 as part of the 2009 United Kingdom local elections on the same day as the elections to the European Parliament. 75 councillors were elected from 63 electoral divisions, which returned either one or two county councillors each by first-past-the-post voting for a four-year term of office. The electoral divisions were the same as those used at the previous election in 2004.
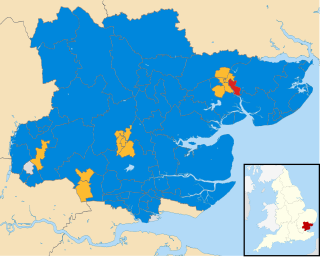
An election to Essex County Council took place on 4 June 2009 as part of the United Kingdom local elections, 2009. The elections had been delayed from 7 May, to coincide with elections to the European Parliament. 75 councillors were elected from various electoral divisions, which returned either one or two county councillors each by first-past-the-post voting for a four-year term of office. The electoral divisions were the same as those used at the previous election in 2005.
Elections to Gloucestershire County Council took place on 4 June 2009 as part of the United Kingdom local elections, 2009, having been delayed from 7 May, to coincide with elections to the European Parliament. All of the Council's 62 seats were up for election. Most divisions returned one County Councillor under the first past the post system which is used for most local government elections in England and Wales. However, some divisions especially those that were based upon towns too small for two divisions but too large for one returned two Councillors using the block vote variant of FPTP used for some English and Welsh local elections.
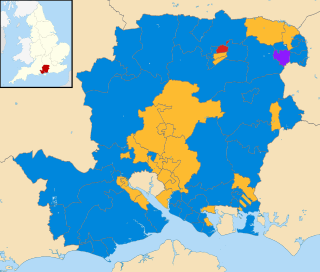
An election to Hampshire County Council took place on 4 June 2009 as part of the United Kingdom local elections, 2009, having been delayed from 7 May, to coincide with elections to the European Parliament. 78 councillors were elected from 75 electoral divisions, which returned either one or two county councillors each by first-past-the-post voting for a four-year term of office. The electoral divisions were the same as those used at the previous election in 2005. Elections in Portsmouth and Southampton do not coincide with this set, being unitary authorities outside the area covered by the County Council.
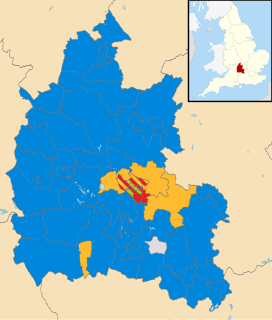
An election to Oxfordshire County Council took place on 4 June 2009 as part of the United Kingdom local elections, 2009, having been delayed from 7 May, to coincide with elections to the European Parliament. 73 councillors were elected from various electoral divisions, which returned either one, two or three county councillors each by first-past-the-post voting for a four-year term of office. The electoral divisions were the same as those used at the previous election in 2005.
An election to Somerset County Council took place on 4 June 2009 as part of the United Kingdom local elections, 2009, having been delayed from 7 May, to coincide with elections to the European Parliament. The result brought to an end 16 years of Liberal Democrat rule to a Conservative controlled administration. 58 councillors were elected from various electoral divisions, which returned one county councillor each. Members were elected by the first-past-the-post voting system for a four-year term of office. This was the last election before the number of seats was cut to 55 for the 2013 election. With a total of 58 seats being reduced to 55 for the next election.
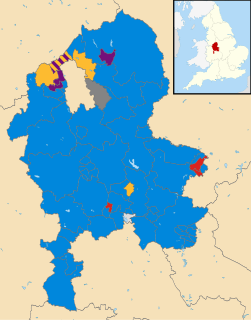
Elections to Staffordshire County Council took place on 4 June 2009 as part of the United Kingdom local elections, 2009, having been delayed from 7 May, in order to coincide with elections to the European Parliament. 62 councillors were elected from the various electoral divisions, which returned either one or two county councillors each by first-past-the-post voting for a four-year term of office. The electoral divisions were the same as those used at the previous election in 2005. The council continues to be administered on the Leader and Cabinet model.
The 2012 City of Lincoln Council election took place on 3 May 2012 to elect one-third of the members of City of Lincoln Council in Lincolnshire, England, for a 4-year term of office. This was on the same day as other United Kingdom local elections, 2012.
An election to Cumbria County Council took place on 2 May013 as part of the United Kingdom local elections, 2013. All 84 councillors were elected from electoral divisions which returned one county councillor each by first-past-the-post voting for a four-year term of office. Following an electoral review carried out by the Local Government Boundary Commission for England, newly drawn electoral divisions were used without change in the number of county councillors.
An election to Leicestershire County Council took place on 2 May 2013 as part of the United Kingdom local elections, 2013. 55 councillors were elected from 52 electoral divisions, which returned either one or two county councillors each by first-past-the-post voting for a four-year term of office. The Conservatives held control of the council with a reduced majority of 5 seats. Despite a strong challenge from UKIP, the party only gained 2 seats whilst the Liberal Democrats lost one seat and Labour recouped some of their 2009 losses, gaining 6 seats.
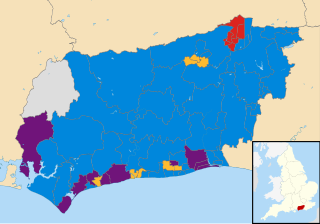
The West Sussex County Council election, 2013 took place on 2 May 2013, as part of the United Kingdom local elections, 2013. All 71 electoral divisions were up for election, which returned one county councillor each by first-past-the-post voting for a four-year term of office. At this election, the Conservative Party was seeking to retain overall control of the council, and the Liberal Democrats to maintain their position as the main opposition party.
An election to Hampshire County Council took place on 2 May 2013 as part of the United Kingdom local elections, 2013. 78 councillors were elected from 75 electoral divisions, which returned either one or two county councillors each by first-past-the-post voting for a four-year term of office. The electoral divisions were the same as those of the previous election in 2009. No elections were held in Portsmouth and Southampton, which are unitary authorities outside the area covered by the County Council. The election saw the Conservative Party retain overall control of the council, with a reduced majority of five councillors.
An election to Cambridgeshire County Council took place on 2 May 2013 as part of the United Kingdom local elections, 2013. 69 councillors were elected from 60 electoral divisions, which returned either one or two county councillors each by first-past-the-post voting for a four-year term of office. The electoral divisions were the same as those used at the previous election in 2009. No elections were held in Peterborough, which is a unitary authority outside the area covered by the County Council. The election saw the Conservative Party lose overall control of the council.
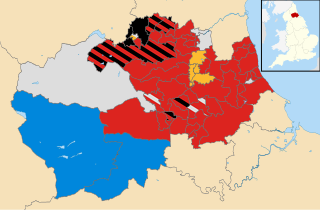
An election to Durham County Council took place on 2 May 2013 as part of the United Kingdom local elections, 2013. Following a boundary review, 126 councillors were elected from 63 electoral divisions which returned either one, two or three councillors each by first-past-the-post voting for a four-year term of office. The previous election took place in 2008 in advance of the council becoming a unitary authority after the 2009 changes to local government. The election saw the Labour Party increase their majority on the council.
An election to Worcestershire County Council took place on 2 May 2013 as part of the United Kingdom local elections, 2013. 57 councillors were elected from 53 electoral divisions, which returned either one or two county councillors each by first-past-the-post voting for a four-year term of office. The divisions were the same as those used at the previous election in 2009. The election saw the Conservative Party retain overall control of the council with a significantly reduced majority of just 2 seats.
An election to Lincolnshire County Council took place on 2 May 2013 as part of the United Kingdom local elections, 2013. 77 electoral divisions returned one county councillor each by first-past-the-post voting for a four-year term of office. The electoral divisions were the same as those used at the previous election in 2009. No elections were held in North Lincolnshire or North East Lincolnshire, which are unitary authorities outside the area covered by the County Council.
An election to Hertfordshire County Council took place on 2 May 2013 as part of the United Kingdom local elections, 2013. 77 electoral divisions elected one county councillor each by first-past-the-post voting for a four-year term of office. The electoral divisions were the same as those used at the previous election in 2009.
An election to Essex County Council took place on 2 May 2013 as part of the United Kingdom local elections, 2013. 75 councillors were elected from 70 electoral divisions, which returned either one or two county councillors each by first-past-the-post voting for a four-year term of office. The electoral divisions were the same as those used at the previous election in 2009. No elections were held in Thurrock or Southend-on-Sea, which are unitary authorities outside the area covered by the County Council.
An election to Staffordshire County Council took place on 2 May 2013 as part of the United Kingdom local elections, 2013. 62 electoral divisions returned one county councillor each by first-past-the-post voting for a four-year term of office. Following a boundary review, new electoral division boundaries were established for this election. No elections were held in Stoke-on-Trent, which is a unitary authority outside the area covered by the County Council. The council continues to be administered on the Leader and Cabinet model.
Elections to Suffolk County Council took place on 2 May 2013 as part of the United Kingdom local elections, 2013. 75 councillors were elected from 63 electoral divisions, which returned either one or two county councillors each by first-past-the-post voting for a four-year term of office. The electoral divisions were the same as those used at the previous election in 2009.