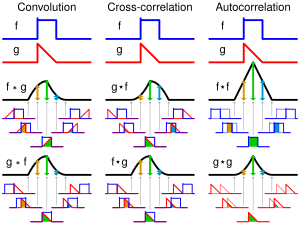
Autocorrelation, sometimes known as serial correlation in the discrete time case, is the correlation of a signal with a delayed copy of itself as a function of delay. Informally, it is the similarity between observations of a random variable as a function of the time lag between them. The analysis of autocorrelation is a mathematical tool for finding repeating patterns, such as the presence of a periodic signal obscured by noise, or identifying the missing fundamental frequency in a signal implied by its harmonic frequencies. It is often used in signal processing for analyzing functions or series of values, such as time domain signals.

In probability theory, the expected value is a generalization of the weighted average. Informally, the expected value is the arithmetic mean of the possible values a random variable can take, weighted by the probability of those outcomes. Since it is obtained through arithmetic, the expected value sometimes may not even be included in the sample data set; it is not the value you would "expect" to get in reality.
A random variable is a mathematical formalization of a quantity or object which depends on random events. The term 'random variable' in its mathematical definition refers to neither randomness nor variability but instead is a mathematical function in which
Independence is a fundamental notion in probability theory, as in statistics and the theory of stochastic processes. Two events are independent, statistically independent, or stochastically independent if, informally speaking, the occurrence of one does not affect the probability of occurrence of the other or, equivalently, does not affect the odds. Similarly, two random variables are independent if the realization of one does not affect the probability distribution of the other.

In signal processing, white noise is a random signal having equal intensity at different frequencies, giving it a constant power spectral density. The term is used with this or similar meanings in many scientific and technical disciplines, including physics, acoustical engineering, telecommunications, and statistical forecasting. White noise refers to a statistical model for signals and signal sources, rather than to any specific signal. White noise draws its name from white light, although light that appears white generally does not have a flat power spectral density over the visible band.
In probability theory and related fields, a stochastic or random process is a mathematical object usually defined as a sequence of random variables in a probability space, where the index of the sequence often has the interpretation of time. Stochastic processes are widely used as mathematical models of systems and phenomena that appear to vary in a random manner. Examples include the growth of a bacterial population, an electrical current fluctuating due to thermal noise, or the movement of a gas molecule. Stochastic processes have applications in many disciplines such as biology, chemistry, ecology, neuroscience, physics, image processing, signal processing, control theory, information theory, computer science, and telecommunications. Furthermore, seemingly random changes in financial markets have motivated the extensive use of stochastic processes in finance.
In probability, and statistics, a multivariate random variable or random vector is a list or vector of mathematical variables each of whose value is unknown, either because the value has not yet occurred or because there is imperfect knowledge of its value. The individual variables in a random vector are grouped together because they are all part of a single mathematical system — often they represent different properties of an individual statistical unit. For example, while a given person has a specific age, height and weight, the representation of these features of an unspecified person from within a group would be a random vector. Normally each element of a random vector is a real number.

In statistics, correlation or dependence is any statistical relationship, whether causal or not, between two random variables or bivariate data. Although in the broadest sense, "correlation" may indicate any type of association, in statistics it usually refers to the degree to which a pair of variables are linearly related. Familiar examples of dependent phenomena include the correlation between the height of parents and their offspring, and the correlation between the price of a good and the quantity the consumers are willing to purchase, as it is depicted in the so-called demand curve.

In probability theory and statistics, a covariance matrix is a square matrix giving the covariance between each pair of elements of a given random vector.

In statistics, the Pearson correlation coefficient (PCC) is a correlation coefficient that measures linear correlation between two sets of data. It is the ratio between the covariance of two variables and the product of their standard deviations; thus, it is essentially a normalized measurement of the covariance, such that the result always has a value between −1 and 1. As with covariance itself, the measure can only reflect a linear correlation of variables, and ignores many other types of relationships or correlations. As a simple example, one would expect the age and height of a sample of teenagers from a high school to have a Pearson correlation coefficient significantly greater than 0, but less than 1.
The cross-correlation matrix of two random vectors is a matrix containing as elements the cross-correlations of all pairs of elements of the random vectors. The cross-correlation matrix is used in various digital signal processing algorithms.
In probability theory and statistics, a Gaussian process is a stochastic process, such that every finite collection of those random variables has a multivariate normal distribution. The distribution of a Gaussian process is the joint distribution of all those random variables, and as such, it is a distribution over functions with a continuous domain, e.g. time or space.

In signal processing, cross-correlation is a measure of similarity of two series as a function of the displacement of one relative to the other. This is also known as a sliding dot product or sliding inner-product. It is commonly used for searching a long signal for a shorter, known feature. It has applications in pattern recognition, single particle analysis, electron tomography, averaging, cryptanalysis, and neurophysiology. The cross-correlation is similar in nature to the convolution of two functions. In an autocorrelation, which is the cross-correlation of a signal with itself, there will always be a peak at a lag of zero, and its size will be the signal energy.
In probability theory, linear uncorrelatedness of two random variables does not in general imply their independence, but it is sometimes mistakenly thought that it does imply that when the two random variables are normally distributed. The assumption of normal distributions for the random variables does not have that consequence, although the multivariate normal distribution, including the bivariate normal distribution, does.
In probability theory and statistics, the mathematical concepts of covariance and correlation are very similar. Both describe the degree to which two random variables or sets of random variables tend to deviate from their expected values in similar ways.
In statistics, an exchangeable sequence of random variables is a sequence X1, X2, X3, ... whose joint probability distribution does not change when the positions in the sequence in which finitely many of them appear are altered. In other words, the joint distribution is invariant to finite permutation. Thus, for example the sequences
In probability theory and statistics, partial correlation measures the degree of association between two random variables, with the effect of a set of controlling random variables removed. When determining the numerical relationship between two variables of interest, using their correlation coefficient will give misleading results if there is another confounding variable that is numerically related to both variables of interest. This misleading information can be avoided by controlling for the confounding variable, which is done by computing the partial correlation coefficient. This is precisely the motivation for including other right-side variables in a multiple regression; but while multiple regression gives unbiased results for the effect size, it does not give a numerical value of a measure of the strength of the relationship between the two variables of interest.
In probability theory and statistics, the covariance function describes how much two random variables change together (their covariance) with varying spatial or temporal separation. For a random field or stochastic process Z(x) on a domain D, a covariance function C(x, y) gives the covariance of the values of the random field at the two locations x and y:
The partition function or configuration integral, as used in probability theory, information theory and dynamical systems, is a generalization of the definition of a partition function in statistical mechanics. It is a special case of a normalizing constant in probability theory, for the Boltzmann distribution. The partition function occurs in many problems of probability theory because, in situations where there is a natural symmetry, its associated probability measure, the Gibbs measure, has the Markov property. This means that the partition function occurs not only in physical systems with translation symmetry, but also in such varied settings as neural networks, and applications such as genomics, corpus linguistics and artificial intelligence, which employ Markov networks, and Markov logic networks. The Gibbs measure is also the unique measure that has the property of maximizing the entropy for a fixed expectation value of the energy; this underlies the appearance of the partition function in maximum entropy methods and the algorithms derived therefrom.
In quantum physics, a quantum state is a mathematical entity that embodies the knowledge of a quantum system. Quantum mechanics specifies the construction, evolution, and measurement of a quantum state. The result is a quantum-mechanical prediction for the system represented by the state. Knowledge of the quantum state, and the quantum mechanical rules for the system's evolution in time, exhausts all that can be known about a quantum system.