The United States is the third most populous country in the world, and the most populous in the Americas and the Western Hemisphere, with an estimated population of 340,110,988 on July 1, 2024, according to the U.S. Census Bureau. This was an increase of 2.6% over the 2020 federal census of 331,449,281 residents. These figures include the 50 states and the federal capital, Washington, D.C., but exclude the 3.6 million residents of five unincorporated U.S. territories as well as several minor uninhabited island possessions. The Census Bureau showed a population increase of 0.4% for the twelve-month period ending in July 2022, below the world estimated annual rate of 1.03%, in 2021. The total fertility rate (TFR) is around 1.84 children per woman as of 2024, which is below the replacement fertility rate of approximately 2.1. By several metrics, including racial and ethnic background, religious affiliation, and percentage of rural and urban divide, the state of Illinois is the most representative of the larger demography of the United States.

Mexican Americans are Americans of full or partial Mexican descent. In 2022, Mexican Americans comprised 11.2% of the US population and 58.9% of all Hispanic and Latino Americans. In 2019, 71% of Mexican Americans were born in the United States. Mexicans born outside the US make up 53% of the total population of foreign-born Hispanic Americans and 25% of the total foreign-born population. Chicano is a term used by some to describe the unique identity held by Mexican-Americans. The United States is home to the second-largest Mexican community in the world, behind only Mexico.

The demographics of Chicago show that it is a very large, and ethnically and culturally diverse metropolis. It is the third largest city and metropolitan area in the United States by population. Chicago was home to over 2.7 million people in 2020, accounting for over 25% of the population in the Chicago metropolitan area, home to approximately 9.6 million.
The 2010 census estimated Alabama's population at 4,802,740, an increase of 332,636 or 7.5% since 2000. This includes a natural increase of 87,818 and a net migration of 73,178 people into the state. Immigration from outside the United States resulted in a net increase of 30,537 and migration within the country produced a net increase of 42,641.

White Americans are Americans who identify as white people. In a more official sense, the United States Census Bureau, which collects demographic data on Americans, defines "white" as "[a] person having origins in any of the original peoples of Europe, the Middle East, or North Africa". This group constitutes the majority of the people in the United States. According to the 2020 census, 71%, or 235,411,507 people, were White alone or in combination, and 61.6%, or 204,277,273 people, were White alone. This represented a national white demographic decline from a 72.4% white alone share of the US population in 2010.
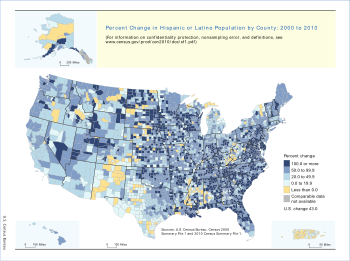
The United States has a racially and ethnically diverse population. At the federal level, race and ethnicity have been categorized separately. The most recent United States census recognized five racial categories, as well as people who belong to two or more of the racial categories. The United States also recognizes the broader notion of ethnicity. The 2000 census and 2010 American Community Survey inquired about the "ancestry" of residents, while the 2020 census allowed people to enter their "origins". The Census Bureau also classified respondents as either Hispanic or Latino, identifying as an ethnicity, which comprises the minority group in the nation.

At the 2010 census, there were 1,526,006 people, 590,071 households, and 352,272 families residing in the consolidated city-county of Philadelphia, Pennsylvania. The population density was 4,337.3 people/km2. There were 661,958 housing units at an average density of 1,891.9 units/km2.
The demographics of the Bronx are characterized by a Hispanic majority and by the lowest percentage of Whites among all boroughs.

Stateside Puerto Ricans, also ambiguously known as Puerto Rican Americans, or Puerto Ricans in the United States, are Puerto Ricans who are in the United States proper of the 50 states and the District of Columbia who were born in or trace any family ancestry to the unincorporated US territory of Puerto Rico.
According to the U.S. Census Bureau, as of 2023, Texas was the second largest state in population after California, with a population of 30,503,301, an increase of more than 1.3 million people, or 4.7%, since the 29,145,505 of the 2020 census. Its apportioned population in 2020 was 29,183,290. Since the beginning of the 21st century, the state of Texas has experienced strong population growth. Texas has many major cities and metropolitan areas, along with many towns and rural areas. Much of the population is concentrated in the major cities of Dallas–Fort Worth, Austin, San Antonio, Houston, McAllen, and El Paso and their corresponding metropolitan areas. The first four aforementioned main urban centers are also referred to as the Texas Triangle megaregion.
White Hispanic and Latino Americans, also called Euro-Hispanics, Euro-Latinos, White Hispanics, or White Latinos, are Americans of white ancestry and ancestry from Latin America. It also refers to people of European ancestry from Latin America that speak Spanish or Portuguese natively and immigrated to the United States.
Black Hispanic and Latino Americans, also called Afro-Hispanics, Afro-Latinos, Black Hispanics, or Black Latinos, are classified by the United States Census Bureau, Office of Management and Budget, and other U.S. government agencies as Black people living in the United States with ancestry in Latin America or Spain and/or who speak Spanish and/or Portuguese as either their first language or second language.
The District of Columbia is a federal district with an ethnically diverse population. In 2020, the District had a population of 689,545 people, with a resident density of 11,515 people per square mile.
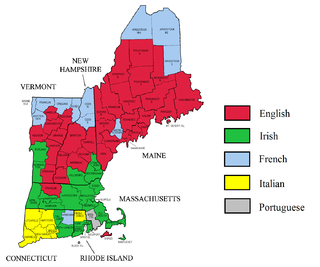
According to the 2018 American Community Survey, New England had an estimated population of 14,853,290, of which 48.7% were male and 51.3% were female. Approximately 19.7% of the population were under 18 years of age; 17.4% were 65 years of age or over.
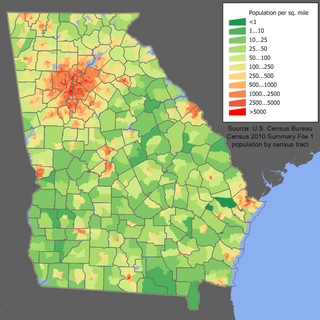
Georgia is a South Atlantic U.S. state with a population of 10,711,908 according to the 2020 United States census, or just over 3% of the U.S. population. The majority of the state's population is concentrated within Metro Atlanta, although other highly populated regions include: West Central and East Central Georgia; West, Central, and East Georgia; and Coastal Georgia; and their Athens, Columbus, Macon and Warner Robins, Augusta, Savannah, Hinesville, and Brunswick metropolitan statistical areas.

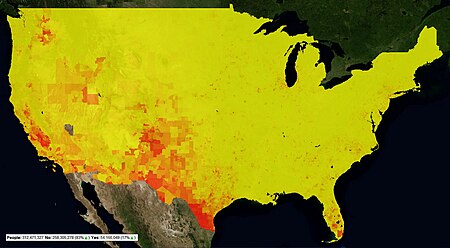
Non-Hispanic Whites or Non-Latino Whites are White Americans classified by the United States census as "white" and not Hispanic. According to the United States Census Bureau yearly estimates, as of July 1, 2023, Non-Hispanic whites make up about 58.4% of the U.S. population. The White non-Hispanic population remained the largest racial or ethnic group in the United States according to the 2020 census data, accounting for 57.8% of the population, a decline from 63.7% in the 2010 census. The United States Census Bureau defines white to include European Americans, Middle Eastern Americans, and North African Americans. Americans of European ancestry are divided into various ethnic groups. More than half of the white population are German, Irish, English, Italian, French and Polish Americans. Many Americans are also the product of other European groups that migrated to parts of the US in the 19th and 20th centuries, as the bulk of immigrants from various countries in Northern, Central, Eastern, and Southeastern Europe, as well as the Caucasus region, migrated to the United States.
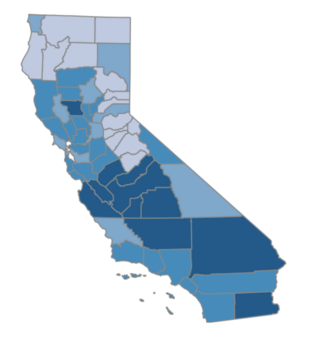
Hispanic and Latino Californians are residents of the state of California who are of full or partial Hispanic or Latino ancestry. As of the 2020 U.S. Census, Hispanics and Latinos of any race were 39.4% of the state's population, making it the largest ethnicity in California.
The Commonwealth of Massachusetts is home to a large number of Hispanic and Latino residents. As of the 2020 Census, Hispanics and Latinos accounted for 12% of the total state's population

The 2020 United States Census reported that San Francisco had a population of 873,965—an increase from the 2010 Census count of 805,235. The 2022 Census Bureau American Community Survey put the population at 808,437: a decrease of 65,528 from 2020. With a population density of 18,633 per square mile (7,194/km2), San Francisco is the second-most densely populated major American city, behind only New York.