
According to the 2021 Canadian census, over 450 "ethnic or cultural origins" were self-reported by Canadians. The major panethnic origin groups in Canada are: European (52.5%), North American (22.9%), Asian (19.3%), North American Indigenous (6.1%), African (3.8%), Latin, Central and South American (2.5%), Caribbean (2.1%), Oceanian (0.3%), and Other (6%). Statistics Canada reports that 35.5% of the population reported multiple ethnic origins, thus the overall total is greater than 100%.
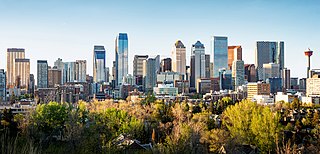
The Calgary Metropolitan Region (CMR), also commonly referred to as the Calgary Region, is a conglomeration of municipalities centred on Calgary, the largest city in Alberta.

The Municipality of the District of Lunenburg, is a district municipality in Lunenburg County, Nova Scotia, Canada. Statistics Canada classifies the district municipality as a municipal district.

North Cowichan is a district municipality established in 1873 on Vancouver Island, in British Columbia, Canada. The municipality is part of the Cowichan Valley Regional District. North Cowichan is noted for a landscape including forests, beaches, rivers, and lakes. The municipality encompasses the communities of Chemainus; Westholme; Crofton; Maple Bay; and "the South End". The latter is an informal name for a built-up area which is essentially a suburb of the City of Duncan, a separate municipality.

Greater Montreal is the most populous metropolitan area in Quebec and the second most populous in Canada after Greater Toronto. In 2015, Statistics Canada identified Montreal's Census Metropolitan Area (CMA) as 4,258.31 square kilometres (1,644.14 sq mi) with a population of 4,027,100, almost half that of the province.

The Winnipeg Metropolitan Region is a metropolitan area in the Canadian province of Manitoba located in the Red River Valley in the southeast portion of the province of Manitoba, Canada. It contains the provincial capital of Winnipeg and 17 surrounding rural municipalities, cities, and towns.

The Edmonton Metropolitan Region (EMR), also commonly referred to as Greater Edmonton or Metro Edmonton, is a conglomeration of municipalities centred on Alberta's provincial capital of Edmonton.
The demographics of Metro Vancouver indicate a multicultural and multiracial region. Metro Vancouver is a metropolitan area, with its major urban centre being Vancouver, British Columbia, Canada. The Vancouver census metropolitan area, as defined by Statistics Canada, encompasses roughly the same territory as the Metro Vancouver Regional District, a regional district in British Columbia. The regional district includes 23 local authorities. Figures provided here are for the Vancouver census metropolitan area and not for the City of Vancouver.

British Columbia is a Canadian province with a population of about 5.5 million people. The province represents about 13.2% of the population of the Canadian population. Most of the population is between the ages of 15 and 49. About 64% of British Columbians have European descent with significant Asian and Aboriginal minorities and just under 30% of British Columbians are immigrants. Over half of the population is irreligious, with Christianity and Sikhism being the most followed religions.

Ontario, one of the 13 provinces and territories of Canada, is located in east-central Canada. It is Canada's most populous province by a large margin, accounting for nearly 40 per cent of all Canadians, and is the second-largest province in total area. Ontario is fourth-largest in total area when the territories of the Northwest Territories and Nunavut are included. It is home to the nation's capital city, Ottawa, and the nation's most populous city, Toronto.

Alberta has experienced a relatively high rate of growth in recent years, due in large part to its economy. Between 2003 and 2004, the province saw high birthrates, relatively high immigration, and a high rate of interprovincial migration when compared to other provinces. Approximately 81% of the population live in urban areas and only about 19% live in rural areas. The Calgary–Edmonton Corridor is the most urbanized area in Alberta and is one of Canada's four most urban regions. Many of Alberta's cities and towns have also experienced high rates of growth in recent history. From a population of 73,022 in 1901, Alberta has grown to 3,645,257 in 2011 and in the process has gone from less than 1.5% of Canada's population to 10.9%. As of July 1, 2018, Alberta's population represented 11.6% of Canada's total population of 37,058,856 making it the fourth most populated province in Canada. According to the 2018 third quarter report, Alberta's population increased by 23,096 to 4,330,206, the largest increase since the 2014 economic downturn.
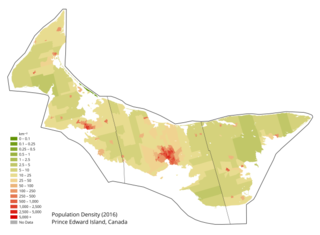
Demographics of the province of Prince Edward Island, Canada. According to the 2011 National Household Survey, the largest ethnic group consists of people of Scottish descent (39.2%), followed by English (31.1%), Irish (30.4%), French (21.1%), German (5.2%), and Dutch (3.1%) descent. Prince Edward Island is mostly a white community and there are few visible minorities. Chinese people are the largest visible minority group of Prince Edward Island, comprising 1.3% of the province's population. Almost half of respondents identified their ethnicity as "Canadian." Prince Edward Island is by a strong margin the most Celtic and specifically the most Scottish province in Canada and perhaps the most Scottish place (ethnically) in the world, outside Scotland. 38% of islanders claim Scottish ancestry, but this is an underestimate and it is thought that almost 50% of islanders have Scottish roots. When combined with Irish and Welsh, almost 80% of islanders are of some Celtic stock, albeit most families have resided in PEI for at least two centuries. Few places outside Europe can claim such a homogeneous Celtic ethnic background. The only other jurisdiction in North America with such a high percentage of British Isles heritage is Newfoundland.
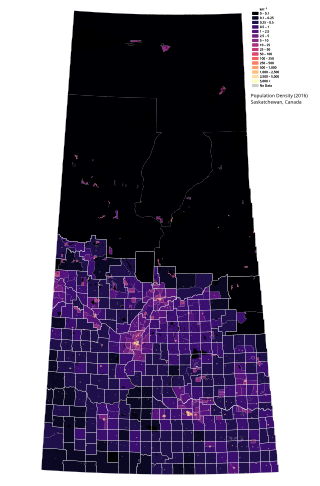
Saskatchewan is the middle province of Canada's three Prairie Provinces. It has an area of 651,900 km² (251,700 mi²) and a population of 1,132,505 (Saskatchewanians) as of 2021. Saskatchewan's population is made of 50.3% women and 49.7% men. Most of its population lives in the Southern half of the province.
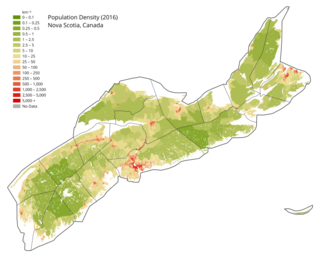
Nova Scotia is a Canadian province located on Canada's southeastern coast. It is the most populous province in Atlantic Canada, and its capital, Halifax, is a major economic centre of the region. Geographically, Nova Scotia is the second smallest province in Canada, with an area of 52,824.71 km2 (20,395.73 sq mi). As of 2021, it has a population of 969,383 people.
According to the 2021 census, the City of Edmonton had a population of 1,010,899 residents, compared to 4,262,635 for all of Alberta, Canada. The total population of the Edmonton census metropolitan area (CMA) was 1,418,118, making it the sixth-largest CMA in Canada.

In 2021, the population of the city of Ottawa was 1,017,449. The population of the census metropolitan area, Ottawa-Gatineau, was 1,488,307.

The Saskatoon region is the greater metropolitan area of Saskatoon, Saskatchewan. As of 2021 the Statistics Canada estimates the region's population to be 317,480 people.

In the 2021 Census, the City of Calgary had a population of 1,306,784 residents, representing 30.7% of the 4,262,635 residents in all of Alberta, and 3.5% compared to a population of 36,991,981 in all of Canada. The total population of the Calgary census metropolitan area (CMA) was 1,481,806. Calgary is the largest city in Alberta, and the third-largest municipality and fifth-largest metropolitan area in Canada, as of 2021.
The demographics of Winnipeg reveal the city to be a typically Canadian one: multicultural and multilingual. Winnipeg is also prominent in the size and ratio of its First Nations population, which plays an important part in the city's makeup. About 12.4% of Winnipeggers are of Indigenous descent, which vastly exceeds the national average of 5.0%.
Edmonds is a neighbourhood in the southeast of Burnaby, British Columbia, Canada. It is considered one of four town centres by the city of Burnaby. The SkyTrain's Edmonds station serves the area.

