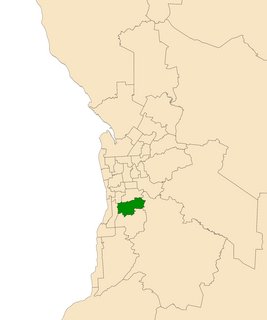
This is a list of electoral results for the Electoral district of Fisher in South Australian state elections.
Member | Party | Term | |
---|---|---|---|
Stan Evans | Liberal | 1970–1985 | |
Philip Tyler | Labor | 1985–1989 | |
Bob Such | Liberal | 1989–2000 | |
Independent | 2000–2014 | ||
Nat Cook | Labor | 2014–2018 |
Party | Candidate | Votes | % | ±% | |
---|---|---|---|---|---|
Liberal | Heidi Harris | 7,413 | 36.1 | +1.0 | |
Labor | Nat Cook | 5,495 | 26.7 | +9.0 | |
Independent Continue Such's Legacy | Dan Woodyatt | 4,789 | 23.3 | +23.3 | |
Independent Honest True Local | Dan Golding | 880 | 4.3 | +4.3 | |
Independent Leading the Community | Rob de Jonge | 809 | 3.9 | +3.9 | |
Greens | Malwina Wyra | 708 | 3.4 | −1.3 | |
Stop Population Growth Now | Bob Couch | 270 | 1.3 | +1.3 | |
Independent Australian Democrats | Jeanie Walker | 195 | 0.9 | +0.9 | |
Total formal votes | 20,559 | 96.1 | −1.5 | ||
Informal votes | 841 | 3.9 | +1.5 | ||
Turnout | 21,400 | 82.9 | −10.5 | ||
Two-party-preferred result | |||||
Labor | Nat Cook | 10,284 | 50.02 | +7.27 | |
Liberal | Heidi Harris | 10,275 | 49.98 | −7.27 | |
Labor gain from Independent | Swing | +7.27 |
Party | Candidate | Votes | % | ±% | |
---|---|---|---|---|---|
Independent | Bob Such | 9,038 | 38.5 | +3.6 | |
Liberal | Sam Duluk | 8,249 | 35.1 | +7.0 | |
Labor | Jake Neville | 4,170 | 17.7 | −8.6 | |
Greens | Malwina Wyra | 1,112 | 4.7 | −0.5 | |
Family First | Daryl van den Brink | 936 | 4.0 | −0.8 | |
Total formal votes | 23,505 | 97.6 | +0.1 | ||
Informal votes | 582 | 2.4 | −0.1 | ||
Turnout | 24,087 | 93.3 | −0.3 | ||
Two-party-preferred result | |||||
Liberal | Sam Duluk | 13,456 | 57.2 | +6.5 | |
Labor | Jake Neville | 10,049 | 42.8 | −6.5 | |
Two-candidate-preferred result | |||||
Independent | Bob Such | 13,951 | 59.4 | −8.1 | |
Liberal | Sam Duluk | 9,554 | 40.6 | +8.1 | |
Independent hold | Swing | −8.1 | |||
Party | Candidate | Votes | % | ±% | |
---|---|---|---|---|---|
Independent | Bob Such | 9,094 | 40.8 | -1.8 | |
Liberal | Christopher Moriarty | 5,976 | 26.8 | +6.7 | |
Labor | Adriana Christopoulos | 4,986 | 22.4 | -4.0 | |
Greens | Penny Wright | 1,210 | 5.4 | +1.4 | |
Family First | Trish Nolan | 996 | 4.5 | -0.7 | |
Total formal votes | 22,262 | 96.9 | |||
Informal votes | 671 | 3.1 | |||
Turnout | 22,933 | 94.1 | |||
Two-party-preferred result | |||||
Liberal | Christopher Moriarty | 11,548 | 51.9 | +10.3 | |
Labor | Adriana Christopoulos | 10,714 | 48.1 | -10.3 | |
Two-candidate-preferred result | |||||
Independent | Bob Such | 14,831 | 66.6 | +0.7 | |
Liberal | Christopher Moriarty | 7,431 | 33.4 | +33.4 | |
Independent hold | Swing | N/A | |||
Party | Candidate | Votes | % | ±% | |
---|---|---|---|---|---|
Independent | Bob Such | 9,212 | 45.2 | +11.7 | |
Labor | Amanda Rishworth | 5,373 | 26.4 | +4.3 | |
Liberal | Andy Minnis | 3,774 | 18.5 | -12.8 | |
Family First | Kathryn Rijken | 1,037 | 5.1 | +1.3 | |
Greens | Mark Byrne | 699 | 3.4 | +3.4 | |
Democrats | Max Baumann | 291 | 1.4 | -5.2 | |
Total formal votes | 20,386 | 97.0 | -0.1 | ||
Informal votes | 631 | 3.0 | +0.1 | ||
Turnout | 21,017 | 93.3 | -1.0 | ||
Two-party-preferred result | |||||
Labor | Amanda Rishworth | 12,110 | 59.4 | +15.1 | |
Liberal | Andy Minnis | 8,276 | 40.6 | -15.1 | |
Two-candidate-preferred result | |||||
Independent | Bob Such | 13,590 | 66.7 | +4.6 | |
Labor | Amanda Rishworth | 6,796 | 33.3 | +33.3 | |
Independent hold | Swing | N/A | |||
Party | Candidate | Votes | % | ±% | |
---|---|---|---|---|---|
Independent | Bob Such | 6,708 | 33.5 | +33.5 | |
Liberal | Susan Jeanes | 6,275 | 31.3 | -17.5 | |
Labor | Alex Zimmermann | 4,422 | 22.1 | -6.4 | |
Democrats | Jason Smith | 1,323 | 6.6 | -16.1 | |
Family First | Kylie Borg | 764 | 3.8 | +3.8 | |
One Nation | Trevor Mullins | 292 | 1.5 | +1.5 | |
SA First | John Chudzicki | 258 | 1.3 | +1.3 | |
Total formal votes | 20,042 | 97.1 | |||
Informal votes | 599 | 2.9 | |||
Turnout | 20,641 | 94.3 | |||
Two-party-preferred result | |||||
Liberal | Susan Jeanes | 55.7 | -4.1 | ||
Labor | Alex Zimmermann | 44.3 | +4.1 | ||
Two-candidate-preferred result | |||||
Independent | Bob Such | 12,439 | 62.1 | +62.1 | |
Liberal | Susan Jeanes | 7,603 | 37.9 | -21.3 | |
Independent gain from Liberal | Swing | N/A |
Party | Candidate | Votes | % | ±% | |
---|---|---|---|---|---|
Liberal | Bob Such | 10,225 | 49.5 | -14.8 | |
Labor | Tania Farrell | 5,849 | 28.3 | +6.0 | |
Democrats | Debbie Jones | 4,593 | 22.2 | +10.7 | |
Total formal votes | 20,667 | 96.6 | -1.1 | ||
Informal votes | 728 | 3.4 | +1.1 | ||
Turnout | 21,395 | 93.0 | |||
Two-party-preferred result | |||||
Liberal | Bob Such | 12,361 | 59.8 | -10.9 | |
Labor | Tania Farrell | 8,306 | 40.2 | +10.9 | |
Liberal hold | Swing | -10.9 | |||
Party | Candidate | Votes | % | ±% | |
---|---|---|---|---|---|
Liberal | Bob Such | 12,892 | 64.3 | +18.0 | |
Labor | Warren Smith | 4,471 | 22.3 | -18.8 | |
Democrats | Kathryn Warhurst | 2,308 | 11.5 | +2.3 | |
Natural Law | Amand Jung | 394 | 2.0 | +2.0 | |
Total formal votes | 20,065 | 97.7 | -0.4 | ||
Informal votes | 475 | 2.3 | +0.4 | ||
Turnout | 20,540 | 94.8 | |||
Two-party-preferred result | |||||
Liberal | Bob Such | 14,191 | 70.7 | +17.9 | |
Labor | Warren Smith | 5,874 | 29.3 | -17.9 | |
Liberal hold | Swing | +17.9 | |||
Party | Candidate | Votes | % | ±% | |
---|---|---|---|---|---|
Liberal | Bob Such | 11,653 | 46.4 | -0.5 | |
Labor | Philip Tyler | 10,238 | 40.8 | -7.6 | |
Democrats | Terry Clark | 2,346 | 9.3 | +4.6 | |
Call to Australia | John Watson | 511 | 2.0 | +2.0 | |
Independent | Alison Kent | 364 | 1.5 | +1.5 | |
Total formal votes | 25,112 | 97.8 | -0.3 | ||
Informal votes | 562 | 2.2 | +0.3 | ||
Turnout | 25,674 | 95.7 | +0.8 | ||
Two-party-preferred result | |||||
Liberal | Bob Such | 13,323 | 53.1 | +4.2 | |
Labor | Philip Tyler | 11,789 | 46.9 | -4.2 | |
Liberal gain from Labor | Swing | +4.2 |
Party | Candidate | Votes | % | ±% | |
---|---|---|---|---|---|
Labor | Philip Tyler | 9,908 | 48.4 | +6.7 | |
Liberal | Grant Chapman | 9,612 | 46.9 | +0.7 | |
Democrats | Audrey Sibly | 961 | 4.7 | -7.4 | |
Total formal votes | 20,481 | 98.1 | |||
Informal votes | 387 | 1.9 | |||
Turnout | 20,868 | 94.9 | |||
Two-party-preferred result | |||||
Labor | Philip Tyler | 10,469 | 51.1 | +3.2 | |
Liberal | Grant Chapman | 10,012 | 48.9 | -3.2 | |
Labor gain from Liberal | Swing | +3.2 |
Party | Candidate | Votes | % | ±% | |
---|---|---|---|---|---|
Liberal | Stan Evans | 11,436 | 52.5 | -10.0 | |
Labor | Annice Vass | 7,156 | 32.9 | +7.8 | |
Democrats | John Coulter | 3,188 | 14.6 | +2.2 | |
Total formal votes | 21,780 | 96.4 | -1.2 | ||
Informal votes | 812 | 3.6 | +1.2 | ||
Turnout | 22,592 | 93.9 | -3.7 | ||
Two-party-preferred result | |||||
Liberal | Stan Evans | 13,030 | 59.8 | -8.9 | |
Labor | Annice Vass | 8,750 | 40.2 | +8.9 | |
Liberal hold | Swing | -8.9 | |||
Party | Candidate | Votes | % | ±% | |
---|---|---|---|---|---|
Liberal | Stan Evans | 11,886 | 62.5 | +2.1 | |
Labor | Alvan Roman | 4,783 | 25.1 | -14.5 | |
Democrats | Robert Hercus | 2,350 | 12.4 | +12.4 | |
Total formal votes | 19,019 | 97.6 | +0.1 | ||
Informal votes | 465 | 2.4 | -0.1 | ||
Turnout | 19,484 | 94.3 | +0.7 | ||
Two-party-preferred result | |||||
Liberal | Stan Evans | 13,061 | 68.7 | +8.3 | |
Labor | Alvan Roman | 5,958 | 31.3 | -8.3 | |
Liberal hold | Swing | +8.3 | |||
Party | Candidate | Votes | % | ±% | |
---|---|---|---|---|---|
Liberal | Stan Evans | 10,429 | 60.4 | +17.9 | |
Labor | Sean Dawes | 6,828 | 39.6 | +6.4 | |
Total formal votes | 17,257 | 97.5 | |||
Informal votes | 439 | 2.5 | |||
Turnout | 17,696 | 93.6 | |||
Liberal hold | Swing | -2.3 | |||
Party | Candidate | Votes | % | ±% | |
---|---|---|---|---|---|
Liberal | Stan Evans | 8,255 | 42.8 | -16.6 | |
Labor | Geoffrey Anderson | 6,163 | 32.0 | -8.6 | |
Liberal Movement | Maxwell Hall | 4,601 | 23.9 | +23.9 | |
Australia | Ingrid Temple | 206 | 1.1 | +1.1 | |
National | William Donnon | 48 | 0.2 | +0.2 | |
Total formal votes | 19,273 | 98.0 | +1.0 | ||
Informal votes | 397 | 2.0 | -1.0 | ||
Turnout | 19,670 | 93.5 | -0.6 | ||
Two-party-preferred result | |||||
Liberal | Stan Evans | 12,806 | 66.4 | +7.0 | |
Labor | Geoffrey Anderson | 6,467 | 33.6 | -7.0 | |
Liberal hold | Swing | +7.0 | |||
Party | Candidate | Votes | % | ±% | |
---|---|---|---|---|---|
Liberal and Country | Stan Evans | 9,876 | 59.4 | +0.8 | |
Labor | Ronald Caldicott | 6,742 | 40.6 | +5.6 | |
Total formal votes | 16,618 | 97.0 | -1.8 | ||
Informal votes | 511 | 3.0 | +1.8 | ||
Turnout | 17,129 | 94.1 | +0.7 | ||
Liberal and Country hold | Swing | -2.4 | |||
Party | Candidate | Votes | % | ±% | |
---|---|---|---|---|---|
Liberal and Country | Stan Evans | 8,598 | 58.6 | ||
Labor | Murty Conlon | 5,128 | 35.0 | ||
Independent | Valerie Lillington | 942 | 6.4 | ||
Total formal votes | 14,668 | 98.8 | |||
Informal votes | 178 | 1.2 | |||
Turnout | 14,846 | 93.4 | |||
Two-party-preferred result | |||||
Liberal and Country | Stan Evans | 9,069 | 61.8 | ||
Labor | Murty Conlon | 5,599 | 38.2 | ||
Liberal and Country hold | Swing | ||||
The 2014 South Australian state election elected members to the 53rd Parliament of South Australia on 15 March 2014, to fill all 47 seats in the House of Assembly and 11 of 22 seats in the Legislative Council. The 12-year-incumbent Australian Labor Party (SA) government, led by Premier Jay Weatherill, won its fourth consecutive four-year term in government, a record 16 years of Labor government, defeating the opposition Liberal Party of Australia (SA), led by Opposition Leader Steven Marshall.
This is a list of electoral results for the Electoral district of Cheltenham in South Australian state elections.
This is a list of electoral results for the Electoral district of Colton in South Australian state elections.
This is a list of electoral results for the Electoral district of Davenport in South Australian state elections.
This is a list of electoral results for the Electoral district of Elder in South Australian state elections.
This is a list of electoral results for the Electoral district of Enfield in South Australian state elections.
This is a list of electoral results for the Electoral district of Finniss in South Australian state elections.
This is a list of electoral results for the Electoral district of Frome in South Australian state elections.
This is a list of electoral results for the Electoral district of Hartley in South Australian state elections.
This is a list of electoral results for the Electoral district of Heysen in South Australian state elections.
This is a list of electoral results for the Electoral district of Kaurna in South Australian state elections.
This is a list of electoral results for the Electoral district of MacKillop in South Australian state elections.
This is a list of electoral results for the Electoral district of Mount Gambier in South Australian state elections.
This is a list of electoral results for the Electoral district of Playford in South Australian state elections.
This is a list of electoral results for the Electoral district of Stuart in South Australian state elections.
This is a list of electoral results for the Electoral district of Unley in South Australian state elections.
This is a list of electoral results for the Electoral district of Waite in South Australian state elections.
This is a list of electoral results for the Electoral district of West Torrens in South Australian state elections.
This is a list of electoral results for the Electoral district of Dunstan in South Australian state elections.
A by-election for the seat of Davenport in the South Australian House of Assembly was held on 31 January 2015. The by-election was triggered by the resignation of Liberal Party of Australia MP and former Liberal leader Iain Evans, who retained the seat at the 2014 election on a 58.1 (−2.8) percent two-party-preferred vote. Liberal Sam Duluk went on to win the seat despite a five-point two-party swing, turning the historically safe seat of Davenport in to a marginal for the first time.