Related Research Articles
The Division of Makin is an electoral division for the Australian House of Representatives located in the northeastern suburbs of Adelaide. The 130 km2 seat covers an area from Little Para River and Gould Creek in the north-east to Grand Junction Road in the south and Port Wakefield Road in the west, including the suburbs of Banksia Park, Fairview Park, Golden Grove, Greenwith, Gulfview Heights, Ingle Farm, Mawson Lakes, Modbury, Para Hills, Para Vista, Pooraka, Redwood Park, Ridgehaven, Salisbury East, Salisbury Heights, St Agnes, Surrey Downs, Tea Tree Gully, Valley View, Vista, Walkley Heights, Wynn Vale, Yatala Vale, and parts of Gepps Cross and Hope Valley.

Adelaide is a single-member electoral district for the South Australian House of Assembly. The 22.8 km² state seat of Adelaide currently consists of the Adelaide city centre including North Adelaide and suburbs to the inner north and inner north east: Collinswood, Fitzroy, Gilberton, Medindie, Medindie Gardens, Ovingham, Thorngate, Walkerville, most of Prospect, and part of Nailsworth. The federal division of Adelaide covers the state seat of Adelaide and additional suburbs in each direction.

Fisher was an electoral district of the House of Assembly in the Australian state of South Australia. It was created in 1970 and named after Sir James Fisher, a colonial politician and the first mayor of Adelaide. It was abolished in a 2016 redistribution and its last MP, Nat Cook was elected to represent its replacement, Hurtle Vale, at the 2018 state election. It covers a 94.2 km2 suburban and semi rural area on the southern fringes of Adelaide, taking in the suburbs of Aberfoyle Park, Chandlers Hill, Cherry Gardens, Coromandel East, Happy Valley, Reynella East and parts of Clarendon, O'Halloran Hill and Woodcroft.
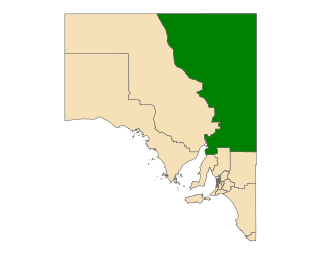
Stuart is a single-member electoral district for the South Australian House of Assembly. At 323,131 km², it is a vast country district extending from the Spencer Gulf as far as the Northern Territory border in the north and the Queensland and New South Wales borders in the east. The district includes pastoral lease and unincorporated Crown Lands, Lake Eyre and part of the Simpson Desert in the far north. Its main population centres since the 2020 boundaries redistribution are the industrial towns of Port Pirie and Port Augusta.
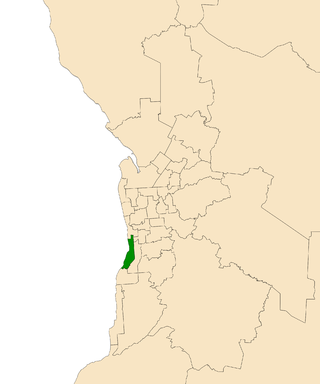
Bright is a former electorate for the South Australian House of Assembly. It was named in honour of Charles Bright, at various times South Australian Supreme Court Judge, Flinders University Chancellor, Health Commission chairman, and Electoral Boundaries Commission chairman. Prior to its 2018 abolition, the seat covered southern coastal suburbs of Adelaide including Brighton, North Brighton, South Brighton, Hallett Cove, Hove, Kingston Park, Marino, Seacliff, Seacliff Park and part of Somerton Park.

Newland is a single-member electoral district for the South Australian House of Assembly. It is named after pioneer Simpson Newland, a prominent figure in nineteenth-century South Australia. It is a 69.3 km² suburban electorate in north-eastern Adelaide, taking in the suburbs of Banksia Park, Fairview Park, Yatala Vale, Hope Valley, Ridgehaven, St Agnes, Tea Tree Gully, and Modbury, as well as part of Modbury North.

The electoral district of Yan Yean is an electoral district of the Victorian Legislative Assembly. It is located on the fringes of Melbourne's northern suburbs and contains the towns of Hurstbridge, Plenty, Whittlesea and Yan Yean.

The electoral district of Ivanhoe is an electoral district of the Victorian Legislative Assembly. It is located in the north-eastern suburbs of Melbourne and includes the suburbs of Heidelberg, Heidelberg Heights, Heidelberg West, Bellfield, Ivanhoe, Ivanhoe East, Eaglemont, Rosanna, Viewbank, Yallambie and Macleod.

West Swan is an electoral district of the Legislative Assembly in the Australian state of Western Australia. It is located in the north-eastern suburbs of Perth.

The 2014 South Australian state election elected members to the 53rd Parliament of South Australia on 15 March 2014, to fill all 47 seats in the House of Assembly and 11 of 22 seats in the Legislative Council. The 12-year-incumbent Australian Labor Party (SA) government, led by Premier Jay Weatherill, won its fourth consecutive four-year term in government, a record 16 years of Labor government, defeating the opposition Liberal Party of Australia (SA), led by Opposition Leader Steven Marshall.
This is a list of electoral results for the Electoral district of Adelaide in South Australian state elections from the district's first election in 1938 until the present.
This is a list of electoral results for the Electoral district of Ashford in South Australian state elections from the district's first election in 1997 until the 2018 state election, when the seat was abolished allowing the 2016 electoral redistribution.
This is a list of electoral results for the Electoral district of Frome in South Australian state elections.
This is a list of electoral results for the Electoral district of Hartley in South Australian state elections.
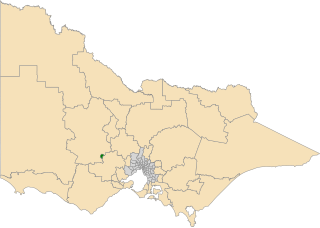
The electoral district of Wendouree is an electoral district of the Victorian Legislative Assembly in Australia. It was created in the redistribution of electoral boundaries in 2013, and came into effect at the 2014 state election.
This is a list of House of Assembly results for the 1993 South Australian state election.

The 2018 South Australian state election to elect members to the 54th Parliament of South Australia was held on 17 March 2018. All 47 seats in the House of Assembly or lower house, whose members were elected at the 2014 election, and 11 of 22 seats in the Legislative Council or upper house, last filled at the 2010 election, were contested. The record-16-year-incumbent Australian Labor Party (SA) government led by Premier Jay Weatherill was seeking a fifth four-year term, but was defeated by the opposition Liberal Party of Australia (SA), led by Opposition Leader Steven Marshall. Nick Xenophon's new SA Best party unsuccessfully sought to obtain the balance of power.

Badcoe is a single-member electoral district for the South Australian House of Assembly. It was created by the redistribution conducted in 2016, and was contested for the first time at the 2018 state election.
This is a list of House of Assembly results for the 2018 South Australian state election.
The 2022 South Australian state election was held on 19 March 2022 to elect members to the 55th Parliament of South Australia. All 47 seats in the House of Assembly, and half the seats in the Legislative Council were up for re-election.