This is a list of electoral results for the Electoral district of Kavel in South Australian state elections.
Member | Party | Term | |
---|---|---|---|
Roger Goldsworthy | Liberal and Country | 1970–1974 | |
Liberal | 1974–1992 | ||
John Olsen | Liberal | 1992–2002 | |
Mark Goldsworthy | Liberal | 2002–2018 | |
Dan Cregan | Liberal | 2018–2021 | |
Independent | 2021–present | ||
Party | Candidate | Votes | % | ±% | |
---|---|---|---|---|---|
Independent | Dan Cregan | 12,199 | 50.5 | +50.5 | |
Liberal | Rowan Mumford | 5,036 | 20.8 | −26.4 | |
Labor | Glen Dallimore | 3,458 | 14.3 | −1.7 | |
Greens | Melanie Selwood | 1,978 | 8.2 | −1.0 | |
One Nation | Gayle Allwood | 894 | 3.7 | +3.7 | |
Animal Justice | Padma Chaplin | 599 | 2.5 | −0.3 | |
Total formal votes | 24,164 | 97.5 | |||
Informal votes | 625 | 2.5 | |||
Turnout | 24,789 | 91.3 | |||
Notional two-party-preferred count | |||||
Liberal | Rowan Mumford | 54.7 | −9.8 | ||
Labor | Glen Dallimore | 45.3 | +9.8 | ||
Two-candidate-preferred result | |||||
Independent | Dan Cregan | 18,231 | 75.4 | +75.4 | |
Liberal | Rowan Mumford | 5,933 | 24.6 | −39.9 | |
Independent hold |
Party | Candidate | Votes | % | ±% | |
---|---|---|---|---|---|
Liberal | Dan Cregan | 10,374 | 48.1 | −6.3 | |
SA-Best | Andrew Stratford | 4,217 | 19.6 | +19.6 | |
Labor | Glen Dallimore | 3,436 | 15.9 | −6.0 | |
Greens | Ian Grosser | 1,963 | 9.1 | −7.2 | |
Animal Justice | Louise Pfeiffer | 644 | 3.0 | +3.0 | |
Conservatives | Howard Hollow | 615 | 2.9 | −4.0 | |
Dignity | Cristina Rodert | 313 | 1.5 | +0.9 | |
Total formal votes | 21,562 | 96.4 | −0.8 | ||
Informal votes | 816 | 3.6 | +0.8 | ||
Turnout | 22,378 | 92.7 | +4.1 | ||
Two-party-preferred result | |||||
Liberal | Dan Cregan | 13,965 | 64.8 | +1.0 | |
Labor | Glen Dallimore | 7,597 | 35.2 | −1.0 | |
Two-candidate-preferred result | |||||
Liberal | Dan Cregan | 12,878 | 59.7 | −4.1 | |
SA-Best | Andrew Stratford | 8,684 | 40.3 | +40.3 | |
Liberal hold | Swing | N/A | |||
Party | Candidate | Votes | % | ±% | |
---|---|---|---|---|---|
Liberal | Mark Goldsworthy | 12,116 | 54.4 | −1.2 | |
Labor | Richard Hilton | 4,838 | 21.7 | −2.0 | |
Greens | Ian Grosser | 3,481 | 15.6 | +2.9 | |
Family First | Darryl Stott | 1,854 | 8.3 | +2.9 | |
Total formal votes | 22,289 | 97.1 | −0.0 | ||
Informal votes | 655 | 2.9 | +0.0 | ||
Turnout | 22,944 | 92.6 | −0.2 | ||
Two-party-preferred result | |||||
Liberal | Mark Goldsworthy | 14,258 | 64.0 | −1.8 | |
Labor | Richard Hilton | 8,031 | 36.0 | +1.8 | |
Liberal hold | Swing | −1.8 | |||
Party | Candidate | Votes | % | ±% | |
---|---|---|---|---|---|
Liberal | Mark Goldsworthy | 11,389 | 55.6 | +12.4 | |
Labor | John Fulbrook | 4,861 | 23.7 | −2.3 | |
Greens | Ian Grosser | 2,604 | 12.7 | +2.7 | |
Family First | Colin Croft | 1,110 | 5.4 | −9.8 | |
Democrats | Kathy Brazher-de Laine | 529 | 2.6 | −1.3 | |
Total formal votes | 20,493 | 96.8 | |||
Informal votes | 602 | 3.2 | |||
Turnout | 21,095 | 92.8 | |||
Two-party-preferred result | |||||
Liberal | Mark Goldsworthy | 13,486 | 65.8 | +7.8 | |
Labor | John Fulbrook | 7,007 | 34.2 | −7.8 | |
Liberal hold | Swing | +7.8 | |||
Party | Candidate | Votes | % | ±% | |
---|---|---|---|---|---|
Liberal | Mark Goldsworthy | 8,590 | 43.9 | −0.4 | |
Labor | John Marshall | 4,868 | 24.9 | +6.8 | |
Family First | Tom Playford | 3,081 | 15.7 | +15.5 | |
Greens | Renata Zilm | 1,951 | 10.0 | +4.5 | |
Democrats | Kathy Brazher-De Laine | 709 | 3.6 | −5.9 | |
One Nation | Robert Fechner | 373 | 1.9 | −0.1 | |
Total formal votes | 19,572 | 96.5 | |||
Informal votes | 644 | 3.5 | |||
Turnout | 20,216 | 91.9 | |||
Two-party-preferred result | |||||
Liberal | Mark Goldsworthy | 11,624 | 59.4 | +6.5 | |
Labor | John Marshall | 7,948 | 40.6 | +40.6 | |
Liberal hold | Swing | N/A | |||
Party | Candidate | Votes | % | ±% | |
---|---|---|---|---|---|
Liberal | Mark Goldsworthy | 8,974 | 43.4 | −9.1 | |
Independent | Tom Playford | 3,860 | 18.7 | +18.7 | |
Labor | Mel Hopgood | 3,718 | 18.0 | −1.4 | |
Democrats | Cathi Tucker-Lee | 1,874 | 9.1 | −13.7 | |
Greens | Felicity Martin | 1,089 | 5.3 | +5.3 | |
SA First | Peter Robins | 708 | 3.4 | +3.4 | |
One Nation | Basil Hille | 459 | 2.2 | +2.2 | |
Total formal votes | 20,682 | 96.9 | |||
Informal votes | 669 | 3.1 | |||
Turnout | 21,351 | 93.8 | |||
Two-party-preferred result | |||||
Liberal | Mark Goldsworthy | 63.1 | −1.9 | ||
Labor | Mel Hopgood | 36.9 | +1.9 | ||
Two-candidate-preferred result | |||||
Liberal | Mark Goldsworthy | 10,938 | 52.9 | −3.8 | |
Independent | Tom Playford | 9,744 | 47.1 | +47.1 | |
Liberal hold | Swing | N/A | |||
Party | Candidate | Votes | % | ±% | |
---|---|---|---|---|---|
Liberal | John Olsen | 9,691 | 52.3 | −13.8 | |
Democrats | Cathi Tucker-Lee | 4,306 | 23.2 | +12.9 | |
Labor | Robert Kieselbach | 3,686 | 19.9 | +1.9 | |
United Australia | Evan Trousse | 852 | 4.6 | +4.6 | |
Total formal votes | 18,535 | 95.8 | −1.5 | ||
Informal votes | 803 | 4.2 | +1.5 | ||
Turnout | 19,338 | 91.5 | |||
Two-party-preferred result | |||||
Liberal | John Olsen | 12,039 | 65.0 | −9.1 | |
Labor | Robert Kieselbach | 6,496 | 35.0 | +9.1 | |
Two-candidate-preferred result | |||||
Liberal | John Olsen | 10,437 | 56.3 | −17.7 | |
Democrats | Cathi Tucker-Lee | 8,098 | 43.7 | +43.7 | |
Liberal hold | Swing | N/A | |||
Party | Candidate | Votes | % | ±% | |
---|---|---|---|---|---|
Liberal | John Olsen | 12,521 | 66.3 | +8.3 | |
Labor | Joseph Kane | 3,360 | 17.8 | −7.2 | |
Democrats | Peter Brzycki | 1,954 | 10.4 | −3.0 | |
Independent | Graeme Watts | 622 | 3.3 | +3.3 | |
Natural Law | Lyndal Vincent | 421 | 2.2 | +2.2 | |
Total formal votes | 18,878 | 97.4 | 0.0 | ||
Informal votes | 510 | 2.6 | 0.0 | ||
Turnout | 19,388 | 93.8 | |||
Two-party-preferred result | |||||
Liberal | John Olsen | 14,019 | 74.3 | +7.4 | |
Labor | Joseph Kane | 4,859 | 25.7 | −7.4 | |
Liberal hold | Swing | +7.4 | |||
Party | Candidate | Votes | % | ±% | |
---|---|---|---|---|---|
Liberal | J Olsen | 10,381 | 53.4 | −2.4 | |
Democrats | J Blundell | 3,054 | 15.7 | +2.7 | |
Labor | L Stevens | 2,816 | 14.5 | −11.6 | |
Australian Independent Alliance | G C Watts | 1,591 | 8.2 | +8.2 | |
Grey Power | S L B Batten | 1,127 | 5.8 | +5.8 | |
Independent | J D Henderson | 457 | 2.4 | +2.4 | |
Total formal votes | 19,426 | 96.4 | N/A | ||
Informal votes | 716 | 3.6 | N/A | ||
Turnout | 20,142 | 83.9 | N/A | ||
Two-candidate-preferred result | |||||
Liberal | J Olsen | 11,989 | 61.7 | −3.8 | |
Democrats | J Blundell | 7,437 | 38.3 | +38.3 | |
Liberal hold | Swing | N/A | |||
Party | Candidate | Votes | % | ±% | |
---|---|---|---|---|---|
Liberal | Roger Goldsworthy | 11,560 | 55.8 | +3.7 | |
Labor | Warren Smith | 5,410 | 26.1 | −8.9 | |
Democrats | Michel Francis | 2,698 | 13.0 | +13.0 | |
Call to Australia | Graeme Watts | 1,046 | 5.1 | +5.1 | |
Total formal votes | 20,714 | 97.8 | +0.8 | ||
Informal votes | 465 | 2.2 | −0.8 | ||
Turnout | 21,179 | 95.6 | +2.1 | ||
Two-party-preferred result | |||||
Liberal | Roger Goldsworthy | 13,567 | 65.5 | +3.7 | |
Labor | Warren Smith | 7,174 | 34.5 | −3.7 | |
Liberal hold | Swing | +3.7 | |||
Party | Candidate | Votes | % | ±% | |
---|---|---|---|---|---|
Liberal | Roger Goldsworthy | 10,842 | 59.5 | +2.5 | |
Labor | Lance Jones | 6,380 | 35.0 | −3.0 | |
Independent | Paul Reader | 1,002 | 5.5 | +5.5 | |
Total formal votes | 18,224 | 97.0 | |||
Informal votes | 555 | 3.0 | |||
Turnout | 18,779 | 93.5 | |||
Two-party-preferred result | |||||
Liberal | Roger Goldsworthy | 11,250 | 61.8 | +1.8 | |
Labor | Lance Jones | 6,974 | 38.2 | −1.8 | |
Liberal hold | Swing | +1.8 | |||
Party | Candidate | Votes | % | ±% | |
---|---|---|---|---|---|
Liberal | Roger Goldsworthy | 10,878 | 63.4 | −5.4 | |
Labor | Geoffrey Anderson | 5,019 | 29.2 | +7.0 | |
Democrats | Brian Fain | 1,261 | 7.4 | −1.6 | |
Total formal votes | 17,158 | 95.2 | −2.0 | ||
Informal votes | 855 | 4.8 | +2.0 | ||
Turnout | 18,013 | 93.5 | −0.3 | ||
Two-party-preferred result | |||||
Liberal | Roger Goldsworthy | 11,452 | 66.7 | −7.6 | |
Labor | Geoffrey Anderson | 5,706 | 33.3 | +7.6 | |
Liberal hold | Swing | -7.6 | |||
Party | Candidate | Votes | % | ±% | |
---|---|---|---|---|---|
Liberal | Roger Goldsworthy | 11,248 | 68.8 | +5.0 | |
Labor | Sydney Tilmouth | 3,626 | 22.2 | −6.3 | |
Democrats | Ivor Childs | 1,464 | 9.0 | +1.3 | |
Total formal votes | 16,338 | 97.2 | −1.0 | ||
Informal votes | 476 | 2.8 | +1.0 | ||
Turnout | 16,814 | 93.8 | −0.6 | ||
Two-party-preferred result | |||||
Liberal | Roger Goldsworthy | 12,143 | 74.3 | +5.6 | |
Labor | Sydney Tilmouth | 4,195 | 25.7 | −5.6 | |
Liberal hold | Swing | +5.6 | |||
Party | Candidate | Votes | % | ±% | |
---|---|---|---|---|---|
Liberal | Roger Goldsworthy | 10,260 | 63.8 | +12.6 | |
Labor | Sydney Tilmouth | 4,589 | 28.5 | +8.1 | |
Democrats | Reginald Goldsworthy | 1,244 | 7.7 | +7.7 | |
Total formal votes | 16,093 | 98.2 | |||
Informal votes | 288 | 1.8 | |||
Turnout | 16,381 | 94.4 | |||
Two-party-preferred result | |||||
Liberal | Roger Goldsworthy | 11,064 | 68.7 | −6.3 | |
Labor | Sydney Tilmouth | 5,029 | 31.3 | +6.3 | |
Liberal hold | Swing | -6.3 | |||
Party | Candidate | Votes | % | ±% | |
---|---|---|---|---|---|
Liberal | Roger Goldsworthy | 5,292 | 52.4 | −3.4 | |
Liberal Movement | Roger Teusner | 2,418 | 24.0 | +24.0 | |
Labor | Roy Hobden | 1,854 | 18.4 | −9.4 | |
National | Eric Bartsch | 477 | 4.7 | −11.7 | |
National | Harold Booth | 50 | 0.5 | +0.5 | |
Total formal votes | 10,091 | 97.6 | −0.1 | ||
Informal votes | 253 | 2.4 | +0.1 | ||
Turnout | 10,344 | 95.3 | −0.7 | ||
Two-party-preferred result | |||||
Liberal | Roger Goldsworthy | 7,942 | 78.7 | +8.7 | |
Labor | Roy Hobden | 2,149 | 21.3 | −8.7 | |
Liberal hold | Swing | +8.7 | |||
Party | Candidate | Votes | % | ±% | |
---|---|---|---|---|---|
Liberal and Country | Roger Goldsworthy | 5,267 | 55.8 | −9.6 | |
Labor | Mark Eckermann | 2,619 | 27.8 | +27.8 | |
National | Elmore Schulz | 1,550 | 16.4 | −18.2 | |
Total formal votes | 9,436 | 97.7 | +6.5 | ||
Informal votes | 221 | 2.3 | −6.5 | ||
Turnout | 9,657 | 96.0 | −0.2 | ||
Two-party-preferred result | |||||
Liberal and Country | Roger Goldsworthy | 6,605 | 70.0 | +4.6 | |
Labor | Mark Eckermann | 2,831 | 30.0 | +30.0 | |
Liberal and Country hold | Swing | N/A | |||
Party | Candidate | Votes | % | ±% | |
---|---|---|---|---|---|
Liberal and Country | Roger Goldsworthy | 5,513 | 65.4 | ||
National | Elmore Schulz | 2,922 | 34.6 | ||
Total formal votes | 8,435 | 91.2 | |||
Informal votes | 810 | 8.8 | |||
Turnout | 9,245 | 96.2 | |||
Liberal and Country hold | Swing | ||||
Kavel, created in 1969 and coming into effect in 1970, is a single-member electoral district for the South Australian House of Assembly. Located to the east of Adelaide, Kavel is based on the town of Mount Barker and includes much of the eastern portion of the Adelaide Hills.
A by-election was held for the South Australian House of Assembly seat of Frome on 17 January 2009. This was triggered by the resignation of former Premier and state Liberal MHA Rob Kerin. The seat had been retained by the Liberals at the 2006 state election on a 3.4 per cent margin, and at the 2002 state election on an 11.5 per cent margin.
A by-election was held for the South Australian House of Assembly seat of Alexandra on 9 May 1992. This was triggered by the resignation of former state Liberal MHA Ted Chapman. The seat had been retained by the Liberals since it was created and first contested at the 1973 state election. The by-election was held on the same day as the Kavel state by-election.
The 2014 South Australian state election elected members to the 53rd Parliament of South Australia on 15 March 2014, to fill all 47 seats in the House of Assembly and 11 of 22 seats in the Legislative Council. The 12-year-incumbent Australian Labor Party (SA) government, led by Premier Jay Weatherill, won its fourth consecutive four-year term in government, a record 16 years of Labor government, defeating the opposition Liberal Party of Australia (SA), led by Opposition Leader Steven Marshall.
This is a list of electoral results for the Electoral district of Flinders in South Australian state elections from the district's first election in 1938 until the present.
This is a list of electoral results for the Electoral district of Chaffey in South Australian state elections.
This is a list of electoral results for the Electoral district of Cheltenham in South Australian state elections.
This is a list of electoral results for the Electoral district of Davenport in South Australian state elections.
This is a list of electoral results for the Electoral district of Enfield in South Australian state elections.
This is a list of electoral results for the Electoral district of Florey in South Australian state elections.
This is a list of electoral results for the Electoral district of Frome in South Australian state elections.
This is a list of electoral results for the Electoral district of Hartley in South Australian state elections.
This is a list of electoral results for the Electoral district of Heysen in South Australian state elections.
This is a list of electoral results for the Electoral district of Light in South Australian state elections.
This is a list of electoral results for the Electoral district of Mount Gambier in South Australian state elections.
This is a list of electoral results for the Electoral district of Newland in South Australian state elections.
The 2018 South Australian state election to elect members to the 54th Parliament of South Australia was held on 17 March 2018. All 47 seats in the House of Assembly or lower house, whose members were elected at the 2014 election, and 11 of 22 seats in the Legislative Council or upper house, last filled at the 2010 election, were contested. The record-16-year-incumbent Australian Labor Party (SA) government led by Premier Jay Weatherill was seeking a fifth four-year term, but was defeated by the opposition Liberal Party of Australia (SA), led by Opposition Leader Steven Marshall. Nick Xenophon's new SA Best party unsuccessfully sought to obtain the balance of power.
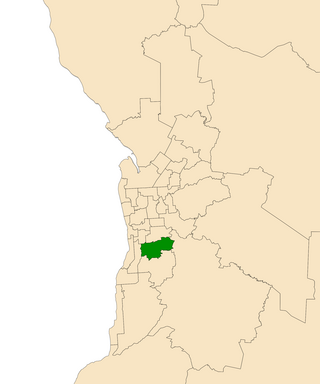
A by-election for the seat of Davenport in the South Australian House of Assembly was held on 31 January 2015. The by-election was triggered by the resignation of Liberal Party of Australia MP and former Liberal leader Iain Evans, who retained the seat at the 2014 election on a 58.1 (−2.8) percent two-party-preferred vote. Liberal Sam Duluk went on to win the seat despite a five-point two-party swing, turning the historically safe seat of Davenport in to a marginal for the first time.
This is a list of House of Assembly results for the 2018 South Australian state election.
The 2022 South Australian state election was held on 19 March 2022 to elect members to the 55th Parliament of South Australia. All 47 seats in the House of Assembly, and half the seats in the Legislative Council were up for re-election.