The economy of Chad suffers from the landlocked country's geographic remoteness, drought, lack of infrastructure, and political turmoil. About 85% of the population depends on agriculture, including the herding of livestock. Of Africa's Francophone countries, Chad benefited least from the 50% devaluation of their currencies in January 1994. Financial aid from the World Bank, the African Development Bank, and other sources is directed largely at the improvement of agriculture, especially livestock production. Because of lack of financing, the development of oil fields near Doba, originally due to finish in 2000, was delayed until 2003. It was finally developed and is now operated by ExxonMobil. In terms of gross domestic product, Chad ranks 143rd globally with $11.051 billion dollars as of 2018.

The economy of the Dominican Republic is the seventh largest in Latin America, and is the largest in the Caribbean and Central American region. The Dominican Republic is an upper-middle income developing country with important sectors including mining, tourism, manufacturing, energy, real estate, infrastructure, telecommunications and agriculture. The Dominican Republic is on track to achieve its goal of becoming a high-income country by 2030, and is expected to grow 79% in this decade. The country is the site of the single largest gold mine in Latin America, the Pueblo Viejo mine.Although the service sector is currently the leading employer of Dominicans, agriculture remains an important sector in terms of the domestic market and is in second place in terms of export earnings. Tourism accounts for more than $7.4 billion in annual earnings in 2019. Free-trade zone earnings and tourism are the fastest-growing export sectors. A leading growth engine in the Free-trade zone sector is the production of medical equipment for export having a value-added per employee of $20,000 USD, total revenue of $1.5 billion USD, and a growth rate of 7.7% in 2019. The medical instrument export sector represents one of the highest-value added sectors of the country's economy, a true growth engine for the country's emerging market. Remittances are an important sector of the economy, contributing $8.2 billion in 2020. Most of these funds are used to cover household expenses, such as housing, food, clothing, health care and education. Secondarily, remittances have financed businesses and productive activities. Thirdly, this combined effect has induced investment by the private sector and helps fund the public sector through its value-added tax. The combined import market including the free-trade-zones amounts to a market of $20 billion a year in 2019. The combined export sector had revenues totaling $11 billion in 2019. The consumer market is equivalent to $61 billion in 2019. An important indicator is the average commercial loan interest rate, which directs short-term investment and stimulates long-term investment in the economy. It is currently 8.30%, as of June 2021.

The 'economy of Libya depends primarily on revenues from the petroleum sector, which represents over 95% of export earnings and 60% of GDP. These oil revenues and a small population have given Libya one of the highest nominal per capita GDP in Africa.

The Gross Domestic Product (GDP) of Niger was $13.68 billion US dollars in 2020, according to official data from the World Bank. This data is based largely on internal markets, subsistence agriculture, and the export of raw commodities: foodstuffs to neighbors and raw minerals to world markets. Niger, a landlocked West African nation that straddles the Sahel, has consistently been ranked on the bottom of the Human Development Index, at 0.394 as of 2019. It has a very low per capita income, and ranks among the least developed and most heavily indebted countries in the world, despite having large raw commodities and a relatively stable government and society not currently affected by civil war or terrorism. Economic activity centers on subsistence agriculture, animal husbandry, re-export trade, and export of uranium.

The economy of the Republic of the Congo is a mixture of subsistence hunting and agriculture, an industrial sector based largely on petroleum extraction and support services. Government spending is characterized by budget problems and overstaffing. Petroleum has supplanted forestry as the mainstay of the economy, providing a major share of government revenues and exports. Nowadays the Republic of the Congo is increasingly converting natural gas to electricity rather than burning it, greatly improving energy prospects.

The energy policy of the United States is determined by federal, state, and local entities. It addresses issues of energy production, distribution, consumption, and modes of use, such as building codes, mileage standards, and commuting policies. Energy policy may be addressed via include legislation, regulation, court decisions, public participation, and other techniques.
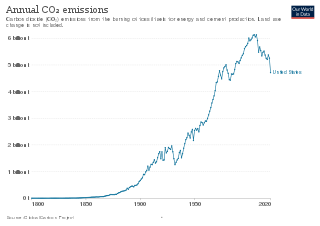
Energy in the United States came mostly from fossil fuels in 2021 as 36% of the nation's energy originated from petroleum, 32% from natural gas, and 11% from coal. Nuclear power supplied 8% and renewable energy supplied 12%, which includes hydroelectric dams, biomass, wind, geothermal, and solar.
The energy policy of India is to increase energy in India and reduce energy poverty, with more focus on developing alternative sources of energy, particularly nuclear, solar and wind energy. India attained 63% overall energy self-sufficiency in 2017.

Iran has the fourth largest oil reserves and the 2nd largest natural gas reserves in the world. The nation is a member of OPEC, and generates approximately 50% of state revenue through oil exports.

Ensuring adequate energy supply to sustain economic growth has been a core concern of the Chinese government since 1949. The country is the world's largest emitter of greenhouse gases, and coal in China is a major cause of global warming. However, from 2010 to 2015 China reduced energy consumption per unit of GDP by 18%, and CO2 emissions per unit of GDP by 20%. On a per-capita basis, it was the world's 51st largest emitter of greenhouse gases in 2016. China is also the world's largest renewable energy producer. China is the largest producer of hydroelectricity, solar power and wind power in the world. The energy policy of China is connected to its industrial policy. The goals of China's industrial policy dictate its energy needs.

Ghana generates electric power from hydropower, fossil-fuel, and renewable energy sources. Electricity generation is one of the key factors in order to achieve the development of the Ghanaian national economy, with aggressive and rapid industrialisation; Ghana's national electric energy consumption was 265 kilowatt hours per capita in 2009.

Vietnam is a dynamic developing economy with a relatively high growth rate. The energy sector plays a key role in promoting the country's socio-economic development. Vietnam has a diverse energy fuel resource of various types such as coal, natural gas, petroleum, hydropower and renewables such as solar and wind energy. The country has recently been successful in renewable energy deployment, especially solar and wind power development. The high use of coal makes Vietnam an increasingly important emitter of carbon dioxide, contributing to climate change.

The economy of Ivory Coast is stable and currently growing, in the aftermath of political instability in recent decades. The Ivory Coast's economy is largely market-based and depends heavily on the agricultural sector. Almost 70% of the Ivorian people are engaged in some form of agricultural activity. GDP per capita grew 82% in the 1960s, reaching a peak growth of 360% in the 1970s, but this proved unsustainable and it shrank by 28% in the 1980s and a further 22% in the 1990s. This decline, coupled with high population growth, resulted in a steady fall in living standards. The Gross national product per capita, now rising again, was about US$727 in 1996. It was substantially higher two decades before.
The Democratic Republic of the Congo was a net energy exporter in 2008. Most energy was consumed domestically in 2008. According to the IEA statistics the energy export was in 2008 small and less than from the Republic of Congo. 2010 population figures were 3.8 million for the RC compared to CDR 67.8 Million.
There is a large array of stakeholders that provide services through electricity generation, transmission, distribution and marketing for industrial, commercial, public and residential customers in the United States. It also includes many public institutions that regulate the sector. In 1996, there were 3,195 electric utilities in the United States, of which fewer than 1,000 were engaged in power generation. This leaves a large number of mostly smaller utilities engaged only in power distribution. There were also 65 power marketers. Of all utilities, 2,020 were publicly owned, 932 were rural electric cooperatives, and 243 were investor-owned utilities. The electricity transmission network is controlled by Independent System Operators or Regional Transmission Organizations, which are not-for-profit organizations that are obliged to provide indiscriminate access to various suppliers in order to promote competition.
Energy in Azerbaijan describes energy and electricity production, consumption and export in Azerbaijan.

Energy in Qatar describes energy production, consumption, and policies of the State of Qatar. The International Monetary Fund ranked Qatar as having the fifth highest GDP per capita in 2016 with a 60,787 USD per capita nominal GDP over a population of 2.421 million inhabitants. In 2014, oil and natural gas production made up 51.1% of Qatar's nominal GDP. Thus, Qatar has a worldwide high ranking of per capita GDP due to its significance production and exports in both crude oil and natural gas in proportion to its relatively small population.

This article describes energy and electricity production, consumption, import and export in Kenya. Kenya's current effective installed electricity capacity is 2,651 MW, with peak demand of 1,912 MW, as of November 2019. At that time, demand was rising at a calculated rate of 3.6 percent annually, given that peak demand was 1,770 MW, at the beginning of 2018. Electricity supply is mostly generated by renewable sources with the majority coming from geothermal power and hydroelectricity.

World energy supply and consumption is global production and preparation of fuel, generation of electricity, energy transport, and energy consumption. It is a basic part of economic activity. It includes heat, but not energy from food.

Ethiopia has abundant resources that can generate 60,000 MW electricity from hydroelectric, wind, solar and geothermal sources in the next 10 years. The electrification process causes GDP growth and high public demand for 110 million of its population. On total, Ethiopia produces 11 billion kWh from all facilities and exports other resources like natural gas or crude oil.