Energy profile (chemistry)

Last updated

In theoretical chemistry, an energy profile is a theoretical representation of a chemical reaction or process as a single energetic pathway as the reactants are transformed into products. This pathway runs along the reaction coordinate, which is a parametric curve that follows the pathway of the reaction and indicates its progress; thus, energy profiles are also called reaction coordinate diagrams. They are derived from the corresponding potential energy surface (PES), which is used in computational chemistry to model chemical reactions by relating the energy of a molecule(s) to its structure (within the Born–Oppenheimer approximation).

Contents

Figure 1: Reaction Coordinate Diagram: Starting material or reactant A convert to product C via the transition state B, with the help of activation energy DG, after which chemical energy DGdeg is released Reaction Coordinate Diagram.png
Figure 1: Reaction Coordinate Diagram: Starting material or reactant A convert to product C via the transition state B, with the help of activation energy ΔG, after which chemical energy ΔG° is released

Qualitatively, the reaction coordinate diagrams (one-dimensional energy surfaces) have numerous applications. Chemists use reaction coordinate diagrams as both an analytical and pedagogical aid for rationalizing and illustrating kinetic and thermodynamic events. The purpose of energy profiles and surfaces is to provide a qualitative representation of how potential energy varies with molecular motion for a given reaction or process. [1]

Potential energy surfaces

In simplest terms, a potential energy surface or PES is a mathematical or graphical representation of the relation between energy of a molecule and its geometry. The methods for describing the potential energy are broken down into a classical mechanics interpretation (molecular mechanics) and a quantum mechanical interpretation. In the quantum mechanical interpretation an exact expression for energy can be obtained for any molecule derived from quantum principles (although an infinite basis set may be required) but ab initio calculations/methods will often use approximations to reduce computational cost. [2] [3] Molecular mechanics is empirically based and potential energy is described as a function of component terms that correspond to individual potential functions such as torsion, stretches, bends, Van der Waals energies, electrostatics and cross terms. [3] [4] [5] Each component potential function is fit to experimental data or properties predicted by ab initio calculations. [4] Molecular mechanics is useful in predicting equilibrium geometries and transition states as well as relative conformational stability. As a reaction occurs the atoms of the molecules involved will generally undergo some change in spatial orientation through internal motion as well as its electronic environment. [1] Distortions in the geometric parameters result in a deviation from the equilibrium geometry (local energy minima). These changes in geometry of a molecule or interactions between molecules are dynamic processes which call for understanding all the forces operating within the system. Since these forces can be mathematically derived as first derivative of potential energy with respect to a displacement, it makes sense to map the potential energy E of the system as a function of geometric parameters q1, q2, q3 and so on. [1] The potential energy at given values of the geometric parameters (q1, q2, ..., qn) is represented as a hyper-surface (when n > 2) or a surface (when n ≤ 2). Mathematically, it can be written as

For the quantum mechanical interpretation, a PES is typically defined within the Born–Oppenheimer approximation (in order to distinguish between nuclear and electronic motion and energy) which states that the nuclei are stationary relative to the electrons. In other words, the approximation allows the kinetic energy of the nuclei (or movement of the nuclei) to be neglected and therefore the nuclei repulsion is a constant value (as static point charges) and is only considered when calculating the total energy of the system. The electronic energy is then taken to depend parametrically on the nuclear coordinates, meaning a new electronic energy (Ee) must be calculated for each corresponding atomic configuration. [2] [3]

PES is an important concept in computational chemistry and greatly aids in geometry and transition state optimization.

Degrees of freedom

An n-atom system is defined by 3n coordinates: (x, y, z) for each atom. These 3n degrees of freedom can be broken down to include 3 overall translational and 3 (or 2) overall rotational degrees of freedom for a non-linear system (for a linear system). However, overall translational or rotational degrees do not affect the potential energy of the system, which only depends on its internal coordinates. Thus an n-atom system will be defined by 3n – 6 (non-linear) or 3n – 5 (linear) coordinates. [1] [3] These internal coordinates may be represented by simple stretch, bend, torsion coordinates, or symmetry-adapted linear combinations, or redundant coordinates, or normal modes coordinates, etc. For a system described by n-internal coordinates a separate potential energy function can be written with respect to each of these coordinates by holding the other n – 1 parameters at a constant value allowing the potential energy contribution from a particular molecular motion (or interaction) to be monitored while the other n – 1 parameters are defined.

Consider a diatomic molecule AB which can macroscopically visualized as two balls (which depict the two atoms A and B) connected through a spring which depicts the bond. As this spring (or bond) is stretched or compressed, the potential energy of the ball-spring system (AB molecule) changes and this can be mapped on a 2-dimensional plot as a function of distance between A and B, i.e. bond length.

Figure 2: Ball and Spring Model for a Diatomic Molecule- Atoms A and B connected through a bond (spring). Potential energy is a function of distance r from the equilibrium point Ball and Spring Model and Corresponding Potential Energy Diagram.png
Figure 2: Ball and Spring Model for a Diatomic Molecule- Atoms A and B connected through a bond (spring). Potential energy is a function of distance r from the equilibrium point

The concept can be expanded to a tri-atomic molecule such as water where we have two O−H bonds and H−O−H bond angle as variables on which the potential energy of a water molecule will depend. We can safely assume the two O−H bonds to be equal. Thus, a PES can be drawn mapping the potential energy E of a water molecule as a function of two geometric parameters, q1 = O–H bond length and q2 = H–O–H bond angle. The lowest point on such a PES will define the equilibrium structure of a water molecule.

Figure 3: PES for water molecule:
Shows the energy minimum corresponding to optimized molecular structure for water,
O-H bond length of 0.0958 nm and
H-O-H bond angle of 104.5deg Potential Energy Surface for Water.png
Figure 3: PES for water molecule:
Shows the energy minimum corresponding to optimized molecular structure for water, O−H bond length of 0.0958 nm and H−O−H bond angle of 104.5°

The same concept is applied to organic compounds like ethane, butane etc. to define their lowest energy and most stable conformations.

Characterizing a PES

The most important points on a PES are the stationary points where the surface is flat, i.e. parallel to a horizontal line corresponding to one geometric parameter, a plane corresponding to two such parameters or even a hyper-plane corresponding to more than two geometric parameters. The energy values corresponding to the transition states and the ground state of the reactants and products can be found using the potential energy function by calculating the function's critical points or the stationary points. Stationary points occur when the 1st partial derivative of the energy with respect to each geometric parameter is equal to zero.

Using analytical derivatives of the derived expression for energy, one can find and characterize a stationary point as minimum, maximum or a saddle point. The ground states are represented by local energy minima and the transition states by saddle points.

Minima represent stable or quasi-stable species, i.e. reactants and products with finite lifetime. Mathematically, a minimum point is given as

A point may be local minimum when it is lower in energy compared to its surrounding only or a global minimum which is the lowest energy point on the entire potential energy surface.

Saddle point represents a maximum along only one direction (that of the reaction coordinate) and is a minimum along all other directions. In other words, a saddle point represents a transition state along the reaction coordinate. Mathematically, a saddle point occurs when

for all q except along the reaction coordinate and

along the reaction coordinate.

Figure 4:
Minima (top) and Saddle Point (bottom) on a Potential Energy Surface Minima and Saddle Point.png
Figure 4:
Minima (top) and Saddle Point (bottom) on a Potential Energy Surface

Reaction coordinate diagrams

The intrinsic reaction coordinate [6] (IRC), derived from the potential energy surface, is a parametric curve that connects two energy minima in the direction that traverses the minimum energy barrier (or shallowest ascent) passing through one or more saddle point(s). However, in reality if reacting species attains enough energy it may deviate from the IRC to some extent. [1] The energy values (points on the hyper-surface) along the reaction coordinate result in a 1-D energy surface (a line) and when plotted against the reaction coordinate (energy vs reaction coordinate) gives what is called a reaction coordinate diagram (or energy profile). Another way of visualizing an energy profile is as a cross section of the hyper surface, or surface, long the reaction coordinate. Figure 5 shows an example of a cross section, represented by the plane, taken along the reaction coordinate and the potential energy is represented as a function or composite of two geometric variables to form a 2-D energy surface. In principle, the potential energy function can depend on N variables but since an accurate visual representation of a function of 3 or more variables cannot be produced (excluding level hypersurfaces) a 2-D surface has been shown. The points on the surface that intersect the plane are then projected onto the reaction coordinate diagram (shown on the right) to produce a 1-D slice of the surface along the IRC. The reaction coordinate is described by its parameters, which are frequently given as a composite of several geometric parameters, and can change direction as the reaction progresses so long as the smallest energy barrier (or activation energy (Ea)) is traversed. [1] The saddle point represents the highest energy point lying on the reaction coordinate connecting the reactant and product; this is known as the transition state. A reaction coordinate diagram may also have one or more transient intermediates which are shown by high energy wells connected via a transition state peak. Any chemical structure that lasts longer than the time for typical bond vibrations (10−13 – 10−14s) can be considered as intermediate. [4]

Figure 5:Potential Energy Surface and Corresponding 2-D Reaction Coordinate Diagram derived from the plane passing through the minimum energy pathway between A and C and passing through B Potential Energy Surface and Corresponding Reaction Coordinate Diagram.png
Figure 5:Potential Energy Surface and Corresponding 2-D Reaction Coordinate Diagram derived from the plane passing through the minimum energy pathway between A and C and passing through B

A reaction involving more than one elementary step has one or more intermediates being formed which, in turn, means there is more than one energy barrier to overcome. In other words, there is more than one transition state lying on the reaction pathway. As it is intuitive that pushing over an energy barrier or passing through a transition state peak would entail the highest energy, it becomes clear that it would be the slowest step in a reaction pathway. However, when more than one such barrier is to be crossed, it becomes important to recognize the highest barrier which will determine the rate of the reaction. This step of the reaction whose rate determines the overall rate of reaction is known as rate determining step or rate limiting step. The height of energy barrier is always measured relative to the energy of the reactant or starting material. Different possibilities have been shown in figure 6.

Figure 6:Reaction Coordinate Diagrams showing reactions with 0, 1 and 2 intermediates: The double-headed arrow shows the first, second and third step in each reaction coordinate diagram. In all three of these reactions the first step is the slow step because the activation energy from the reactants to the transition state is the highest. In subsequent steps, the activation energy is only from the intermediate to the next transition state. Reaction Co-ordinate Diagrams for reactions with 0, 1, 2 intermediates.png
Figure 6:Reaction Coordinate Diagrams showing reactions with 0, 1 and 2 intermediates: The double-headed arrow shows the first, second and third step in each reaction coordinate diagram. In all three of these reactions the first step is the slow step because the activation energy from the reactants to the transition state is the highest. In subsequent steps, the activation energy is only from the intermediate to the next transition state.

Reaction coordinate diagrams also give information about the equilibrium between a reactant or a product and an intermediate. If the barrier energy for going from intermediate to product is much higher than the one for reactant to intermediate transition, it can be safely concluded that a complete equilibrium is established between the reactant and intermediate. However, if the two energy barriers for reactant-to-intermediate and intermediate-to-product transformation are nearly equal, then no complete equilibrium is established and steady state approximation is invoked to derive the kinetic rate expressions for such a reaction. [7]

Figure 7: Reaction Coordinate Diagrams: Reaction with equilibrium between reactant and intermediate (left) and one with no such equilibrium (right) Reaction Coordinate Diagrams showing equilibrium.png
Figure 7: Reaction Coordinate Diagrams: Reaction with equilibrium between reactant and intermediate (left) and one with no such equilibrium (right)

Drawing a reaction coordinate diagram

Although a reaction coordinate diagram is essentially derived from a potential energy surface, it is not always feasible to draw one from a PES. A chemist draws a reaction coordinate diagram for a reaction based on the knowledge of free energy or enthalpy change associated with the transformation which helps him to place the reactant and product into perspective and whether any intermediate is formed or not. One guideline for drawing diagrams for complex reactions is the principle of least motion which says that a favored reaction proceeding from a reactant to an intermediate or from one intermediate to another or product is one which has the least change in nuclear position or electronic configuration. Thus, it can be said that the reactions involving dramatic changes in position of nuclei actually occur through a series of simple chemical reactions. Hammond postulate is another tool which assists in drawing the energy of a transition state relative to a reactant, an intermediate or a product. It states that the transition state resembles the reactant, intermediate or product that it is closest in energy to, as long the energy difference between the transition state and the adjacent structure is not too large. This postulate helps to accurately predict the shape of a reaction coordinate diagram and also gives an insight into the molecular structure at the transition state.

Kinetic and thermodynamic considerations

A chemical reaction can be defined by two important parameters- the Gibbs free energy associated with a chemical transformation and the rate of such a transformation. These parameters are independent of each other. While free energy change describes the stability of products relative to reactants, the rate of any reaction is defined by the energy of the transition state relative to the starting material. Depending on these parameters, a reaction can be favorable or unfavorable, fast or slow and reversible or irreversible, as shown in figure 8.

A favorable reaction is one in which the change in free energy ∆G° is negative (exergonic) or in other words, the free energy of product, G°product, is less than the free energy of the starting materials, G°reactant. ∆G°> 0 (endergonic) corresponds to an unfavorable reaction. The ∆G° can be written as a function of change in enthalpy (∆H°) and change in entropy (∆S°) as G°= ∆H° – TS°. Practically, enthalpies, not free energy, are used to determine whether a reaction is favorable or unfavorable, because ∆H° is easier to measure and TS° is usually too small to be of any significance (for T < 100 °C). A reaction with ∆H°<0 is called exothermic reaction while one with ∆H°>0 is endothermic.

Figure 8: Reaction Coordinate Diagrams showing favorable or unfavorable and slow or fast reactions Kinetic and Thermodynamic Considerations for a Chemical Reaction.png
Figure 8: Reaction Coordinate Diagrams showing favorable or unfavorable and slow or fast reactions

The relative stability of reactant and product does not define the feasibility of any reaction all by itself. For any reaction to proceed, the starting material must have enough energy to cross over an energy barrier. This energy barrier is known as activation energy (∆G) and the rate of reaction is dependent on the height of this barrier. A low energy barrier corresponds to a fast reaction and high energy barrier corresponds to a slow reaction. A reaction is in equilibrium when the rate of forward reaction is equal to the rate of reverse reaction. Such a reaction is said to be reversible. If the starting material and product(s) are in equilibrium then their relative abundance is decided by the difference in free energy between them. In principle, all elementary steps are reversible, but in many cases the equilibrium lies so much towards the product side that the starting material is effectively no longer observable or present in sufficient concentration to have an effect on reactivity. Practically speaking, the reaction is considered to be irreversible.

While most reversible processes will have a reasonably small K of 103 or less, this is not a hard and fast rule, and a number of chemical processes require reversibility of even very favorable reactions. For instance, the reaction of an carboxylic acid with amines to form a salt takes place with K of 105–6, and at ordinary temperatures, this process is regarded as irreversible. Yet, with sufficient heating, the reverse reaction takes place to allow formation of the tetrahedral intermediate and, ultimately, amide and water. (For an extreme example requiring reversibility of a step with K > 1011, see demethylation.) A reaction can also be rendered irreversible if a subsequent, faster step takes place to consume the initial product(s), or a gas is evolved in an open system. Thus, there is no value of K that serves as a "dividing line" between reversible and irreversible processes. Instead, reversibility depends on timescale, temperature, the reaction conditions, and the overall energy landscape.

When a reactant can form two different products depending on the reaction conditions, it becomes important to choose the right conditions to favor the desired product. If a reaction is carried out at relatively lower temperature, then the product formed is one lying across the smaller energy barrier. This is called kinetic control and the ratio of the products formed depends on the relative energy barriers leading to the products. Relative stabilities of the products do not matter. However, at higher temperatures the molecules have enough energy to cross over both energy barriers leading to the products. In such a case, the product ratio is determined solely by the energies of the products and energies of the barrier do not matter. This is known as thermodynamic control and it can only be achieved when the products can inter-convert and equilibrate under the reaction condition. A reaction coordinate diagram can also be used to qualitatively illustrate kinetic and thermodynamic control in a reaction.

Figure 9:Kinetic and Thermodynamic Control: A. Product B is both the kinetic and thermodynamic product and B. Product A is the kinetic product while B is the thermodynamic product. Kinetic and thermodynamic Control.png
Figure 9:Kinetic and Thermodynamic Control: A. Product B is both the kinetic and thermodynamic product and B. Product A is the kinetic product while B is the thermodynamic product.

Applications

Following are few examples on how to interpret reaction coordinate diagrams and use them in analyzing reactions.


Solvent Effect: In general, if the transition state for the rate determining step corresponds to a more charged species relative to the starting material then increasing the polarity of the solvent will increase the rate of the reaction since a more polar solvent be more effective at stabilizing the transition state (ΔG would decrease). If the transition state structure corresponds to a less charged species then increasing the solvents polarity would decrease the reaction rate since a more polar solvent would be more effective at stabilizing the starting material (ΔGo would decrease which in turn increases ΔG). [8]

SN1 vs SN2

The SN1 and SN2 mechanisms are used as an example to demonstrate how solvent effects can be indicated in reaction coordinate diagrams.

Figure 10: Shows an energy profile for the RDS in an SN1 mechanism when the solvent is changed from a more polar solvent (shown in red) to a less polar solvent (shown in blue). Note the transition state structure shown has partial charge. FinalSN1RDS.png
Figure 10: Shows an energy profile for the RDS in an SN1 mechanism when the solvent is changed from a more polar solvent (shown in red) to a less polar solvent (shown in blue). Note the transition state structure shown has partial charge.
Figure 11: Shows the effects that solvent polarity has on an SN2 mechanism. The polar solvent is shown in red and the non-polar solvent is shown in blue Solvent effect SN1 mechanism.png
Figure 11: Shows the effects that solvent polarity has on an SN2 mechanism. The polar solvent is shown in red and the non-polar solvent is shown in blue

Catalysts: There are two types of catalysts, positive and negative. Positive catalysts increase the reaction rate and negative catalysts (or inhibitors) slow down a reaction and possibly cause the reaction not occur at all. The purpose of a catalyst is to alter the activation energy. Figure 12 illustrates the purpose of a catalyst in that only the activation energy is changed and not the relative thermodynamic stabilities, shown in the figure as ΔH, of the products and reactants. This means that a catalyst will not alter the equilibrium concentrations of the products and reactants but will only allow the reaction to reach equilibrium faster. Figure 13 shows the catalyzed pathway occurring in multiple steps which is a more realistic depiction of a catalyzed process. The new catalyzed pathway can occur through the same mechanism as the uncatalyzed reaction or through an alternate mechanism. [4] An enzyme is a biological catalyst that increases the rate for many vital biochemical reactions. Figure 13 shows a common way to illustrate the effect of an enzyme on a given biochemical reaction. [11]

Figure 12: An energy profile, showing the products (Y), reactants (X), activation energy (Ea) for the endothermic and exothermic reaction, and the enthalpy (DH). The profile for same reaction but with a catalyst is also shown. Activation energy.svg
Figure 12: An energy profile, showing the products (Y), reactants (X), activation energy (Ea) for the endothermic and exothermic reaction, and the enthalpy (ΔH). The profile for same reaction but with a catalyst is also shown.
Figure 13: An energy profile diagram demonstrating the effect of a catalyst for the generic exothermic reaction of X + Y -Z. The catalyst offers an alternate reaction pathway (shown in red) where the rate determining step has a smaller DG[?]. The relative thermodynamic stabilities remain the same. Catalysis- Reaction progress.png
Figure 13: An energy profile diagram demonstrating the effect of a catalyst for the generic exothermic reaction of X + Y →Z. The catalyst offers an alternate reaction pathway (shown in red) where the rate determining step has a smaller ΔG≠. The relative thermodynamic stabilities remain the same.

See also

Related Research Articles

In a chemical reaction, chemical equilibrium is the state in which both the reactants and products are present in concentrations which have no further tendency to change with time, so that there is no observable change in the properties of the system. This state results when the forward reaction proceeds at the same rate as the reverse reaction. The reaction rates of the forward and backward reactions are generally not zero, but they are equal. Thus, there are no net changes in the concentrations of the reactants and products. Such a state is known as dynamic equilibrium.

<span class="mw-page-title-main">Chemical reaction</span> Process that results in the interconversion of chemical species

A chemical reaction is a process that leads to the chemical transformation of one set of chemical substances to another. Classically, chemical reactions encompass changes that only involve the positions of electrons in the forming and breaking of chemical bonds between atoms, with no change to the nuclei, and can often be described by a chemical equation. Nuclear chemistry is a sub-discipline of chemistry that involves the chemical reactions of unstable and radioactive elements where both electronic and nuclear changes can occur.

<span class="mw-page-title-main">Activation energy</span> Minimum amount of energy that must be provided for a system to undergo a reaction or process

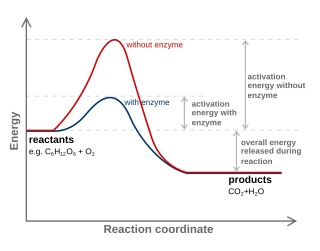
In the Arrhenius model of reaction rates, activation energy is the minimum amount of energy that must be available to reactants for a chemical reaction to occur. The activation energy (Ea) of a reaction is measured in kilojoules per mole (kJ/mol) or kilocalories per mole (kcal/mol). Activation energy can be thought of as the magnitude of the potential barrier (sometimes called the energy barrier) separating minima of the potential energy surface pertaining to the initial and final thermodynamic state. For a chemical reaction to proceed at a reasonable rate, the temperature of the system should be high enough such that there exists an appreciable number of molecules with translational energy equal to or greater than the activation energy. The term "activation energy" was introduced in 1889 by the Swedish scientist Svante Arrhenius.

<span class="mw-page-title-main">Reaction rate</span> Speed at which a chemical reaction takes place

The reaction rate or rate of reaction is the speed at which a chemical reaction takes place, defined as proportional to the increase in the concentration of a product per unit time and to the decrease in the concentration of a reactant per unit time. Reaction rates can vary dramatically. For example, the oxidative rusting of iron under Earth's atmosphere is a slow reaction that can take many years, but the combustion of cellulose in a fire is a reaction that takes place in fractions of a second. For most reactions, the rate decreases as the reaction proceeds. A reaction's rate can be determined by measuring the changes in concentration over time.

Chemical kinetics, also known as reaction kinetics, is the branch of physical chemistry that is concerned with understanding the rates of chemical reactions. It is different from chemical thermodynamics, which deals with the direction in which a reaction occurs but in itself tells nothing about its rate. Chemical kinetics includes investigations of how experimental conditions influence the speed of a chemical reaction and yield information about the reaction's mechanism and transition states, as well as the construction of mathematical models that also can describe the characteristics of a chemical reaction.

In chemistry, a reaction mechanism is the step by step sequence of elementary reactions by which overall chemical reaction occurs.

<span class="mw-page-title-main">Activated complex</span>

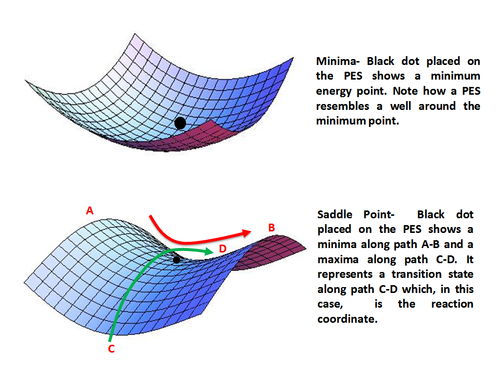
In chemistry, an activated complex represents a collection of intermediate structures in a chemical reaction when bonds are breaking and forming. The activated complex is an arrangement of atoms in an arbitrary region near the saddle point of a potential energy surface. The region represents not one defined state, but a range of unstable configurations that a collection of atoms pass through between the reactants and products of a reaction. Activated complexes have partial reactant and product character, which can significantly impact their behaviour in chemical reactions.

<span class="mw-page-title-main">Transition state</span> Configuration of a chemical reaction when potential energy is greatest

In chemistry, the transition state of a chemical reaction is a particular configuration along the reaction coordinate. It is defined as the state corresponding to the highest potential energy along this reaction coordinate. It is often marked with the double dagger (‡) symbol.

<span class="mw-page-title-main">Reaction coordinate</span> Abstract coordinate depicting chemical reaction progress

In chemistry, a reaction coordinate is an abstract one-dimensional coordinate chosen to represent progress along a reaction pathway. Where possible it is usually a geometric parameter that changes during the conversion of one or more molecular entities, such as bond length or bond angle. For example, in the homolytic dissociation of molecular hydrogen, an apt choice would be the coordinate corresponding to the bond length. Non-geometric parameters such as bond order are also used, but such direct representation of the reaction process can be difficult, especially for more complex reactions.

In chemical kinetics, the overall rate of a reaction is often approximately determined by the slowest step, known as the rate-determining step or rate-limiting step. For a given reaction mechanism, the prediction of the corresponding rate equation is often simplified by using this approximation of the rate-determining step.

<span class="mw-page-title-main">Franck–Condon principle</span> Quantum chemistry rule regarding vibronic transitions

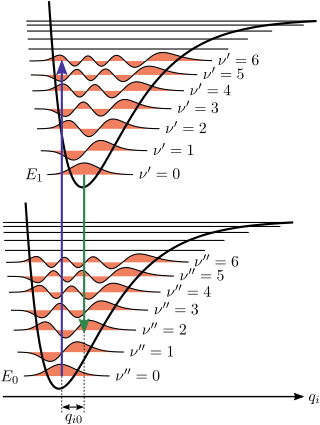
The Franck–Condon principle is a rule in spectroscopy and quantum chemistry that explains the intensity of vibronic transitions. The principle states that during an electronic transition, a change from one vibrational energy level to another will be more likely to happen if the two vibrational wave functions overlap more significantly.

<span class="mw-page-title-main">Potential energy surface</span> Function describing the energy of a physical system in terms of certain parameters

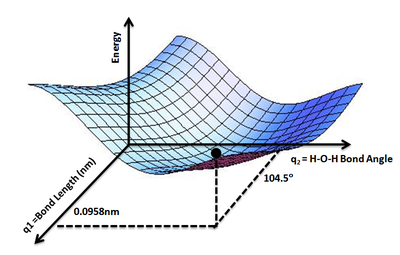
A potential energy surface (PES) or energy landscape describes the energy of a system, especially a collection of atoms, in terms of certain parameters, normally the positions of the atoms. The surface might define the energy as a function of one or more coordinates; if there is only one coordinate, the surface is called a potential energy curve or energy profile. An example is the Morse/Long-range potential.

In theoretical chemistry, Marcus theory is a theory originally developed by Rudolph A. Marcus, starting in 1956, to explain the rates of electron transfer reactions – the rate at which an electron can move or jump from one chemical species (called the electron donor) to another (called the electron acceptor). It was originally formulated to address outer sphere electron transfer reactions, in which the two chemical species only change in their charge with an electron jumping (e.g. the oxidation of an ion like Fe2+/Fe3+), but do not undergo large structural changes. It was extended to include inner sphere electron transfer contributions, in which a change of distances or geometry in the solvation or coordination shells of the two chemical species is taken into account (the Fe-O distances in Fe(H2O)2+ and Fe(H2O)3+ are different).

The Curtin–Hammett principle is a principle in chemical kinetics proposed by David Yarrow Curtin and Louis Plack Hammett. It states that, for a reaction that has a pair of reactive intermediates or reactants that interconvert rapidly, each going irreversibly to a different product, the product ratio will depend both on the difference in energy between the two conformers and the energy barriers from each of the rapidly equilibrating isomers to their respective products. Stated another way, the product distribution reflects the difference in energy between the two rate-limiting transition states. As a result, the product distribution will not necessarily reflect the equilibrium distribution of the two intermediates. The Curtin–Hammett principle has been invoked to explain selectivity in a variety of stereo- and regioselective reactions. The relationship between the (apparent) rate constants and equilibrium constant is known as the Winstein-Holness equation.

<span class="mw-page-title-main">Hammond's postulate</span> Hypothesis in physical organic chemistry

Hammond's postulate, is a hypothesis in physical organic chemistry which describes the geometric structure of the transition state in an organic chemical reaction. First proposed by George Hammond in 1955, the postulate states that:

If two states, as, for example, a transition state and an unstable intermediate, occur consecutively during a reaction process and have nearly the same energy content, their interconversion will involve only a small reorganization of the molecular structures.

<span class="mw-page-title-main">Transition state theory</span> Theory describing the reaction rates of elementary chemical reactions

In chemistry, transition state theory (TST) explains the reaction rates of elementary chemical reactions. The theory assumes a special type of chemical equilibrium (quasi-equilibrium) between reactants and activated transition state complexes.

Physical organic chemistry, a term coined by Louis Hammett in 1940, refers to a discipline of organic chemistry that focuses on the relationship between chemical structures and reactivity, in particular, applying experimental tools of physical chemistry to the study of organic molecules. Specific focal points of study include the rates of organic reactions, the relative chemical stabilities of the starting materials, reactive intermediates, transition states, and products of chemical reactions, and non-covalent aspects of solvation and molecular interactions that influence chemical reactivity. Such studies provide theoretical and practical frameworks to understand how changes in structure in solution or solid-state contexts impact reaction mechanism and rate for each organic reaction of interest.

More O’Ferrall–Jencks plots are two-dimensional representations of multiple reaction coordinate potential energy surfaces for chemical reactions that involve simultaneous changes in two bonds. As such, they are a useful tool to explain or predict how changes in the reactants or reaction conditions can affect the position and geometry of the transition state of a reaction for which there are possible competing pathways.

<span class="mw-page-title-main">George S. Hammond</span> American chemist (1921–2005)

George Simms Hammond was an American scientist and theoretical chemist who developed "Hammond's postulate", and fathered organic photochemistry,–the general theory of the geometric structure of the transition state in an organic chemical reaction. Hammond's research is also known for its influence on the philosophy of science. His research garnered him the Norris Award in 1968, the Priestley Medal in 1976, the National Medal of Science in 1994, and the Othmer Gold Medal in 2003. He served as the executive chairman of the Allied Chemical Corporation from 1979 to 1989.

In chemistry, solvent effects are the influence of a solvent on chemical reactivity or molecular associations. Solvents can have an effect on solubility, stability and reaction rates and choosing the appropriate solvent allows for thermodynamic and kinetic control over a chemical reaction.

References

  1. 1 2 3 4 5 6 Lewars, E.G. (2011). Computational Chemistry. Springer. pp. 9–43. ISBN   978-9048138616.
  2. 1 2 Szabo, Attila; Ostlund, Neil (1989). Modern Quantum Chemistry: Introduction to Advanced Electronic Structure Theory. Dover. ISBN   0-486-69186-1.
  3. 1 2 3 4 Sherrill, David. "Potential Energy Surfaces" (PDF). Retrieved 2013-10-27.
  4. 1 2 3 4 5 6 7 Anslyn, Dougherty, Eric, Dennis (2006). Modern Physical Organic Chemistry. University Science Books. ISBN   1-891389-31-9.{{cite book}}: CS1 maint: multiple names: authors list (link)
  5. Sherrill, David. "Introduction to Molecular Mechanics" (PDF).
  6. IUPAC , Compendium of Chemical Terminology , 2nd ed. (the "Gold Book") (1997). Online corrected version: (2006) " Intrinsic reaction coordinate ". doi : 10.1351/goldbook.IT07057
  7. 1 2 Grossman, Robert (31 July 2007). The Art of Writing Reasonable Organic Reaction Mechanisms, 2nd ed. Springer. ISBN   978-0-387-95468-4.
  8. Bruice, Paula (2007). Organic Chemistry, 5th ed. NJ: Pearson Prentice Hall. ISBN   978-0-13-196316-0.
  9. Neuman, Robert (2013). Organic Chemistry. Robert C. Neuman, Jr. pp. Ch.7, 1–71.
  10. Organic Chemistry Portal. "Nucleophilic Substitution" . Retrieved 2013-10-25.
  11. Silverman, Richard (2004). The Organic Chemistry of Drug Design and Drug Action, 2nd ed. Elsevier. p.  178. ISBN   0-12-643732-7.