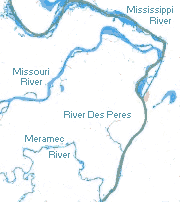
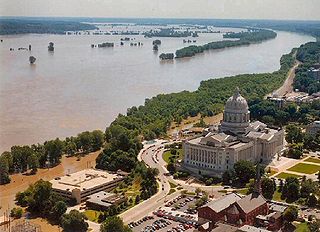
The city is built primarily on bluffs and terraces that rise 100–200 feet (30–61m) above the western banks of the Mississippi River, just south of the Missouri-Mississippi confluence. Much of the area is a fertile and gently rolling prairie that features low hills and broad, shallow valleys. Both the Mississippi River and the Missouri River have cut large valleys with wide flood plains.
Limestone and dolomite of the Mississippianepoch underlies the area and much of the city is a karst area, with numerous sinkholes and caves, although most of the caves have been sealed shut; many springs are visible along the riverfront. Significant deposits of coal, brickclay, and millerite ore were once mined in the city, and the predominant surface rock, the St. Louis Limestone, is used as dimension stone and rubble for construction.
The St. Louis Geologic fault is exposed along the bluffs and was the source of several historic minor earthquakes; it is part of the St. Louis Anticline which has some petroleum and natural gas deposits outside of the city. St. Louis is also just north of the New Madrid Seismic Zone which in 1811–12 produced a series of earthquakes that are the largest known in the contiguous United States. Seismologists estimate 90% probability of a magnitude 6.0 earthquake by 2040 and 7-10% probability of a magnitude 8.0,[2] such tremors could create significant damage across a large region of the central U.S. including St. Louis.
Near the southern boundary of the City of St. Louis (separating it from St. Louis County) is the River des Peres, virtually the only river or stream within the city limits that is not entirely underground. Most of River des Peres was either channelized or put underground in the 1920s and early 1930s. The lower section of the river was the site of some of the worst flooding of the Great Flood of 1993.
According to the United States Census Bureau, the city has a total area of 171.3km2 (66.2mi2). 160.4km2 (61.9mi2) of it is land and 11.0km2 (4.2mi2 or 6.39%) of it is water.
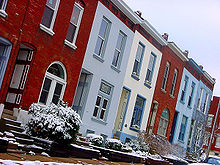
The city is divided into 79 neighborhoods. The divisions have no legal standing, although some neighborhood associations administer grants or hold veto power over historic-district development. Nevertheless, the social and political influence of neighborhood identity is profound. Some hold avenues of massive stone edifices built as palaces for heads of state visiting the 1904 World's Fair. Others offer tidy working-class bungalows, loft districts, or areas hard-hit by social problems and unemployment. Many of them have retained - quite consciously and deliberately - a camaraderie that is missing from many American towns today.
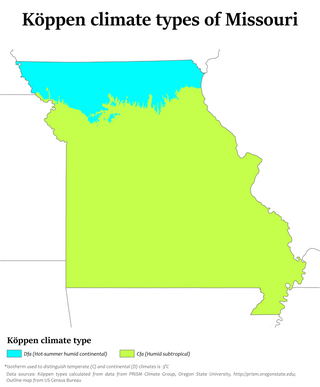
The climate is humid subtropical (Köppen: Cfa), but all around Greater St. Louis has a humid continental climate (Dfa) through the USA isoterm, with a winter that sustains in the coldest month temperatures below 0 °C more easily, clear evidence of an urban heat island, which in the future may cover an even larger area and agglutinate cities and villages to the south.[5] It straddles the border between USDA Plant Hardiness Zones 6B and 7A,[6] indicating the coldest temperature of the year is typically around 0°F (−18°C). With neither large mountains nor large bodies of water to moderate its temperature, it is subject to both cold Arctic air and hot, humid tropical air from the Gulf of Mexico. The city has four distinct seasons. Spring is the wettest season and produces severe weather ranging from tornadoes to winter storms. Summers are hot and humid; temperatures of 90°F (32°C) or higher occur 43 days a year.[7] The average window for such temperatures is May 19 thru September 14.[4]
Fall is mild with lower humidity and can produce intermittent bouts of heavy rainfall with the first freeze of the season on average falling on November 2 (the last on average falls on April 3); the first measurable (0.1 inches (0.25cm)) snow, often not counting flurries, on average occurs on December 4 (the last on average falls on March 17). Winters can be cold and snowy with temperatures frequently below freezing. Winter storm systems, such as Alberta clippers and Panhandle hooks, can bring days of heavy freezing rain, ice pellets, and snowfall.
The average annual temperature recorded at nearby Lambert–St. Louis International Airport, is 57.1°F (13.9°C), and average precipitation is about 41.0 inches (1,040mm). The daily average temperature in July is 80.0°F (26.7°C), while in January it is 31.8°F (−0.1°C), although this varies from year to year. Both 100°F (37.8°C) and 0°F (−17.8°C) temperatures can be seen on an average 2 or 3 days per year. The official record low is −22°F (−30°C) on January 5, 1884, although there were unofficial readings of −23°F (−31°C) on January 29, 1873; and the record high is 115°F (46°C) on July 14, 1954;[8] the coldest high on record was −5°F (−21°C) on December 24, 1983, while, conversely, the warmest low on record was 86°F (30°C) on July 25, 2012 and July 24, 1901. July 2012 was the hottest month in the 138-year recorded weather temperatures in St. Louis history starting in 1874, with an average daily temperature of 88.1°F (31.2°C).[8] Average annual temperatures are "about 3 degrees warmer" overall than they were in the 1920s.[9]
Winter (December through February) is the driest season, with an average 7.5in (191mm) of precipitation. The average seasonal snowfall is 18.2 inches (46cm), typically falling from December to March. The heaviest one-day snowfall total was 12.8in (32.5cm) on February 26, 1906. Spring (March through May) is typically the wettest season, with 4.7in (119mm) of precipitation; however, the heaviest 24-hour rainfall total was 9.04in (229.6mm) on July 26, 2022. Dry spells lasting one to two weeks are common during the growing seasons.
St. Louis experiences thunderstorms 48 days a year on average.[10] Especially in the spring, these storms can often be severe, with high winds, large hail and tornadoes. Lying within the hotbed of Tornado Alley, St. Louis reigns as one of the most frequently tornadic metropolitan areas, and has an extensive history of particularly damaging tornadoes. Severe flooding, such as the Great Flood of 1993, may occur in spring and summer; the (often rapid) melting of thick snow cover upstream either the Missouri or Mississippi Rivers can contribute to springtime flooding.
Some late autumns feature the warm weather known as Indian summer; some years see roses in bloom as late as early December.
Before the founding of the city, the area was prairie and open forest maintained by burning by Native Americans. Trees are mainly oak, maple, and hickory, similar to the forests of the nearby Ozarks; common understory trees include eastern redbud, serviceberry, and flowering dogwood. Riparian areas are forested with mainly American sycamore. Most of the residential area of the city is planted with large native shade trees. The largest native forest area is found in Forest Park. In autumn, the changing color of the trees is notable. Most species here are typical of the Eastern Woodland, although numerous decorative non-native species are found; the most notable invasive species is Japanese honeysuckle, which is actively removed from some parks.
Frogs are commonly found in the springtime, especially after extensive wet periods. Common species include the American toad and species of chorus frogs, commonly called "spring peepers" that are found in nearly every pond. Some years have outbreaks of cicadas or ladybugs. Mosquitos and houseflies are common insect nuisances; because of this, windows are nearly universally fitted with screens, and "screened-in" porches are common in homes of the area. Populations of honey bees have sharply declined in recent years, and numerous species of pollinator insects have filled their ecological niche.
Adjacent communities
The following communities border the city of St. Louis directly:
St. Louis is an independent city in the U.S. state of Missouri. It is located near the confluence of the Mississippi and the Missouri rivers. In 2020, the city proper had a population of 301,578, while its metropolitan area, which extends into Illinois, had an estimated population of over 2.8 million. It is the largest metropolitan area in Missouri and the second-largest in Illinois. The city's combined statistical area is the 20th-largest in the United States.
St. Louis County is located in the eastern-central portion of Missouri. It is bounded by the City of St. Louis and the Mississippi River to the east, the Missouri River to the north, and the Meramec River to the south. At the 2020 census, the total population was 1,004,125, making it the most populous county in Missouri. Its county seat is Clayton. The county is included in the St. Louis, MO–IL metropolitan statistical area.
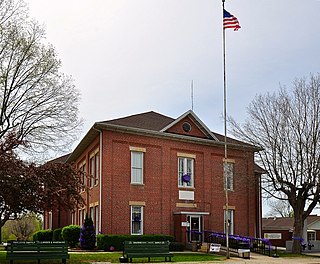
Bollinger County is a county located in the southeastern part of the U.S. state of Missouri. As of the 2020 census, the county's population was 10,567. The county seat, largest and only city, is Marble Hill. The largely rural county is supported by agriculture and construction. The county was officially organized in March 1851 from portions of Wayne, Cape Girardeau and Stoddard Counties, and named in honor of George Frederick Bollinger, an early settler.
Monroe County is a county located in the U.S. state of Illinois. According to the 2020 census, it had a population of 34,962. Its county seat and largest city is Waterloo.
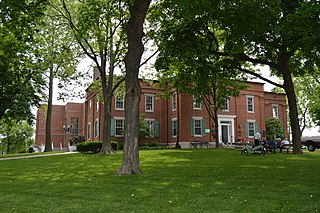
Jersey County is a county located in the U.S. state of Illinois. At the 2020 census, it had a population of 21,512. The county seat and largest community is Jerseyville, with a population of 8,337 in 2010. The county's smallest incorporated community is Otterville, with a population of 87.
Van Buren is the second-largest city in the Fort Smith, Arkansas–Oklahoma Metropolitan Statistical Area and the county seat of Crawford County, Arkansas, United States. The city is located directly northeast of Fort Smith at the Interstate 40 – Interstate 540 junction. The city was incorporated in 1845 and as of the 2020 census had a population of 23,218, ranking it as the state's 21st largest city. According to 2023 population estimates from the U.S. Census Bureau, Van Buren’s population is 24,138. With a 4% growth rate from 2020 to 2023, Van Buren is Arkansas’s eighth-fastest growing city.
Grafton is the oldest city in Jersey County, Illinois, United States. It is located near the confluence of the Illinois and Mississippi Rivers. As of the 2020 census, the city had a total population of 626. Prior to the Great Flood of 1993, Grafton had enjoyed a stable population of nearly 1,000 residents.
Harrisburg is a city in and the county seat of Saline County, Illinois, United States. It is located about 57 miles southwest of Evansville, Indiana, and 111 mi (179 km) southeast of St. Louis, Missouri. Its 2020 population was 8,219, and the surrounding Harrisburg Township had a population of 10,037, including the city residents. Harrisburg is included in the Illinois–Indiana–Kentucky tri-state area and is the principal city in the Harrisburg micropolitan statistical area with a combined population of 24,913.
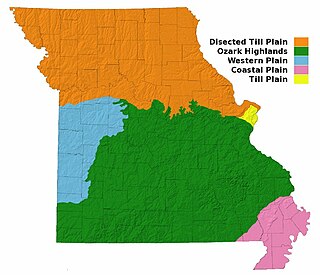
Missouri, a state near the geographical center of the United States, has three distinct physiographic divisions:
Missouri generally has a variety of seasonal humid subtropical climate, with cool winters and long, hot summers. In the southern part of the state, particularly in the Bootheel, the climate borders on a more mild-type humid subtropical climate, and in the northern third, the state transitions into a humid continental climate. Because of its location in the interior United States, Missouri often experiences extremes in temperatures. Lacking either large mountains or oceans nearby to moderate its temperature, its climate is alternately influenced by air from the cold Arctic and the hot and humid Gulf of Mexico.
Southern Illinois is a region of the U.S. state of Illinois comprising the southern third of the state, principally south of Interstate 70. Part of downstate Illinois, it is bordered by the two most voluminous rivers in the United States: the Mississippi below its connection with the Missouri River to the west and the Ohio River to the east and south, with the Wabash as a tributary. Some areas of Southern Illinois are known historically as Little Egypt.
The Great Flood of 1993 was a flood that occurred in the Midwestern United States, along the Mississippi and Missouri rivers and their tributaries, from April to October 1993.
Illinois is in the midwestern United States. Surrounding states are Wisconsin to the north, Iowa and Missouri to the west, Kentucky to the east and south, and Indiana to the east. Illinois also borders Michigan, but only via a northeastern water boundary in Lake Michigan. Nearly the entire western boundary of Illinois is the Mississippi River, except for a few areas where the river has changed course. Illinois' southeastern and southern boundary is along the Wabash River and the Ohio River, whereas its northern boundary and much of its eastern boundary are straight survey lines. Illinois has a maximum north–south distance of 390 miles (630 km) and 210 miles (340 km) east-west. Its total area is 57,918 square miles (150,010 km2).
The climate of Minneapolis–Saint Paul is the long term weather trends and historical events of the Minneapolis–Saint Paul metropolitan area in east central Minnesota. Minneapolis and St. Paul, together known as the Twin Cities, are the core of the 15th largest metropolitan area in the United States. With a population of 3.6 million people, the region contains approximately 60% of the population of Minnesota. Due to its location in the northern and central portion of the U.S., the Twin Cities has the coldest average temperature of any major metropolitan area in the nation. Winters are very cold, summer is warm and humid, snowfall is common in the winter and thunderstorms with heavy rainfall occur during the spring, summer and autumn. Though winter can be cold, the area receives more sunlight hours in mid-winter than many other warmer parts of the country, including all of the Great Lakes states, the Pacific Northwest, parts of the South, and almost all of the Northeast. Unless otherwise indicated, all normals data presented below are based on data at Minneapolis/St. Paul International Airport, the official Twin Cities climatology station, from the 1981−2010 normals period.
Minnesota has a humid continental climate, with hot summers and cold winters. Minnesota's location in the Upper Midwest allows it to experience some of the widest variety of weather in the United States, with each of the four seasons having its own distinct characteristics. The area near Lake Superior in the Minnesota Arrowhead region experiences weather unique from the rest of the state. The moderating effect of Lake Superior keeps the surrounding area relatively cooler in the summer and warmer in the winter, giving that region a smaller yearly temperature variation. On the Köppen climate classification, much of the southern third of Minnesota—roughly from the Twin Cities region southward—falls in the hot summer zone (Dfa), and the northern two-thirds of Minnesota falls in the warm summer zone (Dfb).
Dallas is located in North Texas, built along the Trinity River. It has a humid subtropical climate that is characteristic of the southern plains of the United States. Dallas experiences mild winters and hot summers.
The geography of Omaha, Nebraska is characterized by its riverfront position alongside the Missouri River. The city's geography, with its proximity to the river was a factor in making Omaha the "Gateway of the West" from which thousands of settlers traveled into the American West during the 19th century. Environmental issues include more than one hundred years of industrial smelting along the riverfront along with the continuous impact of suburban sprawl on the city's west side. The city's climate is temperate.
The geography of Arkansas varies widely. The state is covered by mountains, river valleys, forests, lakes, and bayous in addition to the cities of Arkansas. Hot Springs National Park features bubbling springs of hot water, formerly sought across the country for their healing properties. Crowley's Ridge is a geological anomaly rising above the surrounding lowlands of the Mississippi embayment.
From May 3 to May 11, 2003, a prolonged and destructive series of tornado outbreaks affected much of the Great Plains and Eastern United States. Most of the severe activity was concentrated between May 4 and May 10, which saw more tornadoes than any other week-long span in recorded history; 335 tornadoes occurred during this period, concentrated in the Ozarks and central Mississippi River Valley. Additional tornadoes were produced by the same storm systems from May 3 to May 11, producing 363 tornadoes overall, of which 62 were significant. Six of the tornadoes were rated F4, and of these four occurred on May 4, the most prolific day of the tornado outbreak sequence; these were the outbreak's strongest tornadoes. Damage caused by the severe weather and associated flooding amounted to US$4.1 billion, making it the costliest U.S. tornado outbreak of the 2000s. A total of 50 deaths and 713 injuries were caused by the severe weather, with a majority caused by tornadoes; the deadliest tornado was an F4 that struck Madison and Henderson counties in Tennessee, killing 11. In 2023, tornado expert Thomas P. Grazulis created the outbreak intensity score (OIS) as a way to rank various tornado outbreaks. The tornado outbreak sequence of May 2003 received an OIS of 232, making it the fourth worst tornado outbreak in recorded history.
Climate change in Missouri encompasses the effects of climate change, attributed to man-made increases in atmospheric carbon dioxide, in the U.S. state of Missouri.
↑ "Station Name: MO ST LOUIS LAMBERT INTL AP". U.S. Climate Normals 2020: U.S. Monthly Climate Normals (1991–2020). National Oceanic and Atmospheric Administration. Retrieved July 22, 2021.
↑ Mean monthly maxima and minima (i.e. the highest and lowest temperature readings during an entire month or year) calculated based on data at said location from 1991 to 2020.
↑ Official records for St. Louis were kept at the Weather Bureau Office from January 1874 to December 1892, Eads Bridge from January 1893 to December 1929, and at Lambert–St. Louis Int'l since January 1930.[11]
This page is based on this Wikipedia article Text is available under the CC BY-SA 4.0 license; additional terms may apply. Images, videos and audio are available under their respective licenses.