Groveland, California

Last updated

Groveland
Groveland Historic District-2.jpg
Groveland California in 2012
Tuolumne County California Incorporated and Unincorporated areas Groveland Highlighted 0631372.svg
Location of Groveland in Tuolumne County, California.
USA California location map.svg
Red pog.svg
Groveland
Position in California.
Coordinates: 37°49′54″N120°15′12″W / 37.83167°N 120.25333°W / 37.83167; -120.25333
Country Flag of the United States (23px).png  United States
State Flag of California.svg  California
County Tuolumne
Area
[1]
  Total
9.579 sq mi (24.811 km2)
  Land9.574 sq mi (24.796 km2)
  Water0.006 sq mi (0.015 km2)  0.06%
Elevation
[2]
3,064 ft (934 m)
Population
 (2020)
  Total
540
  Density56/sq mi (22/km2)
Time zone UTC-8 (Pacific (PST))
  Summer (DST) UTC-7 (PDT)
ZIP Code
95321
Area code 209
GNIS feature ID2628856 [2]
Reference no.446

Groveland is a census-designated place (CDP) in Tuolumne County, California. [2] The 2020 United States census reported Groveland's population was 540. [3]

Contents

Groveland was created as a CDP prior to the 2010 census; previously it was part of Groveland-Big Oak Flat CDP.

History

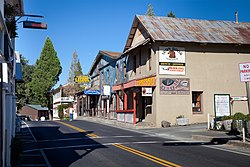
Groveland has always been an important stop on the highway to Yosemite but really grew in the early 1900s with the development of the Tuolumne River Hetch-Hetchy water project for the city of San Francisco. Groveland is adjacent to the Stanislaus National Forest and is known for the historic Iron Door Saloon.

Groveland was originally a gold rush town and then became a sleepy farming community until the San Francisco Hetch Hetchy water project made it their headquarters and built a railroad yard and hospital for the work crews (both now gone). From 1915 till 1935, Groveland was a boom town supporting seven hotels, 10,000 residents and much activity. When the work crews left, the town again became a minor stop on the way to Yosemite until the Boise Cascade company built the Pine Mountain Lake community with a first class golf course, an airport and lake and staked out 5,000 lots. This development has since grown from a summer home area to a retirement community to a thriving neighborhood with year-round families, boosting the once sleepy Groveland to a travel and vacation destination in its own right.
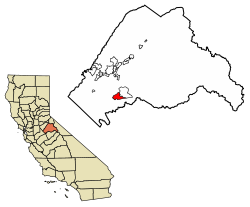
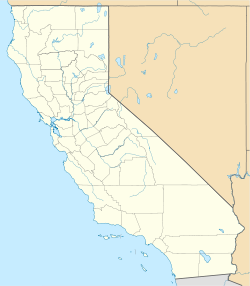
Geography

According to the United States Census Bureau, the CDP covers an area of 9.6 square miles (24.8 km2), 99.94% of it land and 0.06% of it water.

Climate

This region experiences warm to very hot and dry summers, with the hottest month having an average temperature of 73.7 °F. According to the Köppen Climate Classification system, Groveland has a hot-summer Mediterranean climate, abbreviated "Csa."

Climate data for Groveland, California, 1991–2020 normals, extremes 1908–1916, 2000–present
MonthJanFebMarAprMayJunJulAugSepOctNovDecYear
Record high °F (°C)72
(22)
84
(29)
87
(31)
87
(31)
97
(36)
104
(40)
107
(42)
105
(41)
108
(42)
97
(36)
87
(31)
75
(24)
108
(42)
Mean maximum °F (°C)66.6
(19.2)
69.8
(21.0)
74.5
(23.6)
81.7
(27.6)
88.5
(31.4)
98.6
(37.0)
101.1
(38.4)
99.7
(37.6)
96.9
(36.1)
86.5
(30.3)
77.0
(25.0)
64.9
(18.3)
102.1
(38.9)
Mean daily maximum °F (°C)53.4
(11.9)
55.3
(12.9)
60.1
(15.6)
64.8
(18.2)
73.2
(22.9)
83.2
(28.4)
91.2
(32.9)
90.7
(32.6)
84.7
(29.3)
73.5
(23.1)
60.1
(15.6)
52.0
(11.1)
70.2
(21.2)
Daily mean °F (°C)42.2
(5.7)
43.5
(6.4)
47.5
(8.6)
51.4
(10.8)
58.6
(14.8)
67.0
(19.4)
73.7
(23.2)
72.8
(22.7)
67.3
(19.6)
57.7
(14.3)
47.6
(8.7)
41.4
(5.2)
55.9
(13.3)
Mean daily minimum °F (°C)31.0
(−0.6)
31.7
(−0.2)
34.8
(1.6)
38.1
(3.4)
44.0
(6.7)
50.9
(10.5)
56.3
(13.5)
54.9
(12.7)
49.9
(9.9)
41.8
(5.4)
35.1
(1.7)
30.7
(−0.7)
41.6
(5.3)
Mean minimum °F (°C)20.9
(−6.2)
21.9
(−5.6)
24.7
(−4.1)
28.4
(−2.0)
33.7
(0.9)
39.0
(3.9)
47.9
(8.8)
47.1
(8.4)
38.3
(3.5)
31.4
(−0.3)
25.5
(−3.6)
19.1
(−7.2)
17.3
(−8.2)
Record low °F (°C)−2
(−19)
8
(−13)
12
(−11)
23
(−5)
23
(−5)
33
(1)
37
(3)
40
(4)
32
(0)
26
(−3)
19
(−7)
7
(−14)
−2
(−19)
Average precipitation inches (mm)7.20
(183)
6.93
(176)
6.29
(160)
2.98
(76)
2.24
(57)
0.39
(9.9)
0.00
(0.00)
0.09
(2.3)
0.30
(7.6)
2.13
(54)
3.50
(89)
6.61
(168)
38.66
(982.8)
Average snowfall inches (cm)1.3
(3.3)
2.3
(5.8)
2.6
(6.6)
0.8
(2.0)
0.0
(0.0)
0.0
(0.0)
0.0
(0.0)
0.0
(0.0)
0.0
(0.0)
0.0
(0.0)
0.7
(1.8)
1.7
(4.3)
9.4
(23.8)
Average precipitation days (≥ 0.01 in)9.98.510.57.24.10.90.30.61.63.98.010.165.6
Average snowy days (≥ 0.1 in)0.30.50.50.30.00.00.00.00.00.00.40.22.2
Source 1: NOAA [4]
Source 2: National Weather Service (mean maxima/minima 20062020) [5]

Demographics

Historical population
CensusPop.Note
2010 601
2020 540−10.1%
U.S. Decennial Census [6]

The 2020 United States census reported that Groveland had a population of 540. The population density was 56.4 inhabitants per square mile (21.8/km2). The racial makeup of Groveland was 458 (84.8%) White, 1 (0.2%) African American, 9 (1.7%) Native American, 3 (0.6%) Asian, 0 (0.0%) Pacific Islander, 11 (2.0%) from other races, and 58 (10.7%) from two or more races. Hispanic or Latino of any race were 44 persons (8.1%). [7]

The whole population lived in households. There were 245 households, out of which 44 (18.0%) had children under the age of 18 living in them, 87 (35.5%) were married-couple households, 25 (10.2%) were cohabiting couple households, 68 (27.8%) had a female householder with no partner present, and 65 (26.5%) had a male householder with no partner present. 90 households (36.7%) were one person, and 46 (18.8%) were one person aged 65 or older. The average household size was 2.2. [7] There were 136 families (55.5% of all households). [8]

The age distribution was 96 people (17.8%) under the age of 18, 36 people (6.7%) aged 18 to 24, 125 people (23.1%) aged 25 to 44, 133 people (24.6%) aged 45 to 64, and 150 people (27.8%) who were 65 years of age or older. The median age was 46.8 years. For every 100 females, there were 122.2 males. [7]

There were 321 housing units at an average density of 33.5 units per square mile (12.9 units/km2), of which 245 (76.3%) were occupied. Of these, 178 (72.7%) were owner-occupied, and 67 (27.3%) were occupied by renters. [7]

Features

Camp Mather of the City of San Francisco, San Jose Family Camp of the City of San Jose, Berkeley Tuolumne Family Camp of the City of Berkeley, and Camp Tawonga, a Jewish summer camp, are all located east of Groveland off Hwy 120 within the Stanislaus National Forest. [9]

References

  1. "2020 U.S. Gazetteer Files". United States Census Bureau. Retrieved October 30, 2021.
  2. 1 2 3 U.S. Geological Survey Geographic Names Information System: Groveland, California
  3. "Search Results". The United States Census Bureau. United States Census Bureau. Retrieved November 11, 2021.
  4. "U.S. Climate Normals Quick Access – Station: Groveland 2, CA". National Oceanic and Atmospheric Administration. Retrieved April 13, 2023.
  5. "NOAA Online Weather Data – NWS Sacramento". National Weather Service. Retrieved April 13, 2023.
  6. "Census of Population and Housing". Census.gov. Retrieved June 4, 2016.
  7. 1 2 3 4 "Groveland CDP, California; DP1: Profile of General Population and Housing Characteristics - 2020 Census of Population and Housing". US Census Bureau. Retrieved May 21, 2025.
  8. "Groveland CDP, California; P16: Household Type - 2020 Census of Population and Housing". US Census Bureau. Retrieved May 21, 2025.
  9. Thanawala, Sudhin (July 5, 2013). "Teen injured at Calif. camp heard crack, screaming". Associated Press . Retrieved November 8, 2013.