Maria | |
|---|---|
| Municipality of Maria | |
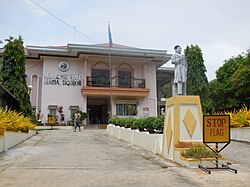 Maria Town Hall | |
 Flag | |
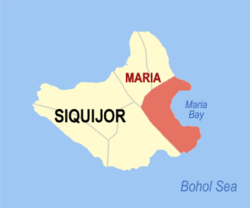 Map of Siquijor with Maria highlighted | |
OpenStreetMap  | |
 Maria Location within the Philippines | |
| Coordinates: 9°11′46″N123°39′18″E / 9.196°N 123.655°E | |
| Country | Philippines |
| Region | Negros Island Region |
| Province | Siquijor |
| District | Lone district |
| Barangays | 22 (see Barangays) |
| Government | |
| • Type | Sangguniang Bayan |
| • Mayor | Roselyn T. Asok (PFP) |
| • Vice Mayor | Meynard R. Asok (PFP) |
| • Representative | Zaldy Villa (Lakas) |
| • Municipal Council | Members |
| • Electorate | 11,532 voters (2025) |
| Area | |
• Total | 53.37 km2 (20.61 sq mi) |
| Elevation | 23.8 m (78 ft) |
| Highest elevation | 448 m (1,470 ft) |
| Lowest elevation | 0 m (0 ft) |
| Population (2024 census) [4] | |
• Total | 15,146 |
| • Density | 283.8/km2 (735.0/sq mi) |
| • Households | 3,545 |
| Economy | |
| • Income class | 4th municipal income class |
| • Poverty incidence | 9.57 |
| • Revenue | ₱ 113 million (2022) |
| • Assets | ₱ 122.2 million (2022) |
| • Expenditure | ₱ 92.85 million (2022) |
| • Liabilities | ₱ 27.17 million (2022) |
| Service provider | |
| • Electricity | Province of Siquijor Electric Cooperative (PROSIELCO) |
| Time zone | UTC+8 (PST) |
| ZIP code | 6229 |
| PSGC | |
| IDD : area code | +63 (0)35 |
| Native languages | Cebuano Tagalog |
| Patron saint | Our Lady of Divine Providence |
Maria, officially the Municipality of Maria (Cebuano : Lungsod sa Maria; Tagalog : Bayan ng Maria), is a municipality in the province of Siquijor, Philippines. According to the 2024 census, it has a population of 15,146 people. [6]
Contents
The name change from the previous local name, Kangmenia, was made by Spanish friars in 1880 to honor Mary, mother of Jesus. Maria is 32 kilometres (20 mi) from the provincial capital Siquijor.


