Michigan's 16th congressional district

Last updated

Michigan's 16th congressional district
Obsolete district
Created1930
Eliminated2000
Years active1933–2003
The 16th district boundaries for the 106th Congress, prior to being eliminated after redistricting in 2002 MI 16th congressional district (106th Congress).PNG
The 16th district boundaries for the 106th Congress, prior to being eliminated after redistricting in 2002

Michigan's 16th congressional district is an obsolete United States congressional district in Michigan. It covered the communities of Dearborn, Downriver and Monroe County. [1]

Contents

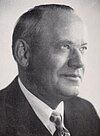
The first Representative to Congress elected from the 16th district, John Lesinski, Sr., took office in 1933, after reapportionment due to the 1930 census. The district was dissolved following the 2000 census. The last Representative elected from the district, John Dingell, was subsequently elected from the 15th district. The only other Representative elected from the 16th district in its 70 years of existence was John Lesinski, Jr. It could be called a Polish district, because all three district's representatives were Polish-Americans.

Voting

Election results from presidential races
YearOfficeResults
2000 President Gore 51 - 47%
1996 President Clinton 54 - 34%
1992 President Clinton 43 - 36%

List of members representing the district

RepresentativePartyTermCong
ress
Electoral history
District created March 4, 1933
John Lesinski Sr. (Michigan Congressman).jpg
John Lesinski Sr.
(Dearborn)
DemocraticMarch 4, 1933–
May 27, 1950
73rd
74th
75th
76th
77th
78th
79th
80th
81st
Elected in 1932.
Re-elected in 1934.
Re-elected in 1936
Re-elected in 1938.
Re-elected in 1940.
Re-elected in 1942.
Re-elected in 1944.
Re-elected in 1946.
Re-elected in 1948.
Died.
VacantMay 27, 1950–
January 3, 1951
81st
John Lesinski, Jr.jpg
John Lesinski Jr.
(Dearborn)
DemocraticJanuary 3, 1951–
January 3, 1965
82nd
83rd
84th
85th
86th
87th
88th
Elected in 1950.
Re-elected in 1952.
Re-elected in 1954.
Re-elected in 1956.
Re-elected in 1958.
Re-elected in 1960.
Re-elected in 1962.
Lost renomination.
John Dingell earlier official portrait.gif
John Dingell
(Dearborn)
DemocraticJanuary 3, 1965–
January 3, 2003
89th
90th
91st
92nd
93rd
94th
95th
96th
97th
98th
99th
100th
101st
102nd
103rd
104th
105th
106th
107th
Redistricted from the 15th district and re-elected in 1964.
Re-elected in 1966.
Re-elected in 1968.
Re-elected in 1970.
Re-elected in 1972.
Re-elected in 1974.
Re-elected in 1976.
Re-elected in 1978.
Re-elected in 1980.
Re-elected in 1982.
Re-elected in 1984.
Re-elected in 1986.
Re-elected in 1988.
Re-elected in 1990.
Re-elected in 1992.
Re-elected in 1994.
Re-elected in 1996.
Re-elected in 1998.
Re-elected in 2000.
Redistricted to the 15th district .
District eliminated January 3, 2003

Elections

1964 election
PartyCandidateVotes%±%
Democratic John Dingell 112,76373%
Republican John Lesinski Jr. (Incumbent)40,67327%
1966 election
PartyCandidateVotes%±%
Democratic John Dingell (Incumbent)71,78763%
Republican John T. Dempsey 42,73837%
1968 election
PartyCandidateVotes%±%
Democratic John Dingell (Incumbent)105,69074%
Republican Monte Bona 37,00026%
1970 election
PartyCandidateVotes%±%
Democratic John Dingell (Incumbent)90,54079%
Republican William Rostrom 23,86721%
1972 election
PartyCandidateVotes%±%
Democratic John Dingell (Incumbent)110,71570%
Republican William Rostrom 48,41430%
1974 election
PartyCandidateVotes%±%
Democratic John Dingell (Incumbent)95,83478%
Republican Wallace English 25,24822%
1976 election
PartyCandidateVotes%±%
Democratic John Dingell (Incumbent)121,68276%
Republican William Rostrom 36,37824%
1978 election
PartyCandidateVotes%±%
Democratic John Dingell (Incumbent)93,38770%
Republican Melvin Heuer 26,82730%
1980 election
PartyCandidateVotes%±%
Democratic John Dingell (Incumbent)105,84470%
Republican Pamella Seay 42,73530%
1982 election
PartyCandidateVotes%±%
Democratic John Dingell (Incumbent)114,00674%
Republican David K. Haskins 39,22726%
1984 election
PartyCandidateVotes%±%
Democratic John Dingell (Incumbent)121,46364%
Republican Frank Grzywacki 68,11636%
1986 election
PartyCandidateVotes%±%
Democratic John Dingell (Incumbent)101,65978%
Republican Frank Grzywacki 28,79122%
1988 election
PartyCandidateVotes%±%
Democratic John Dingell (Incumbent)132,775100%
1990 election
PartyCandidateVotes%±%
Democratic John Dingell (Incumbent)88,96267%
Republican William T. Morse 42,46933%
1992 election
PartyCandidateVotes%±%
Democratic John Dingell (Incumbent)156,96465%
Republican Frank Beaumont 75,69435%
1994 election
PartyCandidateVotes%±%
Democratic John Dingell (Incumbent)105,84660%
Republican Ken Larkin 71,15940%
1996 election
PartyCandidateVotes%±%
Democratic John Dingell (Incumbent)136,85464%
Republican James Deshauna 78,72336%
1998 election
PartyCandidateVotes%±%
Democratic John Dingell (Incumbent)116,14567%
Republican William T. Morse 54,12133%
2000 election
PartyCandidateVotes%±%
Democratic John Dingell (Incumbent)167,14272%
Republican William T. Morse 62,46928%

Notes

  1. Alamanac of American Politics 2002, p816

References

42°0′N83°30′W / 42.000°N 83.500°W / 42.000; -83.500