| ||||||||||||||||||||||||||||
110 seats in the Michigan House of Representatives 56 seats needed for a majority | ||||||||||||||||||||||||||||
---|---|---|---|---|---|---|---|---|---|---|---|---|---|---|---|---|---|---|---|---|---|---|---|---|---|---|---|---|
| ||||||||||||||||||||||||||||
|
Elections in Michigan | ||||||||||
---|---|---|---|---|---|---|---|---|---|---|
| ||||||||||
The 2002 Michigan House of Representatives elections were held on November 5, 2002, with partisan primaries to select the parties' nominees in the various districts on August 6, 2002. [1]
Party | Candidate | Votes | % | |
---|---|---|---|---|
Republican | Ed Gaffney | 19,250 | 56.4 | |
Democratic | David Paul Putrycus | 14,880 | 43.6 | |
Total votes | 34,130 | 100.0 | ||
Republican hold | ||||
Party | Candidate | Votes | % | |
---|---|---|---|---|
Democratic | Ken Daniels | 14,039 | 95.03 | |
Republican | Herbert Russell | 734 | 4.97 | |
Total votes | 14,773 | 100.0 | ||
Democratic hold | ||||
Party | Candidate | Votes | % | |
---|---|---|---|---|
Democratic | Artina Tinsley Hardiman | 16,520 | 95.82 | |
Republican | Michael Embry | 720 | 4.18 | |
Total votes | 17,240 | 100.0 | ||
Democratic hold | ||||
Party | Candidate | Votes | % | |
---|---|---|---|---|
Democratic | Mary Waters | 19,337 | 96.18 | |
Republican | Wayne Senior | 767 | 3.82 | |
Total votes | 20,104 | 100.0 | ||
Democratic hold | ||||
Party | Candidate | Votes | % | |
---|---|---|---|---|
Democratic | Bill McConico | 13,967 | 92.83 | |
Republican | Richard Maziarz | 1,078 | 7.17 | |
Total votes | 15,045 | 100.0 | ||
Democratic hold | ||||
Party | Candidate | Votes | % | |
---|---|---|---|---|
Democratic | Marsha Cheeks | 17,428 | 93.71 | |
Republican | Dorothy Patterson | 775 | 4.17 | |
Green | Margaret Guttshall | 394 | 2.12 | |
Total votes | 18,597 | 100.0 | ||
Democratic hold | ||||
Party | Candidate | Votes | % | |
---|---|---|---|---|
Democratic | Virgil Smith | 21,165 | 96.11 | |
Republican | Dolores Brodersen | 857 | 3.89 | |
Total votes | 22,022 | 100.0 | ||
Democratic hold | ||||
Party | Candidate | Votes | % | |
---|---|---|---|---|
Democratic | Alma Stallworth | 27,707 | 97.34 | |
Republican | Melvin Byrd | 744 | 2.61 | |
Write-in | Doris Massey-Stuppard | 13 | 0.05 | |
Total votes | 28,464 | 100.0 | ||
Democratic hold | ||||
Party | Candidate | Votes | % | |
---|---|---|---|---|
Democratic | Tupac Hunter | 22,098 | 94.47 | |
Republican | Richard Zeile | 1,294 | 5.53 | |
Total votes | 23,392 | 100.0 | ||
Democratic hold | ||||
Party | Candidate | Votes | % | |
---|---|---|---|---|
Democratic | Triette Lipsey Reeves | 16,005 | 89.22 | |
Republican | John Nazars | 1,535 | 8.56 | |
Green | Alan Jacobson | 398 | 2.22 | |
Total votes | 17,938 | 100.0 | ||
Democratic hold | ||||
Party | Candidate | Votes | % | |
---|---|---|---|---|
Democratic | Morris Hood III | 19,906 | 94.7 | |
Republican | Charles Powell | 888 | 4.22 | |
Green | Garry Herring | 227 | 1.08 | |
Total votes | 21,021 | 100.0 | ||
Democratic hold | ||||
Party | Candidate | Votes | % | |
---|---|---|---|---|
Democratic | Steve Tobocman | 8,406 | 90.19 | |
Republican | Chester Calka | 914 | 9.81 | |
Total votes | 9,320 | 100.0 | ||
Democratic hold | ||||
Party | Candidate | Votes | % | |
---|---|---|---|---|
Democratic | Barbara Farrah | 17,472 | 64.74 | |
Republican | Darrell Stasik | 8,905 | 32.99 | |
Libertarian | Eric Gordon | 613 | 2.27 | |
Total votes | 26,990 | 100.0 | ||
Democratic hold | ||||
Party | Candidate | Votes | % | |
---|---|---|---|---|
Democratic | William O'Neil | 17,277 | 73.95 | |
Republican | Chris O'Loughlin | 6,085 | 26.05 | |
Total votes | 23,362 | 100.0 | ||
Democratic hold | ||||
Party | Candidate | Votes | % | |
---|---|---|---|---|
Republican | Gary Woronchak | 19,227 | 100 | |
Total votes | 19,227 | 100.0 | ||
Republican hold | ||||
Party | Candidate | Votes | % | |
---|---|---|---|---|
Democratic | Jim Plakas | 19,693 | 75.16 | |
Republican | Eric Homeier | 5,595 | 21.35 | |
Libertarian | David Nagy | 913 | 3.48 | |
Total votes | 26,201 | 100.0 | ||
Democratic hold | ||||
Party | Candidate | Votes | % | |
---|---|---|---|---|
Democratic | Daniel Paletko | 14,772 | 49.62 | |
Republican | R. Miles Handy III | 14,091 | 47.33 | |
Libertarian | Christopher Gonzalez | 907 | 3.05 | |
Total votes | 29,770 | 100.0 | ||
Democratic hold | ||||
Party | Candidate | Votes | % | |
---|---|---|---|---|
Democratic | Glenn Anderson | 14,619 | 70.16 | |
Republican | Kip Lipford | 6,218 | 29.84 | |
Total votes | 20,837 | 100.0 | ||
Democratic hold | ||||
Party | Candidate | Votes | % | |
---|---|---|---|---|
Republican | John Pastor | 22,170 | 62.85 | |
Democratic | Kerry Lowry | 12,210 | 34.61 | |
Libertarian | Mike Shesterkin | 895 | 2.54 | |
Total votes | 35,275 | 100.0 | ||
Republican hold | ||||
Party | Candidate | Votes | % | |
---|---|---|---|---|
Republican | John Stewart | 19,910 | 61.23 | |
Democratic | Mark Blackwell | 11,581 | 35.61 | |
Libertarian | James Dean | 1,027 | 3.16 | |
Total votes | 32,518 | 100.0 | ||
Republican hold | ||||
Party | Candidate | Votes | % | |
---|---|---|---|---|
Republican | Phil LaJoy | 15,591 | 53.76 | |
Democratic | Mark Slavens | 12,769 | 44.03 | |
Libertarian | Ken Century | 640 | 2.21 | |
Total votes | 29,000 | 100.0 | ||
Republican hold | ||||
Party | Candidate | Votes | % | |
---|---|---|---|---|
Democratic | Hoon-Yung Hopgood | 14,042 | 68.85 | |
Republican | Ronald Vaughan | 5,696 | 27.93 | |
Libertarian | Charles Kainz | 657 | 3.22 | |
Total votes | 20,395 | 100.0 | ||
Democratic hold | ||||
Party | Candidate | Votes | % | |
---|---|---|---|---|
Democratic | Kathleen Law | 13,430 | 49.46 | |
Republican | Douglas Jones | 13,171 | 48.51 | |
Libertarian | Richard Secula | 552 | 2.03 | |
Total votes | 27,153 | 100.0 | ||
Democratic hold | ||||
Party | Candidate | Votes | % | |||
---|---|---|---|---|---|---|
Republican | Jack Brandenburg | 17,697 | 53.56 | |||
Democratic | Frank Benson | 14,296 | 43.27 | |||
Libertarian | Erin Stahl | 1,049 | 3.17 | |||
Total votes | 33,042 | 100.0 | ||||
Republican gain from Democratic | ||||||
Party | Candidate | Votes | % | |
---|---|---|---|---|
Democratic | Steve Bieda | 16,910 | 56.74 | |
Republican | Keith Sadowski | 12,893 | 43.26 | |
Total votes | 29,803 | 100.0 | ||
Democratic hold | ||||
Party | Candidate | Votes | % | |
---|---|---|---|---|
Democratic | Dave Woodward | 19,058 | 60.55 | |
Republican | Josh West | 11,697 | 37.16 | |
Green | Dan Karam | 722 | 2.29 | |
Total votes | 31,477 | 100.0 | ||
Democratic hold | ||||
Party | Candidate | Votes | % | |
---|---|---|---|---|
Democratic | Andy Meisner | 21,037 | 70.5 | |
Republican | Keith Sanford | 7,927 | 26.57 | |
Green | Art Myatt | 875 | 2.93 | |
Total votes | 29,839 | 100.0 | ||
Democratic hold | ||||
Party | Candidate | Votes | % | |
---|---|---|---|---|
Democratic | Lisa Wojno | 14,998 | 67.27 | |
Republican | Scott Stevens | 6,883 | 30.87 | |
Libertarian | James Allison | 415 | 1.86 | |
Total votes | 22,296 | 100.0 | ||
Democratic hold | ||||
Party | Candidate | Votes | % | |||
---|---|---|---|---|---|---|
Democratic | Clarence Phillips | 13,675 | 76.11 | |||
Republican | Tom March | 4,292 | 23.89 | |||
Total votes | 17,967 | 100.0 | ||||
Democratic gain from Republican | ||||||
Party | Candidate | Votes | % | |
---|---|---|---|---|
Republican | Sal Rocca | 17,243 | 62.4 | |
Democratic | Joe McHugh | 10,392 | 37.6 | |
Total votes | 27,635 | 100.0 | ||
Republican hold | ||||
Party | Candidate | Votes | % | |
---|---|---|---|---|
Democratic | Paul Gieleghem | 14,663 | 60.13 | |
Republican | Sheryl Russo | 9,021 | 36.99 | |
Libertarian | James Miller | 701 | 2.87 | |
Total votes | 24,385 | 100.0 | ||
Democratic hold | ||||
Party | Candidate | Votes | % | |
---|---|---|---|---|
Republican | Dan Acciavatti | 15,405 | 56.26 | |
Democratic | John Hertel | 11,975 | 43.74 | |
Total votes | 27,380 | 100.0 | ||
Republican hold | ||||
Party | Candidate | Votes | % | |
---|---|---|---|---|
Republican | Leon Drolet | 17,856 | 60.17 | |
Democratic | Anthony Ventimiglia | 11,822 | 39.83 | |
Total votes | 29,678 | 100.0 | ||
Republican hold | ||||
Party | Candidate | Votes | % | |
---|---|---|---|---|
Democratic | Brenda Clack | 16,038 | 87.59 | |
Republican | Rudolph Willis | 2,273 | 12.41 | |
Total votes | 18,311 | 100.0 | ||
Democratic hold | ||||
Party | Candidate | Votes | % | |
---|---|---|---|---|
Democratic | Paul Condino | 25,876 | 80.18 | |
Republican | Sylvia Jordan | 6,397 | 19.82 | |
Total votes | 32,273 | 100.0 | ||
Democratic hold | ||||
Party | Candidate | Votes | % | |||
---|---|---|---|---|---|---|
Republican | Brian Palmer | 20,013 | 67.36 | |||
Democratic | Robert Denison | 9,699 | 32.64 | |||
Total votes | 29,712 | 100.0 | ||||
Republican gain from Democratic | ||||||
Party | Candidate | Votes | % | |||
---|---|---|---|---|---|---|
Democratic | Aldo Vagnozzi | 17,976 | 52.46 | |||
Republican | Valerie Knol | 16,290 | 47.54 | |||
Total votes | 34,266 | 100.0 | ||||
Democratic gain from Republican | ||||||
Party | Candidate | Votes | % | |
---|---|---|---|---|
Republican | Craig DeRoche | 18,561 | 65.05 | |
Democratic | Linda Premo | 9,973 | 34.95 | |
Total votes | 28,534 | 100.0 | ||
Republican hold | ||||
Party | Candidate | Votes | % | |
---|---|---|---|---|
Republican | Marc Shulman | 19,691 | 60.75 | |
Democratic | Stuart Brickner | 12,722 | 39.25 | |
Total votes | 32,413 | 100.0 | ||
Republican hold | ||||
Party | Candidate | Votes | % | |
---|---|---|---|---|
Republican | Shelley Taub | 25,625 | 62.41 | |
Democratic | Shelli Weisberg | 15,435 | 37.59 | |
Total votes | 41,060 | 100.0 | ||
Republican hold | ||||
Party | Candidate | Votes | % | |
---|---|---|---|---|
Republican | John Pappageorge | 22,631 | 68.97 | |
Democratic | Richard Fischer, Jr. | 9,514 | 29 | |
Green | Bretton Jones | 667 | 2.03 | |
Total votes | 32,812 | 100.0 | ||
Republican hold | ||||
Party | Candidate | Votes | % | |||
---|---|---|---|---|---|---|
Democratic | Frank Accavitti | 15,746 | 64.85 | |||
Republican | Jim Riske | 7,580 | 31.22 | |||
Libertarian | John Bonnell | 955 | 3.93 | |||
Total votes | 24,281 | 100.0 | ||||
Democratic gain from Republican | ||||||
Party | Candidate | Votes | % | |||
---|---|---|---|---|---|---|
Republican | Fran Amos | 14,788 | 52.92 | |||
Democratic | Betty Fortino | 13,157 | 47.08 | |||
Total votes | 27,945 | 100.0 | ||||
Republican gain from Democratic | ||||||
Party | Candidate | Votes | % | |
---|---|---|---|---|
Republican | John Stakoe | 22,788 | 70.04 | |
Democratic | George Bryan | 9,748 | 29.96 | |
Total votes | 32,536 | 100.0 | ||
Republican hold | ||||
Party | Candidate | Votes | % | |
---|---|---|---|---|
Republican | John Garfield | 23,518 | 68.73 | |
Democratic | John Kanaras | 10,699 | 31.27 | |
Total votes | 34,217 | 100.0 | ||
Republican hold | ||||
Party | Candidate | Votes | % | |
---|---|---|---|---|
Republican | Ruth Johnson | 21,582 | 70.88 | |
Democratic | Robert Reading | 8,866 | 29.12 | |
Total votes | 30,448 | 100.0 | ||
Republican hold | ||||
Party | Candidate | Votes | % | |||
---|---|---|---|---|---|---|
Republican | Joe Hune | 19,990 | 68.85 | |||
Democratic | Matt McGivney | 9,043 | 31.15 | |||
Total votes | 29,033 | 100.0 | ||||
Republican gain from Democratic | ||||||
Party | Candidate | Votes | % | |
---|---|---|---|---|
Democratic | John Gleason | 19,600 | 69.21 | |
Republican | Mike Gardner | 8,720 | 30.79 | |
Total votes | 28,320 | 100.0 | ||
Democratic hold | ||||
Party | Candidate | Votes | % | |
---|---|---|---|---|
Democratic | Jack Minore | 17,860 | 69.48 | |
Republican | Courtney Garner | 7,844 | 30.52 | |
Total votes | 25,704 | 100.0 | ||
Democratic hold | ||||
Party | Candidate | Votes | % | |
---|---|---|---|---|
Democratic | Paula Zelenko | 17,121 | 67.8 | |
Republican | Stephen Brang | 8,131 | 32.2 | |
Total votes | 25,252 | 100.0 | ||
Democratic hold | ||||
Party | Candidate | Votes | % | |||
---|---|---|---|---|---|---|
Republican | Dave Robertson | 16,675 | 49.94 | |||
Democratic | Patricia Lockwood | 16,169 | 48.42 | |||
Green | Peter Ponzetti | 549 | 1.64 | |||
Total votes | 33,393 | 100.0 | ||||
Republican gain from Democratic | ||||||
Party | Candidate | Votes | % | |||
---|---|---|---|---|---|---|
Republican | Gene DeRossett | 19,579 | 53.39 | |||
Democratic | Pam Byrnes | 17,091 | 46.61 | |||
Total votes | 36,670 | 100.0 | ||||
Republican gain from Democratic | ||||||
Party | Candidate | Votes | % | |
---|---|---|---|---|
Democratic | Chris Kolb | 22,254 | 77.99 | |
Republican | John Milroy | 6,279 | 22.01 | |
Total votes | 28,533 | 100.0 | ||
Democratic hold | ||||
Party | Candidate | Votes | % | |
---|---|---|---|---|
Democratic | Ruth Ann Jamnick | 17,888 | 68.8 | |
Republican | David Trent | 8,112 | 31.2 | |
Total votes | 26,000 | 100.0 | ||
Democratic hold | ||||
Party | Candidate | Votes | % | |
---|---|---|---|---|
Republican | Matt Milosch | 14,287 | 52.98 | |
Democratic | Gail Hauser-Hurley | 12,679 | 47.02 | |
Total votes | 26,966 | 100.0 | ||
Republican hold | ||||
Party | Candidate | Votes | % | |
---|---|---|---|---|
Republican | Randy Richardville | 17,357 | 65.84 | |
Democratic | Joshua Sacks | 9,004 | 34.16 | |
Total votes | 26,361 | 100.0 | ||
Republican hold | ||||
Party | Candidate | Votes | % | |
---|---|---|---|---|
Democratic | Doug Spade | 17,887 | 69.43 | |
Republican | Fred Gallagher | 7,877 | 30.57 | |
Total votes | 25,764 | 100.0 | ||
Democratic hold | ||||
Party | Candidate | Votes | % | |
---|---|---|---|---|
Republican | Bruce Caswell | 14,836 | 66.87 | |
Democratic | Annette Magda | 7,349 | 33.13 | |
Total votes | 22,185 | 100.0 | ||
Republican hold | ||||
Party | Candidate | Votes | % | |
---|---|---|---|---|
Republican | Rick Shaffer | 15,227 | 67.2 | |
Democratic | Paula Beauchamp | 7,432 | 32.8 | |
Total votes | 7,432 | 100.0 | ||
Republican hold | ||||
Party | Candidate | Votes | % | |
---|---|---|---|---|
Democratic | Alexander Lipsey | 13,671 | 64.01 | |
Republican | Mark Liddle | 7,687 | 35.99 | |
Total votes | 21,358 | 100.0 | ||
Democratic hold | ||||
Party | Candidate | Votes | % | |
---|---|---|---|---|
Republican | Jack Hoogendyk | 18,720 | 56.53 | |
Democratic | James Houston | 14,398 | 43.47 | |
Total votes | 33,118 | 100.0 | ||
Republican hold | ||||
Party | Candidate | Votes | % | |||
---|---|---|---|---|---|---|
Republican | Mike Nofs | 13,619 | 53.19 | |||
Democratic | Ted Dearing | 11,986 | 46.81 | |||
Total votes | 25,605 | 100.0 | ||||
Republican gain from Democratic | ||||||
Party | Candidate | Votes | % | |
---|---|---|---|---|
Republican | Lorence Wenke | 18,093 | 56.52 | |
Democratic | Judy Mackinder | 13,918 | 43.48 | |
Total votes | 32,011 | 100.0 | ||
Republican hold | ||||
Party | Candidate | Votes | % | |
---|---|---|---|---|
Republican | Clark Bisbee | 15,928 | 64.06 | |
Democratic | Robert McNitt | 8,936 | 35.94 | |
Total votes | 24,864 | 100.0 | ||
Republican hold | ||||
Party | Candidate | Votes | % | |
---|---|---|---|---|
Republican | Jerry Kratz | 13,934 | 55.97 | |
Democratic | Sharon Renier | 10,960 | 44.03 | |
Total votes | 24,894 | 100.0 | ||
Republican hold | ||||
Party | Candidate | Votes | % | |
---|---|---|---|---|
Republican | Chris Ward | 23,599 | 72.78 | |
Democratic | James W. Block | 8,826 | 27.22 | |
Total votes | 32,425 | 100.0 | ||
Republican hold | ||||
Party | Candidate | Votes | % | |||
---|---|---|---|---|---|---|
Democratic | Dianne Byrum | 19,138 | 58.94 | |||
Republican | Donald Vickers | 13,331 | 41.06 | |||
Total votes | 32,469 | 100.0 | ||||
Democratic gain from Republican | ||||||
Party | Candidate | Votes | % | |
---|---|---|---|---|
Democratic | Michael Murphy | 18,824 | 66.89 | |
Republican | Tim Havis | 8,167 | 29.02 | |
Reform | DelRae Finnerty | 575 | 2.04 | |
Total votes | 27,566 | 100.0 | ||
Democratic hold | ||||
Party | Candidate | Votes | % | |
---|---|---|---|---|
Democratic | Gretchen Whitmer | 18,002 | 62.54 | |
Republican | Larry Ward | 10,783 | 37.46 | |
Total votes | 28,785 | 100.0 | ||
Democratic hold | ||||
Party | Candidate | Votes | % | |||
---|---|---|---|---|---|---|
Republican | Judy Emmons | 14,610 | 65.82 | |||
Democratic | Henry Sanchez | 7,588 | 34.18 | |||
Total votes | 22,198 | 100.0 | ||||
Republican gain from Democratic | ||||||
Party | Candidate | Votes | % | |
---|---|---|---|---|
Republican | Susan Tabor | 19,326 | 55.68 | |
Democratic | Sherry Freeman | 15,383 | 44.32 | |
Total votes | 34,709 | 100.0 | ||
Republican hold | ||||
Party | Candidate | Votes | % | |
---|---|---|---|---|
Republican | Glenn Steil | 24,166 | 72.76 | |
Democratic | Christopher Vogt | 8,391 | 25.26 | |
Libertarian | David Good | 655 | 1.97 | |
Total votes | 33,212 | 100.0 | ||
Republican hold | ||||
Party | Candidate | Votes | % | |
---|---|---|---|---|
Republican | Doug Hart | 24,370 | 69.94 | |
Democratic | Frederick Clowney | 9,845 | 28.26 | |
Libertarian | Thomas Horan | 628 | 1.8 | |
Total votes | 34,843 | 100.0 | ||
Republican hold | ||||
Party | Candidate | Votes | % | |
---|---|---|---|---|
Republican | William Van Regenmorter | 28,234 | 78.14 | |
Democratic | Beverly Barringer | 7,492 | 20.73 | |
Libertarian | Bill Gelineau | 407 | 1.13 | |
Total votes | 36,133 | 100.0 | ||
Republican hold | ||||
Party | Candidate | Votes | % | |
---|---|---|---|---|
Republican | Jerry Kooiman | 15,340 | 53.85 | |
Democratic | Peter Vander Meulen | 12,737 | 44.71 | |
Libertarian | Erwin Haas | 408 | 1.43 | |
Total votes | 28,485 | 100.0 | ||
Republican hold | ||||
Party | Candidate | Votes | % | |
---|---|---|---|---|
Democratic | Michael Sak | 11,770 | 60.7 | |
Republican | Mark Kubik | 7,216 | 37.21 | |
Libertarian | Paul Mastin | 405 | 2.09 | |
Total votes | 19,391 | 100.0 | ||
Democratic hold | ||||
Party | Candidate | Votes | % | |
---|---|---|---|---|
Republican | Joanne Voorhees | 18,103 | 70.66 | |
Democratic | Virginia Smith | 7,070 | 27.6 | |
Libertarian | Wayne Dial | 447 | 1.74 | |
Total votes | 25,620 | 100.0 | ||
Republican hold | ||||
Party | Candidate | Votes | % | |
---|---|---|---|---|
Republican | Neal Nitz | 11,814 | 58.17 | |
Democratic | Michael Gordon | 8,497 | 41.83 | |
Total votes | 20,311 | 100.0 | ||
Republican hold | ||||
Party | Candidate | Votes | % | |
---|---|---|---|---|
Republican | Charles LaSata | 16,275 | 69.26 | |
Democratic | Ruthie Haralson | 7,224 | 30.74 | |
Total votes | 23,499 | 100.0 | ||
Republican hold | ||||
Party | Candidate | Votes | % | |
---|---|---|---|---|
Republican | Mary Ann Middaugh | 15,740 | 68.11 | |
Democratic | Whitney Wolcott | 7,368 | 31.89 | |
Total votes | 23,108 | 100.0 | ||
Republican hold | ||||
Party | Candidate | Votes | % | |
---|---|---|---|---|
Republican | Lauren Hager | 20,038 | 66.46 | |
Democratic | Colin Rumsey | 10,114 | 33.54 | |
Total votes | 30,152 | 100.0 | ||
Republican hold | ||||
Party | Candidate | Votes | % | |
---|---|---|---|---|
Republican | John Stahl | 16,464 | 56.64 | |
Democratic | Eric Knuth | 10,288 | 35.39 | |
Reform | Laura Erpelding | 1,159 | 3.99 | |
Total votes | 27,911 | 100.0 | ||
Republican hold | ||||
Party | Candidate | Votes | % | |
---|---|---|---|---|
Republican | Stephen Ehardt | 17,268 | 64.46 | |
Democratic | Edward Schultz | 9,520 | 35.54 | |
Total votes | 26,788 | 100.0 | ||
Republican hold | ||||
Party | Candidate | Votes | % | |
---|---|---|---|---|
Republican | Tom Meyer | 16,905 | 54.51 | |
Democratic | Tom Kern | 13,784 | 44.44 | |
Green | A. Wright | 325 | 1.05 | |
Total votes | 31,014 | 100.0 | ||
Republican hold | ||||
Party | Candidate | Votes | % | |
---|---|---|---|---|
Republican | Larry Julian | 18,239 | 60.59 | |
Democratic | Russell Kregger | 11,313 | 37.58 | |
Reform | James Roddy | 549 | 1.82 | |
Total votes | 30,101 | 100.0 | ||
Republican hold | ||||
Party | Candidate | Votes | % | |
---|---|---|---|---|
Republican | James Koetje | 24,865 | 68.94 | |
Democratic | James McDonald, Jr. | 10,456 | 28.99 | |
Libertarian | Patricia Steinport | 747 | 2.07 | |
Total votes | 36,068 | 100.0 | ||
Republican hold | ||||
Party | Candidate | Votes | % | |
---|---|---|---|---|
Republican | Gary Newell | 19,676 | 64.1 | |
Democratic | Rebecca Lukasiewicz | 11,020 | 35.9 | |
Total votes | 30,696 | 100.0 | ||
Republican hold | ||||
Party | Candidate | Votes | % | |
---|---|---|---|---|
Republican | Fulton Sheen | 20,727 | 68.58 | |
Democratic | Marty Jo Fleser | 9,497 | 31.42 | |
Total votes | 30,224 | 100.0 | ||
Republican hold | ||||
Party | Candidate | Votes | % | |
---|---|---|---|---|
Republican | Barb Vander Veen | 22,238 | 72.57 | |
Democratic | Rebecca Arenas | 8,405 | 27.43 | |
Total votes | 30,643 | 100.0 | ||
Republican hold | ||||
Party | Candidate | Votes | % | |
---|---|---|---|---|
Republican | Bill Huizenga | 22,940 | 81.61 | |
Democratic | Ken Breese | 5,168 | 18.39 | |
Total votes | 28,108 | 100.0 | ||
Republican hold | ||||
Party | Candidate | Votes | % | |
---|---|---|---|---|
Republican | David Farhat | 14,892 | 50.75 | |
Democratic | Nancy Frye | 14,450 | 49.25 | |
Total votes | 29,342 | 100.0 | ||
Republican hold | ||||
Party | Candidate | Votes | % | |
---|---|---|---|---|
Democratic | Julie Dennis | 15,339 | 67.25 | |
Republican | Gregory Boughton | 7,471 | 32.75 | |
Total votes | 22,810 | 100.0 | ||
Democratic hold | ||||
Party | Candidate | Votes | % | |
---|---|---|---|---|
Republican | Scott Hummel | 20,278 | 66.92 | |
Democratic | Brian Lott | 10,026 | 33.08 | |
Total votes | 30,304 | 100.0 | ||
Republican hold | ||||
Party | Candidate | Votes | % | |
---|---|---|---|---|
Republican | Jim Howell | 20,757 | 57.5 | |
Democratic | Tim Braun | 15,020 | 41.61 | |
Libertarian | Scott Carter | 320 | 0.89 | |
Total votes | 36,097 | 100.0 | ||
Republican hold | ||||
Party | Candidate | Votes | % | |
---|---|---|---|---|
Democratic | Carl M. Williams | 16,897 | 73.66 | |
Republican | Michael Howe | 6,042 | 26.34 | |
Total votes | 22,939 | 100.0 | ||
Democratic hold | ||||
Party | Candidate | Votes | % | |
---|---|---|---|---|
Democratic | Joseph Rivet | 21,126 | 63.71 | |
Republican | Vaughn Begick | 12,032 | 36.29 | |
Total votes | 33,158 | 100.0 | ||
Democratic hold | ||||
Party | Candidate | Votes | % | |
---|---|---|---|---|
Democratic | Jennifer Elkins | 14,480 | 50.6 | |
Republican | David Coker | 14,137 | 49.4 | |
Total votes | 28,617 | 100.0 | ||
Democratic hold | ||||
Party | Candidate | Votes | % | |
---|---|---|---|---|
Republican | John Moolenaar | 19,423 | 63.61 | |
Democratic | Lenny Lefevre | 11,110 | 36.39 | |
Total votes | 30,533 | 100.0 | ||
Republican hold | ||||
Party | Candidate | Votes | % | |
---|---|---|---|---|
Republican | Sandy Caul | 15,261 | 61.86 | |
Democratic | Justin Eastman | 9,410 | 38.14 | |
Total votes | 24,671 | 100.0 | ||
Republican hold | ||||
Party | Candidate | Votes | % | |
---|---|---|---|---|
Republican | Mike Pumford | 16,959 | 64.64 | |
Democratic | Don Sterling | 9,279 | 35.36 | |
Total votes | 26,238 | 100.0 | ||
Republican hold | ||||
Party | Candidate | Votes | % | |
---|---|---|---|---|
Republican | David Palsrok | 18,684 | 54.25 | |
Democratic | Nick Krieger | 15,757 | 45.75 | |
Total votes | 34,441 | 100.0 | ||
Republican hold | ||||
Party | Candidate | Votes | % | |
---|---|---|---|---|
Republican | Rick Johnson | 17,815 | 66.92 | |
Democratic | Paul Challender | 8,805 | 33.08 | |
Total votes | 26,620 | 100.0 | ||
Republican hold | ||||
Party | Candidate | Votes | % | |
---|---|---|---|---|
Democratic | Dale Sheltrown | 18,571 | 57.98 | |
Republican | Ken Carlson | 13,457 | 42.02 | |
Total votes | 32,028 | 100.0 | ||
Democratic hold | ||||
Party | Candidate | Votes | % | |
---|---|---|---|---|
Republican | Howard Walker | 21,931 | 63.63 | |
Democratic | Joel Casler | 11,493 | 33.35 | |
Reform | Tony Hefner | 521 | 1.51 | |
Total votes | 33,945 | 100.0 | ||
Republican hold | ||||
Party | Candidate | Votes | % | |
---|---|---|---|---|
Republican | Ken Bradstreet | 21,609 | 63.91 | |
Democratic | Mike Webster | 12,203 | 36.09 | |
Total votes | 33,812 | 100.0 | ||
Republican hold | ||||
Party | Candidate | Votes | % | |
---|---|---|---|---|
Democratic | Matt Gillard | 16,450 | 50.72 | |
Republican | David Wyman | 15,984 | 49.28 | |
Total votes | 32,434 | 100.0 | ||
Democratic hold | ||||
Party | Candidate | Votes | % | |
---|---|---|---|---|
Republican | Scott Shackleton | 19,514 | 68.53 | |
Democratic | Gary McDowell | 8,963 | 31.47 | |
Total votes | 28,477 | 100.0 | ||
Republican hold | ||||
Party | Candidate | Votes | % | |||
---|---|---|---|---|---|---|
Republican | Tom Casperson | 15,009 | 51.77 | |||
Democratic | Laurie Stupak | 13,982 | 48.23 | |||
Total votes | 28,991 | 100.0 | ||||
Republican gain from Democratic | ||||||
Party | Candidate | Votes | % | |
---|---|---|---|---|
Democratic | Stephen Adamini | 20,396 | 69.49 | |
Republican | Jim Hafeman | 8,954 | 30.51 | |
Total votes | 29,350 | 100.0 | ||
Democratic hold | ||||
Party | Candidate | Votes | % | |
---|---|---|---|---|
Democratic | Rich Brown | 18,544 | 70.36 | |
Republican | Barry Fay | 7,812 | 29.64 | |
Total votes | 26,356 | 100.0 | ||
Democratic hold | ||||
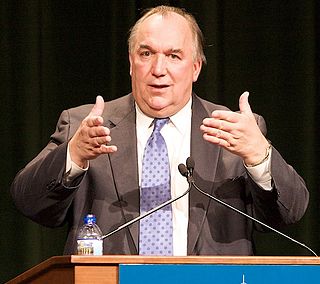
John Mathias Engler is an American businessman and member of the Republican Party who was elected to serve three terms as the 46th Governor of Michigan from 1991 to 2003. He later worked for Business Roundtable, where The Hill called him one of the country's top lobbyists.
The Michigan Legislature is the legislature of the U.S. state of Michigan. It is organized as a bicameral body composed of an upper chamber, the Senate, and a lower chamber, the House of Representatives. Article IV of the Michigan Constitution, adopted in 1963, defines the role of the Legislature and how it is to be constituted. The primary purpose of the Legislature is to enact new laws and amend or repeal existing laws. The Legislature meets in the Capitol building in Lansing.
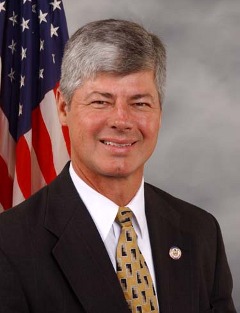
Bartholomew Thomas Stupak is an American politician and lobbyist. A member of the Democratic Party, Stupak served as the U.S. Representative from Michigan's 1st congressional district from 1993 to 2011.
Sander Martin Levin is an American politician who served in the United States House of Representatives from 1983 to 2019, representing Michigan's 9th congressional district. Levin, a member of the Democratic Party from Michigan, is a former ranking member on the House Ways and Means Committee; he was Chairman of the Ways and Means Committee from 2010 to 2011. He is the older brother of former U.S. Senator Carl Levin.
The Michigan House of Representatives is the lower house of the Michigan Legislature. There are 110 members, each of whom is elected from constituencies having approximately 77,000 to 91,000 residents, based on population figures from the 2010 U.S. Census. Its composition, powers, and duties are established in Article IV of the Michigan Constitution.
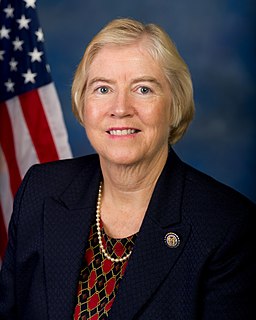
Candice Sue Miller is an American politician who was the U.S. Representative for Michigan's 10th congressional district from 2003 to 2017. She is former Michigan Secretary of State, Macomb County Treasurer, and Harrison Township Supervisor. She is a member of the Republican Party. In November 2016, she was elected Macomb County Public Works commissioner, defeating 6-term incumbent Anthony Marrocco.
James Allan Barcia is a Democratic politician from Michigan. He has served successively in the Michigan House of Representatives, the Michigan Senate, the United States House of Representatives and then again the Michigan Senate, from which he was term-limited in January 2011. He has served as County Executive of Bay County, Michigan since January, 2017.
Michigan's 4th congressional district is a United States Congressional district that from 2003 to 2013 included portions of Northern and Central Michigan, consisting of all of Clare, Clinton, Grand Traverse, Gratiot, Isabella, Kalkaska, Leelanau, Mecosta, Midland, Missaukee, Montcalm, Osceola, and Roscommon counties and the northern portion of Shiawassee and most of the western portion of Saginaw counties. The district was slightly altered in the 2012 redistricting.
William Duncan Schuette is an American lawyer and politician who served as the 53rd Attorney General of Michigan from January 1st, 2011 to January 1st, 2019 He was the unsuccessful Republican nominee for Governor of Michigan in the 2018 gubernatorial election, losing to Democrat Gretchen Whitmer.
Hansen Clarke is an American politician and former U.S. Congressman. A Democrat, he was the U.S. Representative for Michigan's 13th congressional district from 2011 to 2013. Prior to his election to Congress, he had been a member of the Michigan House of Representatives from 1991 through 1992 and from 1999 through 2002, and had represented the 1st District in the Michigan Senate from 2003 to 2011. Clarke was also the first U.S. Congressman of Bangladeshi descent.
Michigan has a republican form of government with three branches of government: the executive branch consisting of the Governor of Michigan and the other independently elected constitutional officers; the legislative branch consisting of the House of Representatives and Senate; and the judicial branch consisting of the one court of justice. The state also allows direct participation of the electorate by initiative, referendum, recall, and ratification.
Michael Dean Bishop is an American politician who was the U.S. Representative for Michigan's 8th congressional district from 2015 to 2019. He is a member of the Republican Party. He previously served in the Michigan House of Representatives from 1999 to 2003, and the Michigan State Senate from 2003 to 2010 where he served as majority leader.
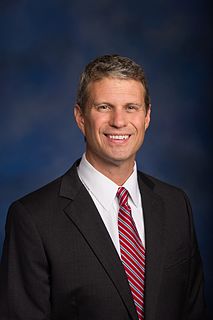
William Patrick Huizenga is an American politician serving as the U.S. Representative for Michigan's 2nd congressional district since 2011. A member of the Republican Party, he previously served in the Michigan House of Representatives from 2003 to 2009.
The Michigan gubernatorial election of 2002 was one of the 36 United States gubernatorial elections held on November 5, 2002. Incumbent Republican Governor John Engler, after serving three terms, had stepped down and was not running for a fourth term; his lieutenant governor Dick Posthumus, also a Republican, ran in his place. Jennifer Granholm, then Attorney General of Michigan, ran on the Democratic Party ticket. Douglas Campbell ran on the Green Party ticket, and Joseph M. Pilchak ran on the Constitution Party ticket.
Susan Williams Gifford is a Republican member of the Massachusetts House of Representatives. She has represented the Second Plymouth since 2003.
The 2002 congressional elections in Michigan was held on November 5, 2002 to determine who would represent the state of Michigan in the United States House of Representatives. Michigan had fifteen seats in the House, apportioned according to the 2000 United States Census, causing it to lose a seat from the previous election when it had sixteen seats. Representatives are elected for two-year terms.
John Robert Moolenaar represents Michigan's Fourth Congressional District in the U.S. House of Representatives. He is a Republican.
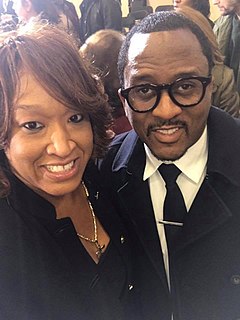
Sherry Gay-Dagnogo is a Democratic member of the Michigan House of Representatives, representing the 8th District since 2014. The 8th House District includes portions of Northwest Detroit, including the Bethune, Brightmoor, Castle Rouge, College Park, and Grandmont-Rosedale communities. During her tenure in the Michigan House, Gay-Dagnogo has served on the Families, Children, and Seniors, Financial Services and Insurance committees.
Sara Cambensy is an American politician serving her first term in the Michigan House of Representatives, representing the 109th District and is a member of the Democratic Party. Prior to her election to the state legislature, Cambensy served on the Marquette City Commission, Marquette Planning Commission and was the director of adult and continuing education for Marquette Community Schools.