| |||||||||||||||||||||||||
110 seats in the Michigan House of Representatives 56 seats needed for a majority | |||||||||||||||||||||||||
---|---|---|---|---|---|---|---|---|---|---|---|---|---|---|---|---|---|---|---|---|---|---|---|---|---|
| |||||||||||||||||||||||||
|
Elections in Michigan | ||||||||||
---|---|---|---|---|---|---|---|---|---|---|
| ||||||||||
The 2006 Michigan House of Representatives elections were held on November 7, 2006, with partisan primaries to select the parties' nominees in the various districts on August 8, 2006. [1]
The Michigan House of Representatives is the lower house of the Michigan Legislature. There are 110 members, each of whom is elected from constituencies having approximately 77,000 to 91,000 residents, based on population figures from the 2010 U.S. Census. Its composition, powers, and duties are established in Article IV of the Michigan Constitution.
Party | Candidate | Votes | % | |
---|---|---|---|---|
Republican | Ed Gaffney | 19,500 | 51.96 | |
Democratic | Tim Bledsoe | 17,374 | 46.3 | |
Green | Kristen Hamel | 652 | 1.74 | |
Total votes | 37,526 | 100.0 | ||
Republican hold | ||||
Party | Candidate | Votes | % | |
---|---|---|---|---|
Democratic | LaMar Lemmons | 16,110 | 95.89 | |
Republican | Edith Floyd | 690 | 4.11 | |
Total votes | 16,800 | 100.0 | ||
Democratic hold | ||||
Party | Candidate | Votes | % | |
---|---|---|---|---|
Democratic | Bettie Cook Scott | 17,623 | 94.41 | |
Republican | Shirley Lamar | 694 | 3.72 | |
Green | Fred Vitale | 350 | 1.87 | |
Total votes | 18,667 | 100.0 | ||
Democratic hold | ||||
Party | Candidate | Votes | % | |
---|---|---|---|---|
Democratic | Coleman Young II | 18,841 | 93.9 | |
Republican | Scott Withington | 1,225 | 6.1 | |
Total votes | 20,066 | 100.0 | ||
Democratic hold | ||||
Party | Candidate | Votes | % | |
---|---|---|---|---|
Democratic | Bert Johnson | 15,698 | 100 | |
Total votes | 15,698 | 100.0 | ||
Democratic hold | ||||
Party | Candidate | Votes | % | |
---|---|---|---|---|
Democratic | Marsha Cheeks | 18,373 | 95.27 | |
Republican | Charity Renee Jones | 912 | 4.73 | |
Total votes | 19,285 | 100.0 | ||
Democratic hold | ||||
Party | Candidate | Votes | % | |
---|---|---|---|---|
Democratic | Virgil Smith, Jr. | 21,083 | 97.21 | |
Green | Derek Grigsby | 605 | 2.79 | |
Total votes | 21,688 | 100.0 | ||
Democratic hold | ||||
Party | Candidate | Votes | % | |
---|---|---|---|---|
Democratic | George Cushingberry, Jr. | 28,241 | 96.71 | |
Republican | Melvin Byrd | 961 | 3.29 | |
Total votes | 29,202 | 100.0 | ||
Democratic hold | ||||
Party | Candidate | Votes | % | |
---|---|---|---|---|
Democratic | Shanelle Jackson | 23,234 | 93.72 | |
Independent | Ron March | 1,556 | 6.28 | |
Total votes | 24,790 | 100.0 | ||
Democratic hold | ||||
Party | Candidate | Votes | % | |
---|---|---|---|---|
Democratic | Gabe Leland | 17,885 | 93.9 | |
Republican | Thomas Schaut | 1,161 | 6.1 | |
Total votes | 19,046 | 100.0 | ||
Democratic hold | ||||
Party | Candidate | Votes | % | |
---|---|---|---|---|
Democratic | Morris Hood | 21,489 | 100 | |
Total votes | 21,489 | 100.0 | ||
Democratic hold | ||||
Party | Candidate | Votes | % | |
---|---|---|---|---|
Democratic | Steve Tobocman | 9,365 | 95.67 | |
Libertarian | Raymond Warner | 424 | 4.33 | |
Total votes | 9,789 | 100.0 | ||
Democratic hold | ||||
Party | Candidate | Votes | % | |
---|---|---|---|---|
Democratic | Barbara Farrah | 22,411 | 69.36 | |
Republican | Darrell Stasik | 9,902 | 30.64 | |
Total votes | 32,313 | 100.0 | ||
Democratic hold | ||||
Party | Candidate | Votes | % | |
---|---|---|---|---|
Democratic | Ed Clemente | 21,767 | 78.28 | |
Republican | Dave Stone | 6,038 | 21.72 | |
Total votes | 27,805 | 100.0 | ||
Democratic hold | ||||
Party | Candidate | Votes | % | |
---|---|---|---|---|
Democratic | Gino Polidori | 21,391 | 76 | |
Republican | Abbas Ghasham | 6,755 | 24 | |
Total votes | 28,146 | 100.0 | ||
Democratic hold | ||||
Party | Candidate | Votes | % | |
---|---|---|---|---|
Democratic | Bob Constan | 19,274 | 73.36 | |
Republican | Jeremy DeLozier | 7,000 | 26.64 | |
Total votes | 26,274 | 100.0 | ||
Democratic hold | ||||
Party | Candidate | Votes | % | |
---|---|---|---|---|
Democratic | Andy Dillon | 25,157 | 77.42 | |
Republican | Zhelinrentice Clampitt | 7,336 | 22.58 | |
Total votes | 32,493 | 100.0 | ||
Democratic hold | ||||
Party | Candidate | Votes | % | |
---|---|---|---|---|
Democratic | Richard LeBlanc | 19,065 | 73.12 | |
Republican | Sam Durante | 6,298 | 24.16 | |
Constitution | Harold Dunn | 710 | 2.72 | |
Total votes | 26,073 | 100.0 | ||
Democratic hold | ||||
Party | Candidate | Votes | % | |
---|---|---|---|---|
Republican | John Pastor | 22,627 | 55.19 | |
Democratic | Brian Duggan | 18,372 | 44.81 | |
Total votes | 40,999 | 100.0 | ||
Republican hold | ||||
Party | Candidate | Votes | % | |||
---|---|---|---|---|---|---|
Democratic | Marc Corriveau | 20,051 | 51.16 | |||
Republican | Mark Abbo | 19,140 | 48.84 | |||
Total votes | 39,191 | 100.0 | ||||
Democratic gain from Republican | ||||||
Party | Candidate | Votes | % | |
---|---|---|---|---|
Republican | Phil LaJoy | 21,478 | 56.16 | |
Democratic | Al Sinis | 16,769 | 43.84 | |
Total votes | 38,247 | 100.0 | ||
Republican hold | ||||
Party | Candidate | Votes | % | |
---|---|---|---|---|
Democratic | Hoon-Yung Hopgood | 19,259 | 73.97 | |
Republican | Ben Armstrong | 5,882 | 22.59 | |
Constitution | Rick Butkowski | 895 | 3.44 | |
Total votes | 26,036 | 100.0 | ||
Democratic hold | ||||
Party | Candidate | Votes | % | |
---|---|---|---|---|
Democratic | Kathleen Law | 21,636 | 63.05 | |
Republican | Linda Bostic | 12,677 | 36.95 | |
Total votes | 34,313 | 100.0 | ||
Democratic hold | ||||
Party | Candidate | Votes | % | |
---|---|---|---|---|
Republican | Jack Brandenburg | 22,256 | 59.34 | |
Democratic | Karen Abdella | 14,640 | 39.04 | |
Constitution | Frederick Powell | 608 | 1.62 | |
Total votes | 37,504 | 100.0 | ||
Republican hold | ||||
Party | Candidate | Votes | % | |
---|---|---|---|---|
Democratic | Steve Bieda | 22,652 | 67.41 | |
Republican | Cecil St. Pierre | 100,156 | 30.22 | |
Libertarian | Michael Brylewski | 795 | 2.37 | |
Total votes | 123,603 | 100.0 | ||
Democratic hold | ||||
Party | Candidate | Votes | % | |
---|---|---|---|---|
Democratic | Marie Donigan | 22,077 | 62.2 | |
Republican | Kevin Konczal | 12,357 | 34.82 | |
Libertarian | James Young | 1,057 | 2.98 | |
Total votes | 35,491 | 100.0 | ||
Democratic hold | ||||
Party | Candidate | Votes | % | |
---|---|---|---|---|
Democratic | Andy Meisner | 27,288 | 78.89 | |
Republican | Will Sears | 7,304 | 21.11 | |
Total votes | 34,592 | 100.0 | ||
Democratic hold | ||||
Party | Candidate | Votes | % | |
---|---|---|---|---|
Democratic | Lisa Wojno | 19,957 | 75.18 | |
Republican | Timothy Knue | 6,589 | 24.82 | |
Total votes | 26,546 | 100.0 | ||
Democratic hold | ||||
Party | Candidate | Votes | % | |
---|---|---|---|---|
Democratic | Tim Melton | 3,740 | 61.95 | |
Republican | Tom March | 2,297 | 38.05 | |
Total votes | 6,037 | 100.0 | ||
Democratic hold | ||||
Party | Candidate | Votes | % | |
---|---|---|---|---|
Republican | Tory Rocca | 19,387 | 59.74 | |
Democratic | Rose Marie Fessler | 13,066 | 40.26 | |
Total votes | 32,453 | 100.0 | ||
Republican hold | ||||
Party | Candidate | Votes | % | |
---|---|---|---|---|
Democratic | Fred Miller | 18,583 | 62.55 | |
Republican | Daniel Tollis | 10,348 | 34.83 | |
Libertarian | James Miller | 777 | 2.62 | |
Total votes | 29,708 | 100.0 | ||
Democratic hold | ||||
Party | Candidate | Votes | % | |
---|---|---|---|---|
Republican | Dan Acciavatti | 20,716 | 58.76 | |
Democratic | Jill Lezotte | 13,841 | 39.26 | |
Libertarian | Joseph Zemens | 701 | 1.99 | |
Total votes | 35,258 | 100.0 | ||
Republican hold | ||||
Party | Candidate | Votes | % | |
---|---|---|---|---|
Republican | Kimberly Meltzer | 21,753 | 53.59 | |
Democratic | Gary Cynowa | 18,838 | 46.41 | |
Total votes | 40,591 | 100.0 | ||
Republican hold | ||||
Party | Candidate | Votes | % | |
---|---|---|---|---|
Democratic | Brenda Clack | 18,454 | 90.46 | |
Republican | Ronald Arnott | 1,946 | 9.54 | |
Total votes | 20,400 | 100.0 | ||
Democratic hold | ||||
Party | Candidate | Votes | % | |
---|---|---|---|---|
Democratic | Paul Condino | 31,507 | 89.14 | |
Republican | Marc Zwick | 3,837 | 10.86 | |
Total votes | 35,344 | 100.0 | ||
Democratic hold | ||||
Party | Candidate | Votes | % | |
---|---|---|---|---|
Republican | Brian Palmer | 23,619 | 60.96 | |
Democratic | Robert Murphy | 15,124 | 39.04 | |
Total votes | 38,743 | 100.0 | ||
Republican hold | ||||
Party | Candidate | Votes | % | |
---|---|---|---|---|
Democratic | Aldo Vagnozzi | 23,177 | 61.72 | |
Republican | Dennis Malaney | 14,375 | 38.28 | |
Total votes | 37,552 | 100.0 | ||
Democratic hold | ||||
Party | Candidate | Votes | % | |
---|---|---|---|---|
Republican | Craig DeRoche | 22,310 | 59.93 | |
Democratic | Tim Jarrell | 14,914 | 40.07 | |
Total votes | 37,224 | 100.0 | ||
Republican hold | ||||
Party | Candidate | Votes | % | |
---|---|---|---|---|
Republican | David Law | 19,566 | 50.23 | |
Democratic | Lisa Brown | 19,385 | 49.77 | |
Total votes | 38,951 | 100.0 | ||
Republican hold | ||||
Party | Candidate | Votes | % | |
---|---|---|---|---|
Republican | Chuck Moss | 28,092 | 65.37 | |
Democratic | Syed Jafry | 14,880 | 34.63 | |
Total votes | 42,972 | 100.0 | ||
Republican hold | ||||
Party | Candidate | Votes | % | |
---|---|---|---|---|
Republican | Marty Knollenberg | 21,458 | 58.52 | |
Democratic | Eric Gregory | 15,208 | 41.48 | |
Total votes | 36,666 | 100.0 | ||
Republican hold | ||||
Party | Candidate | Votes | % | |
---|---|---|---|---|
Democratic | Frank Accavitti | 21,718 | 73.11 | |
Republican | Greg Fleming | 7,285 | 24.52 | |
Constitution | Brett Pfeil | 703 | ||
Total votes | 29,706 | 100.0 | ||
Democratic hold | ||||
Party | Candidate | Votes | % | |
---|---|---|---|---|
Republican | Fran Amos | 19,286 | 58.99 | |
Democratic | Kellie Riddell | 13,406 | 41.01 | |
Total votes | 32,692 | 100.0 | ||
Republican hold | ||||
Party | Candidate | Votes | % | |
---|---|---|---|---|
Republican | John Stakoe | 27,123 | 67.16 | |
Democratic | Mark Venie | 13,264 | 32.84 | |
Total votes | 40,387 | 100.0 | ||
Republican hold | ||||
Party | Candidate | Votes | % | |
---|---|---|---|---|
Republican | John Garfield | 24,212 | 59.64 | |
Democratic | Thomas Werth | 16,385 | 40.36 | |
Total votes | 40,597 | 100.0 | ||
Republican hold | ||||
Party | Candidate | Votes | % | |
---|---|---|---|---|
Republican | James Marleau | 23,742 | 60.97 | |
Democratic | Bill Pearson | 15,196 | 39.03 | |
Total votes | 38,938 | 100.0 | ||
Republican hold | ||||
Party | Candidate | Votes | % | |
---|---|---|---|---|
Republican | Joe Hune | 23,487 | 61.56 | |
Democratic | Mary Andersson | 14,664 | 38.44 | |
Total votes | 38,151 | 100.0 | ||
Republican hold | ||||
Party | Candidate | Votes | % | |
---|---|---|---|---|
Democratic | Richard Hammel | 22,174 | 67.43 | |
Republican | Dana Whitehead | 10,711 | 32.57 | |
Total votes | 32,885 | 100.0 | ||
Democratic hold | ||||
Party | Candidate | Votes | % | |
---|---|---|---|---|
Democratic | Lee Gonzzales | 22,637 | 75.24 | |
Republican | Bill Kelly | 7,451 | 24.76 | |
Total votes | 30,088 | 100.0 | ||
Democratic hold | ||||
Party | Candidate | Votes | % | |
---|---|---|---|---|
Democratic | Ted Hammon | 20,259 | 64.55 | |
Republican | Fred Mac Fortner | 11,126 | 35.45 | |
Total votes | 31,385 | 100.0 | ||
Democratic hold | ||||
Party | Candidate | Votes | % | |
---|---|---|---|---|
Republican | Dave Robertson | 21,812 | 50.8 | |
Democratic | Fred Starzyk | 21,125 | 49.2 | |
Total votes | 42,937 | 100.0 | ||
Republican hold | ||||
Party | Candidate | Votes | % | |
---|---|---|---|---|
Democratic | Pam Byrnes | 280,446 | 62.61 | |
Republican | Shannon Brown | 16,747 | 37.39 | |
Total votes | 297,193 | 100.0 | ||
Democratic hold | ||||
Party | Candidate | Votes | % | |
---|---|---|---|---|
Democratic | Rebekah Warren | 36,979 | 80 | |
Republican | Erik Sheagren | 5,898 | 17.49 | |
Independent | Matt Erard | 847 | 2.51 | |
Total votes | 43,724 | 100.0 | ||
Democratic hold | ||||
Party | Candidate | Votes | % | |
---|---|---|---|---|
Democratic | Alma Wheeler Smith | 22,246 | 69.24 | |
Republican | Tom Banks | 9,036 | 28.12 | |
Independent | David Helm | 849 | 2.64 | |
Total votes | 32,131 | 100.0 | ||
Democratic hold | ||||
Party | Candidate | Votes | % | |
---|---|---|---|---|
Democratic | Kathy Angerer | 23,409 | 63.93 | |
Republican | Matt Milosch | 13,208 | 36.07 | |
Total votes | 36,617 | 100.0 | ||
Democratic hold | ||||
Party | Candidate | Votes | % | |
---|---|---|---|---|
Democratic | Kate Ebli | 16,133 | 46.63 | |
Republican | John Manor | 16,133 | 46.63 | |
Total votes | 32,266 | 100.0 | ||
Democratic hold | ||||
Party | Candidate | Votes | % | |
---|---|---|---|---|
Democratic | Dudley Spade | 20,745 | 66.61 | |
Republican | Jim Koehn | 10,401 | 33.39 | |
Total votes | 31,146 | 100.0 | ||
Democratic hold | ||||
Party | Candidate | Votes | % | |
---|---|---|---|---|
Republican | Bruce Caswell | 21,317 | 72.9 | |
Democratic | Randy Smith | 7,925 | 27.1 | |
Total votes | 29,242 | 100.0 | ||
Republican hold | ||||
Party | Candidate | Votes | % | |
---|---|---|---|---|
Republican | Rick Shaffer | 19,028 | 66 | |
Democratic | Ed Pawlowski | 9,802 | 34 | |
Total votes | 28,830 | 100.0 | ||
Republican hold | ||||
Party | Candidate | Votes | % | |
---|---|---|---|---|
Democratic | Robert Jones | 18,925 | 70.76 | |
Republican | Armando Romero | 7,821 | 29.24 | |
Total votes | 26,746 | 100.0 | ||
Democratic hold | ||||
Party | Candidate | Votes | % | |
---|---|---|---|---|
Republican | Jack Hoogendyk | 21,073 | 50.57 | |
Democratic | Julie Rogers | 20,600 | 49.43 | |
Total votes | 41,673 | 100.0 | ||
Republican hold | ||||
Party | Candidate | Votes | % | |
---|---|---|---|---|
Republican | Mike Nofs | 15,643 | 53.62 | |
Democratic | Lynn Haley | 13,531 | 46.38 | |
Total votes | 29,174 | 100.0 | ||
Republican hold | ||||
Party | Candidate | Votes | % | |
---|---|---|---|---|
Republican | Lorence Wenke | 21,261 | 55.07 | |
Democratic | Phyllis Smith | 17,349 | 44.93 | |
Total votes | 38,610 | 100.0 | ||
Republican hold | ||||
Party | Candidate | Votes | % | |
---|---|---|---|---|
Democratic | Martin Griffin | 15,703 | 52.55 | |
Republican | Rick Baxter | 14,177 | 47.45 | |
Total votes | 29,880 | 100.0 | ||
Democratic hold | ||||
Party | Candidate | Votes | % | |
---|---|---|---|---|
Democratic | Mike Simpson | 16,721 | 52.51 | |
Republican | Leslie Mortimer | 15,123 | 47.49 | |
Total votes | 31,844 | 100.0 | ||
Democratic hold | ||||
Party | Candidate | Votes | % | |
---|---|---|---|---|
Republican | Chris Ward | 27,772 | 65.75 | |
Democratic | Michael McGonegal | 14,469 | 34.25 | |
Total votes | 42,241 | 100.0 | ||
Republican hold | ||||
Party | Candidate | Votes | % | |
---|---|---|---|---|
Democratic | Barb Byrum | 22,837 | 59.66 | |
Republican | Donald Vickers | 15,439 | 40.34 | |
Total votes | 38,276 | 100.0 | ||
Democratic hold | ||||
Party | Candidate | Votes | % | |
---|---|---|---|---|
Democratic | Joan Bauer | 22,830 | 74.32 | |
Republican | Harilaos Sorovigas | 6,073 | 19.77 | |
Independent | Charles Ford | 1,485 | 4.83 | |
Constitution | DelRae Finnerty | 331 | 1.08 | |
Total votes | 30,719 | 100.0 | ||
Democratic hold | ||||
Party | Candidate | Votes | % | |
---|---|---|---|---|
Democratic | Mark Meadows | 21,962 | 67.69 | |
Republican | John Knowles | 10,485 | 32.31 | |
Total votes | 32,447 | 100.0 | ||
Democratic hold | ||||
Party | Candidate | Votes | % | |
---|---|---|---|---|
Republican | Judy Emmons | 18,392 | 63.21 | |
Democratic | Christopher Mahar | 10,704 | 36.79 | |
Total votes | 29,096 | 100.0 | ||
Republican hold | ||||
Party | Candidate | Votes | % | |
---|---|---|---|---|
Republican | Rick Jones | 23,711 | 58.49 | |
Democratic | Victor Braatz | 16,830 | 41.51 | |
Total votes | 40,541 | 100.0 | ||
Republican hold | ||||
Party | Candidate | Votes | % | |
---|---|---|---|---|
Republican | Glenn Steil | 27,004 | 65.62 | |
Democratic | Kyle Eric Hinton | 13,054 | 31.72 | |
Libertarian | William Wenzel | 591 | 1.44 | |
Constitution | William Mohr | 500 | 1.22 | |
Total votes | 41,149 | 100.0 | ||
Republican hold | ||||
Party | Candidate | Votes | % | |
---|---|---|---|---|
Republican | Tom Pearce | 28,636 | 64.55 | |
Democratic | Joseph Marckini | 14,714 | 33.17 | |
Libertarian | Steven Nickelson | 1,010 | 2.28 | |
Total votes | 44,360 | 100.0 | ||
Republican hold | ||||
Party | Candidate | Votes | % | |
---|---|---|---|---|
Republican | David Agema | 30,495 | 70.13 | |
Democratic | Steven Kauffman | 12,108 | 27.85 | |
Libertarian | Tracey McLaughlin | 880 | 2.02 | |
Total votes | 43,483 | 100.0 | ||
Republican hold | ||||
Party | Candidate | Votes | % | |
---|---|---|---|---|
Democratic | Robert Dean | 17,462 | 51.33 | |
Republican | Tim Doyle | 15,964 | 46.93 | |
Libertarian | Lauren Hillmer | 592 | 1.74 | |
Independent | Louise Jackson | 0 | 0 | |
Total votes | 34,018 | 100.0 | ||
Democratic hold | ||||
Party | Candidate | Votes | % | |
---|---|---|---|---|
Democratic | Michael Sak | 17,823 | 72.8 | |
Republican | Ted Liberski | 6,119 | 24.99 | |
Libertarian | Matthew Friar | 540 | 2.21 | |
Total votes | 24,482 | 100.0 | ||
Democratic hold | ||||
Party | Candidate | Votes | % | |
---|---|---|---|---|
Republican | Kevin Green | 21,350 | 67.47 | |
Democratic | Daniel Ficeli | 9,235 | 29.18 | |
Libertarian | John Stedman | 1,060 | 3.35 | |
Total votes | 31,645 | 100.0 | ||
Republican hold | ||||
Party | Candidate | Votes | % | |
---|---|---|---|---|
Republican | Neal Nitz | 14,037 | 51.82 | |
Democratic | Judy Truesdell | 13,052 | 48.18 | |
Total votes | 27,089 | 100.0 | ||
Republican hold | ||||
Party | Candidate | Votes | % | |
---|---|---|---|---|
Republican | John Proos | 19,660 | 65.02 | |
Democratic | Janet King | 10,576 | 34.98 | |
Total votes | 30,236 | 100.0 | ||
Republican hold | ||||
Party | Candidate | Votes | % | |
---|---|---|---|---|
Republican | Tonya Schuitmaker | 18,264 | 61.49 | |
Democratic | Jessie Olson | 11,440 | 38.51 | |
Total votes | 29,704 | 100.0 | ||
Republican hold | ||||
Party | Candidate | Votes | % | |
---|---|---|---|---|
Republican | Phil Pavlov | 22,365 | 60.15 | |
Democratic | Dan Donnellon | 14,816 | 39.85 | |
Total votes | 37,181 | 100.0 | ||
Republican hold | ||||
Party | Candidate | Votes | % | |
---|---|---|---|---|
Republican | John Stahl | 18,629 | 53.33 | |
Democratic | Dennis Harrand | 15,021 | 43 | |
Constitution | Brian Ervin | 1,281 | 3.67 | |
Total votes | 34,931 | 100.0 | ||
Republican hold | ||||
Party | Candidate | Votes | % | |
---|---|---|---|---|
Democratic | John Espinoza | 22,318 | 73.02 | |
Republican | Ed Smith | 8,245 | 26.98 | |
Total votes | 30,563 | 100.0 | ||
Democratic hold | ||||
Party | Candidate | Votes | % | |
---|---|---|---|---|
Democratic | Terry Brown | 18,421 | 51.46 | |
Republican | John Hunt | 17,378 | 48.54 | |
Total votes | 35,799 | 100.0 | ||
Democratic hold | ||||
Party | Candidate | Votes | % | |
---|---|---|---|---|
Republican | Dick Ball | 18,982 | 55.31 | |
Democratic | Judy Ford | 15,337 | 44.69 | |
Total votes | 34,319 | 100.0 | ||
Republican hold | ||||
Party | Candidate | Votes | % | |
---|---|---|---|---|
Republican | Dave Hildenbrand | 28,716 | 64.36 | |
Democratic | Melissa Casalina | 15,085 | 33.81 | |
Libertarian | Patricia Steinport | 819 | 1.84 | |
Total votes | 44,620 | 100.0 | ||
Republican hold | ||||
Party | Candidate | Votes | % | |
---|---|---|---|---|
Republican | Brian Calley | 21,527 | 56.36 | |
Democratic | Doug Kalnbach | 15,504 | 40.56 | |
Constitution | Walt Herwath | 1,195 | 3.13 | |
Total votes | 38,226 | 100.0 | ||
Republican hold | ||||
Party | Candidate | Votes | % | |
---|---|---|---|---|
Republican | Fulton Sheen | 23,633 | 61.08 | |
Democratic | Gery Weichman | 14,059 | 36.34 | |
Green | Pete Van | 999 | 2.58 | |
Total votes | 38,691 | 100.0 | ||
Republican hold | ||||
Party | Candidate | Votes | % | |
---|---|---|---|---|
Republican | Arlan Meekhof | 22,921 | 60.6 | |
Democratic | Don Bergman | 13,322 | 35.22 | |
Total votes | 36,243 | 100.0 | ||
Republican hold | ||||
Party | Candidate | Votes | % | |
---|---|---|---|---|
Republican | Bill Huizenga | 27,338 | 78.27 | |
Democratic | Clay Stauffer | 7,590 | 21.73 | |
Total votes | 34,928 | 100.0 | ||
Republican hold | ||||
Party | Candidate | Votes | % | |
---|---|---|---|---|
Democratic | Mary Valentine | 20,494 | 55.93 | |
Republican | David Farhat | 16,148 | 44.07 | |
Total votes | 36,642 | 100.0 | ||
Democratic hold | ||||
Party | Candidate | Votes | % | |
---|---|---|---|---|
Democratic | Doug Bennett | 18,700 | 70.38 | |
Republican | Marianne Harris-Darnell | 7,870 | 29.62 | |
Total votes | 26,570 | 100.0 | ||
Democratic hold | ||||
Party | Candidate | Votes | % | |
---|---|---|---|---|
Republican | Paul Opsommer | 21,284 | 56.24 | |
Democratic | Ronald McComb | 16,564 | 43.76 | |
Total votes | 37,848 | 100.0 | ||
Republican hold | ||||
Party | Candidate | Votes | % | |
---|---|---|---|---|
Republican | Kenneth Horn | 21,090 | 53.14 | |
Democratic | Bob Blaine | 18,595 | 46.86 | |
Total votes | 39,685 | 100.0 | ||
Republican hold | ||||
Party | Candidate | Votes | % | |
---|---|---|---|---|
Democratic | Andy Coulouris | 18,986 | 81.43 | |
Republican | Joel Wilson | 4,329 | 18.57 | |
Independent | Wilfred Beal | |||
Total votes | 23,315 | 100.0 | ||
Democratic hold | ||||
Party | Candidate | Votes | % | |
---|---|---|---|---|
Democratic | Jeff Mayes | 27,188 | 73.39 | |
Republican | Eric Schaefer | 9,857 | 26.61 | |
Total votes | 37,045 | 100.0 | ||
Democratic hold | ||||
Party | Candidate | Votes | % | |
---|---|---|---|---|
Republican | Tim Moore | 18,887 | 53.65 | |
Democratic | David Schwab | 16,315 | 46.35 | |
Total votes | 35,202 | 100.0 | ||
Republican hold | ||||
Party | Candidate | Votes | % | |
---|---|---|---|---|
Republican | John Moolenaar | 21,578 | 61.39 | |
Democratic | Jan Taylor Sutherland | 13,572 | 38.61 | |
Total votes | 35,150 | 100.0 | ||
Republican hold | ||||
Party | Candidate | Votes | % | |
---|---|---|---|---|
Republican | Bill Caul | 17,198 | 57.65 | |
Democratic | Loren Partlo | 12,632 | 42.35 | |
Total votes | 29,830 | 100.0 | ||
Republican hold | ||||
Party | Candidate | Votes | % | |
---|---|---|---|---|
Republican | Goeff Hansen | 19,138 | 58.48 | |
Democratic | Bill Richards | 13,590 | 41.52 | |
Total votes | 32,728 | 100.0 | ||
Republican hold | ||||
Party | Candidate | Votes | % | |
---|---|---|---|---|
Republican | David Palsrok | 21,779 | 51.96 | |
Democratic | Daniel Scripps | 20,132 | 48.04 | |
Total votes | 41,911 | 100.0 | ||
Republican hold | ||||
Party | Candidate | Votes | % | |
---|---|---|---|---|
Republican | Darwin L. Booher | 21,633 | 62 | |
Democratic | Nate Heffron | 13,257 | 38 | |
Total votes | 34,890 | 100.0 | ||
Republican hold | ||||
Party | Candidate | Votes | % | |
---|---|---|---|---|
Democratic | Joel Sheltrown | 25,155 | 68.69 | |
Republican | Raymond Moore | 11,468 | 31.31 | |
Total votes | 36,623 | 100.0 | ||
Democratic hold | ||||
Party | Candidate | Votes | % | |
---|---|---|---|---|
Republican | Howard Walker | 24,385 | 58.46 | |
Democratic | Roman Grucz | 17,328 | 41.54 | |
Total votes | 41,713 | 100.0 | ||
Republican hold | ||||
Party | Candidate | Votes | % | |
---|---|---|---|---|
Republican | Kevin Elsenheimer | 26,291 | 64.24 | |
Democratic | Tom Bauer | 14,635 | 35.76 | |
Total votes | 40,926 | 100.0 | ||
Republican hold | ||||
Party | Candidate | Votes | % | |
---|---|---|---|---|
Democratic | Matt Gillard | 23,675 | 64.86 | |
Republican | Howard Viegelahn | 12,827 | 35.14 | |
Total votes | 36,502 | 100.0 | ||
Democratic hold | ||||
Party | Candidate | Votes | % | |
---|---|---|---|---|
Democratic | Gary McDowell | 20,286 | 59.49 | |
Republican | Michael Duggan | 13,816 | 40.51 | |
Total votes | 34,102 | 100.0 | ||
Democratic hold | ||||
Party | Candidate | Votes | % | |
---|---|---|---|---|
Republican | Tom Casperson | 17,816 | 55.48 | |
Democratic | Judy Nerat | 14,297 | 44.52 | |
Total votes | 32,113 | 100.0 | ||
Republican hold | ||||
Party | Candidate | Votes | % | |
---|---|---|---|---|
Democratic | Steven Lindberg | 21,398 | 67.07 | |
Republican | Joel Westrom | 10,504 | 32.93 | |
Total votes | 31,902 | 100.0 | ||
Democratic hold | ||||
Party | Candidate | Votes | % | |
---|---|---|---|---|
Democratic | Michael Lahti | 19,361 | 63.4 | |
Republican | Dave Schmidt | 10,357 | 33.92 | |
Constitution | James Niemela | 820 | 2.69 | |
Total votes | 30,538 | 100.0 | ||
Democratic hold | ||||
Michael J. Rogers is a former U.S. Representative for Michigan's 8th congressional district. A member of the Republican Party, Rogers served from 2001 to 2015. From 2011 to 2015, he was Chairman of the Permanent Select Committee on Intelligence.
The Michigan Legislature is the legislature of the U.S. state of Michigan. It is organized as a bicameral body composed of an upper chamber, the Senate, and a lower chamber, the House of Representatives. Article IV of the Michigan Constitution, adopted in 1963, defines the role of the Legislature and how it is to be constituted. The primary purpose of the Legislature is to enact new laws and amend or repeal existing laws. The Legislature meets in the Capitol building in Lansing.
Sander Martin Levin is an American politician who served in the United States House of Representatives from 1983 to 2019, representing Michigan's 9th congressional district. Levin, a member of the Democratic Party from Michigan, is a former ranking member on the House Ways and Means Committee; he was Chairman of the Ways and Means Committee from 2010 to 2011. He is the older brother of former U.S. Senator Carl Levin.
The Michigan Senate is the upper house of the Legislature of the U.S. State of Michigan. Along with the House of Representatives, it composes the Michigan Legislature. Article IV of the Michigan Constitution, adopted in 1963, defines the role of the Legislature and how it is to be constituted. The primary purpose of the Legislature is to enact new laws and amend or repeal existing laws.
Carolyn Jean Cheeks Kilpatrick is an American politician who was U.S. Representative for Michigan's 13th congressional district from 1997 to 2011. She is a member of the Democratic Party. In August 2010 she lost the Democratic primary election. She was replaced by Hansen Clarke in January 2011.
Thaddeus George McCotter is an American politician, radio host, and a member of the Republican Party who was the U.S. Representative from Michigan's 11th congressional district from 2003 to 2012. The district at the time consisted of portions of Detroit's northwestern suburbs, such as Livonia, Westland and Novi.
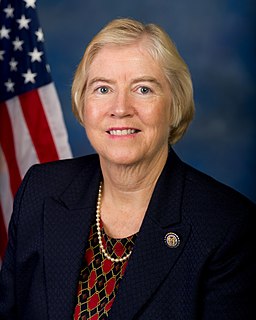
Candice Sue Miller is an American politician who was the U.S. Representative for Michigan's 10th congressional district from 2003 to 2017. She is former Michigan Secretary of State, Macomb County Treasurer, and Harrison Township Supervisor. She is a member of the Republican Party. In November 2016, she was elected Macomb County Public Works commissioner, defeating 6-term incumbent Anthony Marrocco.
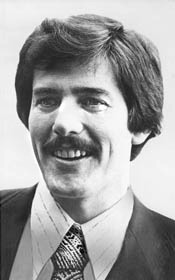
Milton Robert Carr, commonly known as Bob Carr, is an American lawyer and politician from the U.S. state of Michigan.
Richard Franklin Vander Veen was a politician from the U.S. state of Michigan.
Timothy Lee Walberg is an American politician and former pastor. A Republican, he has served as the U.S. Representative for Michigan's 7th congressional district since 2011. He previously represented the district from 2007-09.
Kit Francis Clardy was a politician from the U.S. state of Michigan. He was also known as Michigan's McCarthy, referring to his affinity for the controversial anti-communist U.S. Senator Joseph McCarthy.
Hansen Clarke is an American politician and former U.S. Congressman. A Democrat, he was the U.S. Representative for Michigan's 13th congressional district from 2011 to 2013. Prior to his election to Congress, he had been a member of the Michigan House of Representatives from 1991 through 1992 and from 1999 through 2002, and had represented the 1st District in the Michigan Senate from 2003 to 2011. Clarke was also the first U.S. Congressman of Bangladeshi descent.
The 2008 congressional elections in Michigan were held on November 4, 2008 to determine who would represent the state of Michigan in the United States House of Representatives. Michigan had fifteen seats in the House, apportioned according to the 2000 United States Census. Representatives are elected for two-year terms; those elected will serve in the 111th Congress from January 4, 2009 until January 3, 2011. The election coincided with the 2008 U.S. presidential election.
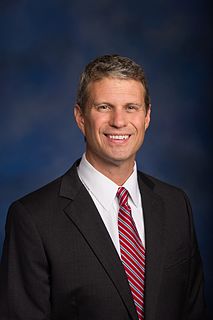
William Patrick Huizenga is an American politician serving as the U.S. Representative for Michigan's 2nd congressional district since 2011. A member of the Republican Party, he previously served in the Michigan House of Representatives from 2003 to 2009.
The 2006 congressional elections in Michigan was held on November 4, 2006 to determine who would represent the state of Michigan in the United States House of Representatives. Michigan had fifteen seats in the House, apportioned according to the 2000 United States Census. Representatives are elected for two-year terms. All fifteen incumbents ran for re-election, and all of them got re-elected except Joe Schwarz, who lost his primary.
John Robert Moolenaar represents Michigan's Fourth Congressional District in the U.S. House of Representatives. He is a Republican.
Andrew Saul Levin is an American attorney and politician who serves as the U.S. Representative for Michigan's 9th congressional district. The district includes most of Detroit's northern and northeastern suburbs, such as Mount Clemens, Royal Oak, Clinton Township, Warren, Ferndale, Fraser, Sterling Heights, Eastpointe and St. Clair Shores.
Haley Maria Stevens is an American politician from the state of Michigan. A Democrat, she is the member of the United States House of Representatives from Michigan's 11th congressional district. The district includes many of Detroit's northern suburbs, such as Auburn Hills, Troy, Livonia, Canton Township, Bloomfield Hills, West Bloomfield Township, Novi, Rochester Hills, Birmingham and Northville.