| |||||||||||||||||||||||||||||||
110 seats in the Michigan House of Representatives 56 seats needed for a majority | |||||||||||||||||||||||||||||||
---|---|---|---|---|---|---|---|---|---|---|---|---|---|---|---|---|---|---|---|---|---|---|---|---|---|---|---|---|---|---|---|
Turnout | 4,424,051 (59.34%) | ||||||||||||||||||||||||||||||
| |||||||||||||||||||||||||||||||
|
Elections in Michigan | ||||||||||
---|---|---|---|---|---|---|---|---|---|---|
| ||||||||||
The 2012 Michigan House of Representatives elections were held on November 6, 2012, with partisan primaries to select the parties' nominees in the various districts on August 7, 2012. With gerrymandering, the Republican Party retained majority in the House of Representatives despite lost of the popular vote.
Gerrymandering is a practice intended to establish a political advantage for a particular party or group by manipulating district boundaries. The resulting district is known as a gerrymander ; however, that word is also a verb for the process. The term gerrymandering has negative connotations. Two principal tactics are used in gerrymandering: "cracking" and "packing". A third tactic, shown in the top-left diagram in the graphic to the right, is homogenization of all districts.
State Representative Roy Schmidt was defeated for re-election after assisting in engineering an election-rigging scandal by which he switched from the Democratic to the Republican Party and recruited a straw candidate to run as a Democrat in order to ensure a swift re-election. The scandal ultimately cost him his seat in the House. Speaker of the House James "Jase" Bolger was also implicated in the scandal, and his race for the 63rd District was made competitive because of his role in it. The matter was referred to Ingham County Circuit Court Judge Rosemarie Aquilina, serving as a one-person grand jury, who ruled in August 2013 that neither Schmidt nor Bogler had committed a crime. [1]
Due to the term limit provisions in the Michigan Constitution, the following Members were ineligible to stand for election again to the House:
David Agema is a politician from the U.S. state of Michigan. Presently the chairman of the Top Gun Republican political action committee, he is a former member of the Michigan House of Representatives and of the Republican National Committee. Agema, formerly a commercial pilot for American Airlines, is an Air Force Reserve veteran. He currently resides in Grandville, Michigan.
Joan Bauer is a Democratic Party politician from Michigan. She was a member of the Michigan House of Representatives from the 68th District, which is in Ingham County in the northern portion of the city of Lansing.
Barbara Anne "Barb" Byrum is a Democratic politician from the State of Michigan. Byrum currently serves as the Ingham County Clerk. Prior to her election to the position of Clerk, Byrum represented the 67th District in the Michigan House of Representatives. She succeeded her mother, House Minority Leader Dianne Byrum. She owns Byrum Hardware in Charlotte, Michigan and lives in Onondaga with her husband Brad Delaney and their two children.
Party | Candidate | Votes | % | |
---|---|---|---|---|
Democratic | Brian Banks | 27,843 | 70.79 | |
Republican | Dan Schulte | 11,489 | 29.21 | |
Total votes | 39,332 | 100.0 | ||
Democratic hold | ||||
Party | Candidate | Votes | % | |
---|---|---|---|---|
Democratic | Alberta Tinsley-Talabi | 28,990 | 71.78 | |
Republican | Daniel Grano | 10,459 | 25.89 | |
Green | Hans Christopher Barbe | 938 | 2.23 | |
Total votes | 40,387 | 100.0 | ||
Democratic hold | ||||
Party | Candidate | Votes | % | |
---|---|---|---|---|
Democratic | John Olumba | 33,938 | 95.86 | |
Republican | Dolores Brodersen | 1,029 | 2.91 | |
Green | Louis Novak | 436 | 1.23 | |
Total votes | 35,403 | 100.0 | ||
Democratic hold | ||||
Party | Candidate | Votes | % | |
---|---|---|---|---|
Democratic | Rose Mary Robinson | 27,512 | 95.30 | |
Republican | Ron Michalski | 1,356 | 4.70 | |
Total votes | 28,868 | 100.0 | ||
Democratic hold | ||||
Party | Candidate | Votes | % | |
---|---|---|---|---|
Democratic | Fred Durhal, Jr. | 22,996 | 94.21 | |
Republican | Samuel Rodriguez | 1,413 | 5.79 | |
Total votes | 24,409 | 100.0 | ||
Democratic hold | ||||
Party | Candidate | Votes | % | |
---|---|---|---|---|
Democratic | Rashida Tlaib | 28,794 | 92.19 | |
Republican | Darrin Daigle | 1,588 | 5.08 | |
Green | Elena Herrada | 853 | 2.73 | |
Total votes | 31,235 | 100.0 | ||
Democratic hold | ||||
Party | Candidate | Votes | % | |
---|---|---|---|---|
Democratic | Thomas Stallworth III | 39,384 | 97.98 | |
Republican | Mark Ashley Price | 813 | 2.02 | |
Total votes | 40,197 | 100.0 | ||
Democratic hold | ||||
Party | Candidate | Votes | % | |
---|---|---|---|---|
Democratic | David Nathan | 38,792 | 96.92 | |
Republican | David Porter | 1,231 | 3.08 | |
Total votes | 40,023 | 100.0 | ||
Democratic hold | ||||
Party | Candidate | Votes | % | |
---|---|---|---|---|
Democratic | Harvey Santana | 32,063 | 95.34 | |
Republican | Rene Simpson | 1,567 | 4.66 | |
Total votes | 33,630 | 100.0 | ||
Democratic hold | ||||
Party | Candidate | Votes | % | |
---|---|---|---|---|
Democratic | Phil Cavanagh | 36,190 | 86.43 | |
Republican | Jasmine Bridges | 5,682 | 13.57 | |
Total votes | 41,872 | 100.0 | ||
Democratic hold | ||||
Party | Candidate | Votes | % | |
---|---|---|---|---|
Democratic | David Knezek | 27,626 | 71.75 | |
Republican | Kathleen Kopczyk | 10,875 | 28.25 | |
Total votes | 38,501 | 100.0 | ||
Democratic hold | ||||
Party | Candidate | Votes | % | |
---|---|---|---|---|
Democratic | Doug Geiss | 28,498 | 75.21 | |
Republican | Joanne Michalik | 9,395 | 24.79 | |
Total votes | 37,893 | 100.0 | ||
Democratic hold | ||||
Party | Candidate | Votes | % | |
---|---|---|---|---|
Democratic | Andrew Kandrevas | 25,496 | 64.56 | |
Republican | Tony Amorose | 13,996 | 35.44 | |
Total votes | 39,492 | 100.0 | ||
Democratic hold | ||||
Party | Candidate | Votes | % | |
---|---|---|---|---|
Democratic | Paul Clemente | 23,993 | 70.92 | |
Republican | Edward Gubics | 8,763 | 25.90 | |
Libertarian | Loel Gnadt | 1,076 | 3.18 | |
Total votes | 33,832 | 100.0 | ||
Democratic hold | ||||
Party | Candidate | Votes | % | |
---|---|---|---|---|
Democratic | George Darany | 26,465 | 75.04 | |
Republican | Priscilla Parness | 8,804 | 24.96 | |
Total votes | 35,269 | 100.0 | ||
Democratic hold | ||||
Party | Candidate | Votes | % | |
---|---|---|---|---|
Democratic | Robert Kosowski | 25,147 | 67.65 | |
Republican | Mary Stargell | 10,277 | 27.65 | |
Libertarian | Steven Boron | 1,039 | 2.80 | |
Total votes | 36,463 | 100.0 | ||
Democratic hold | ||||
Party | Candidate | Votes | % | |
---|---|---|---|---|
Democratic | Bill LaVoy | 22,339 | 61.32 | |
Republican | Anne Rossio | 14,092 | 38.68 | |
Total votes | 36,431 | 100.0 | ||
Democratic hold | ||||
Party | Candidate | Votes | % | |
---|---|---|---|---|
Democratic | Sarah Roberts | 29,438 | 63.54 | |
Republican | Candice Rusie | 15,671 | 33.82 | |
Libertarian | Daniel Flamand | 1,223 | 2.64 | |
Total votes | 46,332 | 100.0 | ||
Democratic hold | ||||
Party | Candidate | Votes | % | |
---|---|---|---|---|
Republican | John J. Walsh | 29,151 | 59.94 | |
Democratic | Richard Tannous | 19,480 | 40.06 | |
Total votes | 48,631 | 100.0 | ||
Republican hold | ||||
Party | Candidate | Votes | % | |
---|---|---|---|---|
Republican | Kurt Heise | 27,357 | 56.06 | |
Democratic | Timothy Roraback | 21,446 | 43.94 | |
Total votes | 48,803 | 100.0 | ||
Republican hold | ||||
Party | Candidate | Votes | % | |
---|---|---|---|---|
Democratic | Dian Slavens | 26,605 | 61.59 | |
Republican | Joe Barnabei | 16,590 | 38.41 | |
Total votes | 43,195 | 100.0 | ||
Democratic hold | ||||
Party | Candidate | Votes | % | |
---|---|---|---|---|
Democratic | Harold Haugh | 24,077 | 70.38 | |
Republican | Art Blundell | 10,134 | 29.62 | |
Total votes | 34,211 | 100.0 | ||
Democratic hold | ||||
Party | Candidate | Votes | % | |
---|---|---|---|---|
Republican | Pat Somerville | 22,810 | 50.49 | |
Democratic | Tom Boritzki | 22,371 | 49.51 | |
Total votes | 45,181 | 100.0 | ||
Republican hold | ||||
Party | Candidate | Votes | % | |
---|---|---|---|---|
Republican | Anthony G. Forlini | 22,360 | 54.71 | |
Democratic | Philip Kurczewski | 18,508 | 45.29 | |
Total votes | 40,868 | 100.0 | ||
Republican hold | ||||
Party | Candidate | Votes | % | |
---|---|---|---|---|
Democratic | Henry Yanez | 20,771 | 51.43 | |
Republican | Sean Clark | 19,617 | 48.57 | |
Total votes | 40,388 | 100.0 | ||
Democratic hold | ||||
Party | Candidate | Votes | % | |
---|---|---|---|---|
Democratic | Jim Townsend | 26,094 | 60.36 | |
Republican | Mark Bliss | 15,502 | 35.86 | |
Libertarian | James Young | 1,636 | 3.78 | |
Total votes | 43,232 | 100.0 | ||
Democratic hold | ||||
Party | Candidate | Votes | % | |
---|---|---|---|---|
Democratic | Ellen Cogen Lipton | 34,389 | 75.61 | |
Republican | Ezra Drissman | 9,253 | 20.34 | |
Libertarian | John Wierzbicki | 1,841 | 4.05 | |
Total votes | 45,483 | 100.0 | ||
Democratic hold | ||||
Party | Candidate | Votes | % | |
---|---|---|---|---|
Democratic | Jon Switalski | 24,025 | 71.49 | |
Republican | Steven Klusek | 9,580 | 28.51 | |
Total votes | 33,605 | 100.0 | ||
Democratic hold | ||||
Party | Candidate | Votes | % | |
---|---|---|---|---|
Democratic | Tim Greimel | 25,577 | 77.40 | |
Republican | Brian Stebick | 7,467 | 22.60 | |
Total votes | 33,044 | 100.0 | ||
Democratic hold | ||||
Party | Candidate | Votes | % | |
---|---|---|---|---|
Republican | Jeff Farrington | 18,160 | 53.25 | |
Democratic | Joseph Bogdan | 15,943 | 46.75 | |
Total votes | 34,103 | 100.0 | ||
Republican hold | ||||
Party | Candidate | Votes | % | |
---|---|---|---|---|
Democratic | Marilyn Lane | 24,443 | 61.74 | |
Republican | Lynn Evans | 13,404 | 33.86 | |
Libertarian | James Miller | 1,742 | 4.40 | |
Total votes | 39,589 | 100.0 | ||
Democratic hold | ||||
Party | Candidate | Votes | % | |
---|---|---|---|---|
Republican | Andrea LaFontaine | 22,842 | 58.62 | |
Democratic | Sheri Smith | 16,122 | 41.38 | |
Total votes | 38,964 | 100.0 | ||
Republican hold | ||||
Party | Candidate | Votes | % | |
---|---|---|---|---|
Republican | Ken Goike | 24,163 | 61.91 | |
Democratic | Marth O'Kray | 14,869 | 38.09 | |
Total votes | 39,032 | 100.0 | ||
Republican hold | ||||
Party | Candidate | Votes | % | |
---|---|---|---|---|
Democratic | Woodrow Stanley | 28,816 | 86.92 | |
Republican | Bruce Rogers | 4,336 | 13.08 | |
Total votes | 33,152 | 100.0 | ||
Democratic hold | ||||
Party | Candidate | Votes | % | |
---|---|---|---|---|
Democratic | Rudy Hobbs | 43,993 | 83.03 | |
Republican | Timothy Sulowski | 8,989 | 16.97 | |
Total votes | 52,982 | 100.0 | ||
Democratic hold | ||||
Party | Candidate | Votes | % | |
---|---|---|---|---|
Republican | Pete Lund | 26,870 | 64.14 | |
Democratic | Robert Murphy | 15,024 | 35.86 | |
Total votes | 41,894 | 100.0 | ||
Republican hold | ||||
Party | Candidate | Votes | % | |
---|---|---|---|---|
Democratic | Vicki Barnett | 29,554 | 61.69 | |
Republican | Bruce Lilley | 18,354 | 38.31 | |
Total votes | 47,908 | 100.0 | ||
Democratic hold | ||||
Party | Candidate | Votes | % | |
---|---|---|---|---|
Republican | Hugh Crawford | 26,460 | 59.20 | |
Democratic | Chuck Tindall | 18,235 | 40.80 | |
Total votes | 44,695 | 100.0 | ||
Republican hold | ||||
Party | Candidate | Votes | % | |
---|---|---|---|---|
Republican | Klint Kesto | 24,382 | 53.25 | |
Democratic | Pam Jackson | 21,403 | 46.75 | |
Total votes | 45,785 | 100.0 | ||
Republican hold | ||||
Party | Candidate | Votes | % | |
---|---|---|---|---|
Republican | Michael McCready | 31,913 | 57.01 | |
Democratic | Dorian Coston | 22,757 | 40.65 | |
Libertarian | Steve Burgis | 1,312 | 2.34 | |
Total votes | 55,982 | 100.0 | ||
Republican hold | ||||
Party | Candidate | Votes | % | |
---|---|---|---|---|
Republican | Martin Howrylak | 23,404 | 50.46 | |
Democratic | Mary Kerwin | 22,977 | 49.54 | |
Total votes | 46,381 | 100.0 | ||
Republican hold | ||||
Party | Candidate | Votes | % | |
---|---|---|---|---|
Republican | Bill Rogers | 31,510 | 63.25 | |
Democratic | Shanda Willis | 16,476 | 33.07 | |
Libertarian | James Lewis | 1,830 | 3.67 | |
Total votes | 49,816 | 100.0 | ||
Republican hold | ||||
Party | Candidate | Votes | % | |
---|---|---|---|---|
Republican | Gail Haines | 26,554 | 60.76 | |
Democratic | Neil Billington | 17,149 | 39.24 | |
Total votes | 43,703 | 100.0 | ||
Republican hold | ||||
Party | Candidate | Votes | % | |
---|---|---|---|---|
Republican | Eileen Kowall | 29,772 | 62.79 | |
Democratic | Tom Crawford | 15,744 | 33.20 | |
Libertarian | Scott Poquette | 1,901 | 4.01 | |
Total votes | 47,417 | 100.0 | ||
Republican hold | ||||
Party | Candidate | Votes | % | |
---|---|---|---|---|
Republican | Tom McMillin | 25,972 | 56.00 | |
Democratic | Joanna VanRaaphorst | 20,408 | 44.00 | |
Total votes | 46,380 | 100.0 | ||
Republican hold | ||||
Party | Candidate | Votes | % | |
---|---|---|---|---|
Republican | Bradford Jacobsen | 27,764 | 63.72 | |
Democratic | Daniel Sargent | 15,810 | 36.28 | |
Total votes | 43,574 | 100.0 | ||
Republican hold | ||||
Party | Candidate | Votes | % | |
---|---|---|---|---|
Republican | Cindy Denby | 27,621 | 64.06 | |
Democratic | Shawn Lowe Desai | 13,888 | 32.21 | |
Libertarian | James Weeks | 1,607 | 3.73 | |
Total votes | 43,116 | 100.0 | ||
Republican hold | ||||
Party | Candidate | Votes | % | |
---|---|---|---|---|
Democratic | Pam Faris | 27,013 | 63.77 | |
Republican | Jeffrey Woolman | 15,344 | 36.23 | |
Total votes | 42,357 | 100.0 | ||
Democratic hold | ||||
Party | Candidate | Votes | % | |
---|---|---|---|---|
Democratic | Jim Ananich | 28,275 | 74.51 | |
Republican | Robert Daunt | 9,674 | 25.49 | |
Total votes | 37,949 | 100.0 | ||
Democratic hold | ||||
Party | Candidate | Votes | % | |
---|---|---|---|---|
Democratic | Charles Smiley | 26,678 | 60.85 | |
Republican | Miles Gadola | 17,165 | 39.15 | |
Total votes | 43,843 | 100.0 | ||
Democratic hold | ||||
Party | Candidate | Votes | % | |
---|---|---|---|---|
Republican | Joseph Graves | 26,170 | 54.33 | |
Democratic | Steven Losey | 22,001 | 45.67 | |
Total votes | 48,171 | 100.0 | ||
Republican hold | ||||
Party | Candidate | Votes | % | |||
---|---|---|---|---|---|---|
Democratic | Gretchen Driskell | 26,647 | 53.02 | |||
Republican | Mark Ouimet | 23,610 | 46.98 | |||
Total votes | 50,257 | 100.0 | ||||
Democratic gain from Republican | ||||||
Party | Candidate | Votes | % | |
---|---|---|---|---|
Democratic | Jeff Irwin | 32,576 | 80.93 | |
Republican | John Spisak | 7,672 | 19.07 | |
Total votes | 40,248 | 100.0 | ||
Democratic hold | ||||
Party | Candidate | Votes | % | |
---|---|---|---|---|
Democratic | David Rutledge | 29,949 | 77.45 | |
Republican | Bill Emmerich | 8,722 | 22.55 | |
Total votes | 38,671 | 100.0 | ||
Democratic hold | ||||
Party | Candidate | Votes | % | |
---|---|---|---|---|
Democratic | Adam Zemke | 26,197 | 64.46 | |
Republican | Owen Diaz | 13,029 | 32.06 | |
Green | David McMahon | 1,415 | 3.48 | |
Total votes | 40,641 | 100.0 | ||
Democratic hold | ||||
Party | Candidate | Votes | % | |
---|---|---|---|---|
Republican | Dale Zorn | 23,592 | 57.64 | |
Democratic | Larry Crider | 17,338 | 42.36 | |
Total votes | 40,930 | 100.0 | ||
Republican hold | ||||
Party | Candidate | Votes | % | |
---|---|---|---|---|
Republican | Nancy Jenkins | 21,150 | 52.50 | |
Democratic | James Berryman | 19,135 | 47.50 | |
Total votes | 40,285 | 100.0 | ||
Republican hold | ||||
Party | Candidate | Votes | % | |
---|---|---|---|---|
Republican | Kenneth Kurtz | 24,438 | 69.82 | |
Democratic | Amaryllis Thomas | 10,565 | 30.18 | |
Total votes | 35,003 | 100.0 | ||
Republican hold | ||||
Party | Candidate | Votes | % | |
---|---|---|---|---|
Republican | Matt Lori | 22,510 | 62.27 | |
Democratic | Mike Moroz | 13,640 | 37.73 | |
Total votes | 36,150 | 100.0 | ||
Republican hold | ||||
Party | Candidate | Votes | % | |
---|---|---|---|---|
Democratic | Sean McCann | 27,378 | 74.23 | |
Republican | Michael Perrin | 9,504 | 25.77 | |
Total votes | 36,882 | 100.0 | ||
Democratic hold | ||||
Party | Candidate | Votes | % | |
---|---|---|---|---|
Republican | Margaret O'Brien | 27,726 | 58.25 | |
Democratic | Michael Martin | 19,876 | 41.75 | |
Total votes | 47,602 | 100.0 | ||
Republican hold | ||||
Party | Candidate | Votes | % | |
---|---|---|---|---|
Democratic | Kate Segal | 21,129 | 57.67 | |
Republican | Mark Behnke | 15,511 | 42.33 | |
Total votes | 36,640 | 100.0 | ||
Democratic hold | ||||
Party | Candidate | Votes | % | |
---|---|---|---|---|
Republican | Jase Bolger | 22,196 | 50.87 | |
Democratic | Bill Farmer | 21,440 | 49.13 | |
Total votes | 43,636 | 100.0 | ||
Republican hold | ||||
Party | Candidate | Votes | % | |
---|---|---|---|---|
Republican | Earl Poleski | 20,190 | 56.21 | |
Democratic | Barbara Shelton | 15,729 | 43.79 | |
Total votes | 35,919 | 100.0 | ||
Republican hold | ||||
Party | Candidate | Votes | % | |
---|---|---|---|---|
Republican | Mike Shirkey | 22,862 | 56.81 | |
Democratic | Bonnie Johnson | 17,381 | 43.19 | |
Total votes | 40,243 | 100.0 | ||
Republican hold | ||||
Party | Candidate | Votes | % | |
---|---|---|---|---|
Republican | Aric Nesbitt | 22,997 | 58.56 | |
Democratic | Richard Rajkovich | 16,276 | 41.44 | |
Total votes | 39,273 | 100.0 | ||
Republican hold | ||||
Party | Candidate | Votes | % | |
---|---|---|---|---|
Democratic | Tom Cochran | 24,916 | 56.38 | |
Republican | Jeff Oesterle | 19,275 | 43.62 | |
Total votes | 44,191 | 100.0 | ||
Democratic hold | ||||
Party | Candidate | Votes | % | |
---|---|---|---|---|
Democratic | Andy Schor | 29,023 | 76.61 | |
Republican | Timothy Moede | 8,861 | 23.39 | |
Total votes | 37,884 | 100.0 | ||
Democratic hold | ||||
Party | Candidate | Votes | % | |
---|---|---|---|---|
Democratic | Sam Singh | 26,200 | 64.90 | |
Republican | Susan McGillicuddy | 14,172 | 35.10 | |
Total votes | 40,372 | 100.0 | ||
Democratic hold | ||||
Party | Candidate | Votes | % | |
---|---|---|---|---|
Republican | Rick Outman | 17,709 | 54.46 | |
Democratic | Mike Huckleberry | 14,809 | 45.54 | |
Total votes | 32,518 | 100.0 | ||
Republican hold | ||||
Party | Candidate | Votes | % | |||
---|---|---|---|---|---|---|
Democratic | Theresa Abed | 24,822 | 53.43 | |||
Republican | Deb Shaughnessy | 21,637 | 46.57 | |||
Total votes | 46,459 | 100.0 | ||||
Democratic gain from Republican | ||||||
Party | Candidate | Votes | % | |
---|---|---|---|---|
Republican | Ken Yonker | 24,653 | 58.53 | |
Democratic | Scott Urbanowski | 15,982 | 37.95 | |
Libertarian | William Wenzel | 1,481 | 3.52 | |
Total votes | 42,116 | 100.0 | ||
Republican hold | ||||
Party | Candidate | Votes | % | |
---|---|---|---|---|
Republican | Peter MacGregor | 32,466 | 63.46 | |
Democratic | G. Scott Schuiling | 16,489 | 32.23 | |
Libertarian | Ron Heeren | 1,537 | 3.0 | |
Constitution | Ted Gerrard | 666 | 1.30 | |
Total votes | 50,492 | 100.0 | ||
Republican hold | ||||
Party | Candidate | Votes | % | |
---|---|---|---|---|
Republican | Robert VerHeulen | 27,406 | 65.55 | |
Democratic | Richard Erdman | 14,406 | 34.45 | |
Total votes | 41,812 | 100.0 | ||
Republican hold | ||||
Party | Candidate | Votes | % | |
---|---|---|---|---|
Democratic | Brandon Dillon | 23,593 | 75.78 | |
Republican | William Nathan Sneller | 7,540 | 24.22 | |
Total votes | 31,133 | 100.0 | ||
Democratic hold | ||||
Party | Candidate | Votes | % | |||
---|---|---|---|---|---|---|
Democratic | Winnie Brinks | 23,530 | 52.06 | |||
Republican | Roy Schmidt | 12,337 | 27.30 | |||
Independent | Keith Allard | 1,398 | 3.09 | |||
Constitution | William Mohr | 1,362 | 3.01 | |||
Libertarian | Patricia Steinport | 1,085 | 2.40 | |||
Total votes | 37,265 | 100.0 | ||||
Democratic gain from Republican | ||||||
Party | Candidate | Votes | % | |
---|---|---|---|---|
Republican | Thomas Hooker | 23,599 | 60.37 | |
Democratic | Scott Barton | 14,191 | 36.30 | |
Libertarian | Larry Warner | 1,300 | 3.33 | |
Total votes | 39,090 | 100.0 | ||
Republican hold | ||||
Party | Candidate | Votes | % | |
---|---|---|---|---|
Republican | Dave Pagel | 23,227 | 61.08 | |
Democratic | Jack Arbanas | 14,802 | 38.92 | |
Total votes | 38,029 | 100.0 | ||
Republican hold | ||||
Party | Candidate | Votes | % | |
---|---|---|---|---|
Republican | Al Pscholka | 21,490 | 52.76 | |
Democratic | Jim Hahn | 18,630 | 45.74 | |
Constitution | Carl Oehling | 613 | 1.5 | |
Total votes | 40,733 | 100.0 | ||
Republican hold | ||||
Party | Candidate | Votes | % | |
---|---|---|---|---|
Republican | Bob Genetski | 25,440 | 62.22 | |
Democratic | Stuart Peet | 15,444 | 37.78 | |
Total votes | 40,884 | 100.0 | ||
Republican hold | ||||
Party | Candidate | Votes | % | |
---|---|---|---|---|
Republican | Daniel Lauwers | 20,929 | 53.84 | |
Democratic | Patrick Phelan | 17,945 | 46.16 | |
Total votes | 38,874 | 100.0 | ||
Republican hold | ||||
Party | Candidate | Votes | % | |
---|---|---|---|---|
Republican | Kevin Daley | 24,482 | 58.97 | |
Democratic | John Nugent | 17,032 | 41.03 | |
Total votes | 41,514 | 100.0 | ||
Republican hold | ||||
Party | Candidate | Votes | % | |
---|---|---|---|---|
Republican | Paul Muxlow | 19,750 | 55.74 | |
Democratic | Carol Campbell | 15,685 | 44.26 | |
Total votes | 35,435 | 100.0 | ||
Republican hold | ||||
Party | Candidate | Votes | % | |||
---|---|---|---|---|---|---|
Democratic | Terry Brown | 21,345 | 52.61 | |||
Republican | Dan Grimshaw | 15,480 | 38.15 | |||
Independent | Edward Canfield | 3,748 | 9.24 | |||
Total votes | 40,573 | 100.0 | ||||
Democratic gain from Republican | ||||||
Party | Candidate | Votes | % | |
---|---|---|---|---|
Republican | Ben Glardon | 23,185 | 53.59 | |
Democratic | Paul Ray | 17,278 | 39.93 | |
Independent | Matthew Shepard | 2,803 | 6.48 | |
Total votes | 43,266 | 100.0 | ||
Republican hold | ||||
Party | Candidate | Votes | % | |
---|---|---|---|---|
Republican | Lisa Posthumus Lyons | 30,715 | 70.23 | |
Democratic | Brian Bosak | 13,021 | 29.77 | |
Total votes | 43,736 | 100.0 | ||
Republican hold | ||||
Party | Candidate | Votes | % | |
---|---|---|---|---|
Republican | Mike Callton | 26,454 | 61.63 | |
Democratic | Sherry Anderson | 14,937 | 34.80 | |
Libertarian | Joseph Gillotte | 1,533 | 3.57 | |
Total votes | 42,924 | 100.0 | ||
Republican hold | ||||
Party | Candidate | Votes | % | |
---|---|---|---|---|
Republican | Roger Victory | 32,053 | 86.87 | |
Libertarian | Michael Perry | 4,843 | 13.13 | |
Total votes | 36,896 | 100.0 | ||
Republican hold | ||||
Party | Candidate | Votes | % | |
---|---|---|---|---|
Republican | Amanda Price | 29,776 | 65.72 | |
Democratic | Don Bergman | 15,530 | 34.28 | |
Total votes | 45,306 | 100.0 | ||
Republican hold | ||||
Party | Candidate | Votes | % | |
---|---|---|---|---|
Republican | Joseph Haveman | 31,592 | 100 | |
Total votes | 31,592 | 100.0 | ||
Republican hold | ||||
Party | Candidate | Votes | % | |||
---|---|---|---|---|---|---|
Democratic | Collene Lamonte | 19,257 | 48.10 | |||
Republican | Holly Hughes | 18,924 | 47.27 | |||
Libertarian | Nicholas Sundquist | 1,856 | 4.63 | |||
Total votes | 40,037 | 100.0 | ||||
Democratic gain from Republican | ||||||
Party | Candidate | Votes | % | |
---|---|---|---|---|
Democratic | Marcia Hovey-Wright | 21,244 | 73.10 | |
Republican | Travis Shepherd | 8,908 | 26.90 | |
Total votes | 30,152 | 100.0 | ||
Democratic hold | ||||
Party | Candidate | Votes | % | |
---|---|---|---|---|
Republican | Tom Leonard | 25,283 | 56.61 | |
Democratic | Paul Silva | 19,377 | 43.39 | |
Total votes | 44,660 | 100.0 | ||
Republican hold | ||||
Party | Candidate | Votes | % | |
---|---|---|---|---|
Republican | Tim Kelly | 26,256 | 56.00 | |
Democratic | Judith Lincoln | 20,630 | 44.00 | |
Total votes | 46,886 | 100.0 | ||
Republican hold | ||||
Party | Candidate | Votes | % | |
---|---|---|---|---|
Democratic | Stacy Erwin Oakes | 27,778 | 77.95 | |
Republican | Jeff Baker | 7,859 | 22.05 | |
Total votes | 35,637 | 100.0 | ||
Democratic hold | ||||
Party | Candidate | Votes | % | |
---|---|---|---|---|
Democratic | Charles Brunner | 28,263 | 69.46 | |
Republican | Chad Dewey | 12,428 | 30.54 | |
Total votes | 40,691 | 100.0 | ||
Democratic hold | ||||
Party | Candidate | Votes | % | |
---|---|---|---|---|
Republican | Joel Johnson | 23,295 | 61.82 | |
Democratic | Chris Breznau | 14,387 | 38.18 | |
Total votes | 37,682 | 100.0 | ||
Republican hold | ||||
Party | Candidate | Votes | % | |
---|---|---|---|---|
Republican | Jim Stamas | 25,003 | 58.89 | |
Democratic | Joan Brausch | 17,453 | 41.11 | |
Total votes | 42,456 | 100.0 | ||
Republican hold | ||||
Party | Candidate | Votes | % | |
---|---|---|---|---|
Republican | Kevin Cotter | 18,150 | 57.40 | |
Democratic | Adam Lawrence | 13,468 | 42.60 | |
Total votes | 31,618 | 100.0 | ||
Republican hold | ||||
Party | Candidate | Votes | % | |
---|---|---|---|---|
Republican | Jon Bumstead | 22,752 | 62.25 | |
Democratic | Ida DeHaas | 13,800 | 37.75 | |
Total votes | 36,552 | 100.0 | ||
Republican hold | ||||
Party | Candidate | Votes | % | |
---|---|---|---|---|
Republican | Ray Franz | 25,198 | 51.04 | |
Democratic | Allen O'Shea | 24,175 | 48.96 | |
Total votes | 49,373 | 100.0 | ||
Republican hold | ||||
Party | Candidate | Votes | % | |
---|---|---|---|---|
Republican | Philip Potvin | 19.281 | 54.78 | |
Democratic | Brendan Maturen | 15,916 | 45.22 | |
Total votes | 35,197 | 100.0 | ||
Republican hold | ||||
Party | Candidate | Votes | % | |
---|---|---|---|---|
Republican | Bruce Rendon | 23,308 | 52.80 | |
Democratic | Lon Johnson | 20,832 | 47.20 | |
Total votes | 44,140 | 100.0 | ||
Republican hold | ||||
Party | Candidate | Votes | % | |
---|---|---|---|---|
Republican | Wayne Schmidt | 26,042 | 56.50 | |
Democratic | Betsy Coffia | 20,049 | 43.50 | |
Total votes | 46,091 | 100.0 | ||
Republican hold | ||||
Party | Candidate | Votes | % | |
---|---|---|---|---|
Republican | Greg MacMaster | 30,725 | 66.74 | |
Democratic | William Wieske | 15,312 | 33.26 | |
Total votes | 46,037 | 100.0 | ||
Republican hold | ||||
Party | Candidate | Votes | % | |
---|---|---|---|---|
Republican | Peter Pettalia | 24,522 | 52.22 | |
Democratic | Kenneth Hubbard | 21,261 | 45.27 | |
Green | John Longhurst | 1,178 | 2.51 | |
Total votes | 46,961 | 100.0 | ||
Republican hold | ||||
Party | Candidate | Votes | % | |
---|---|---|---|---|
Republican | Frank Foster | 25,301 | 58.03 | |
Democratic | Suzanne Shumway | 18,301 | 41.97 | |
Total votes | 43,602 | 100.0 | ||
Republican hold | ||||
Party | Candidate | Votes | % | |
---|---|---|---|---|
Republican | Ed McBroom | 22,396 | 54.56 | |
Democratic | Sharon Gray | 18,653 | 45.44 | |
Total votes | 41,049 | 100.0 | ||
Republican hold | ||||
Party | Candidate | Votes | % | |
---|---|---|---|---|
Democratic | John Kivela | 23,350 | 58.37 | |
Republican | Jack Hubbard | 16,655 | 41.63 | |
Total votes | 40,005 | 100.0 | ||
Democratic hold | ||||
Party | Candidate | Votes | % | |||
---|---|---|---|---|---|---|
Democratic | Scott Dianda | 19,992 | 51.59 | |||
Republican | Matt Huuki | 18,759 | 48.41 | |||
Total votes | 38,751 | 100.0 | ||||
Democratic gain from Republican | ||||||
Party | Candidate | Votes | % | |
---|---|---|---|---|
Democratic | Phil Phelps | 4,894 | 63.41 | |
Republican | Don Pfeiffer | 2,501 | 32.40 | |
Libertarian | Pat Clawson | 323 | 4.19 | |
Total votes | 7,718 | 100.00 | ||
Democratic hold | ||||
Thaddeus George McCotter is an American politician, radio host, and a member of the Republican Party who was the U.S. Representative from Michigan's 11th congressional district from 2003 to 2012. The district at the time consisted of portions of Detroit's northwestern suburbs, such as Livonia, Westland and Novi.
The 1952 United States House of Representatives elections was an election for the United States House of Representatives in 1952 which coincided with the election of President Dwight Eisenhower. Eisenhower's Republican Party gained 22 seats from the Democratic Party, gaining a majority of the House. However, the Democrats technically had almost 250,000 more votes (0.4%). This would be the last time the Republican Party won a majority in the House until 1994. It was also the last election when both major parties increased their share of the popular vote simultaneously, largely due to the disintegration of the American Labor Party and other third parties. Finally, it would be the last time either party gained new control of the House of Representatives, coinciding with a presidential election.
The 2006 United States House of Representatives elections were held on November 7, 2006, to elect members to the United States House of Representatives. It took place in the middle of President George W. Bush's second term in office. All 435 seats of the House were up for election. Those elected served in the 110th United States Congress from January 3, 2007, until January 3, 2009. The incumbent majority party, the Republicans, had won majorities in the House consecutively since 1994, and were defeated by the Democrats who won a majority in the chamber, ending 12 years in opposition.
The 2008 United States House of Representatives elections were held on November 4, 2008, to elect members to the United States House of Representatives to serve in the 111th United States Congress from January 3, 2009, until January 3, 2011. It coincided with the election of Barack Obama as President. All 435 voting seats, as well as all 6 non-voting seats, were up for election. The Democratic Party, which won a majority of seats in the 2006 election, expanded its control in 2008. The Republican Party, hoping to regain the majority it lost in the 2006 election or at least expand its congressional membership, lost additional seats. With one exception, the only seats to switch from Democratic to Republican had been Republican-held prior to the 2006 elections. Republicans gained five Democratic seats total, while losing 26 of their own, giving the Democrats a net gain of 21 seats, effectively erasing all gains made by the GOP since 1994. In addition, with the defeat of a Republican congressman in Connecticut's 4th district, this became the first time since the 1850s that no Republican represented the New England region. The 10.6% popular vote advantage by the Democrats was the largest by either party since 1982, 26 years earlier. Turnout increased due to the 2008 presidential election. The presidential election, 2008 Senate elections, and 2008 state gubernatorial elections, as well as many other state and local elections, occurred on the same date.
Timothy Lee Walberg is an American politician and former pastor. A Republican, he has served as the U.S. Representative for Michigan's 7th congressional district since 2011. He previously represented the district from 2007-09.
Robert William Davis was an American politician from the state of Michigan. He represented the state's 11th congressional district, which at that time included the Upper Peninsula and a large portion of Northern Michigan, in the United States House of Representatives from 1979 until 1993.
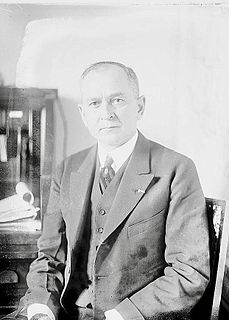
Roy Orchard Woodruff was a politician, soldier, printer, and dentist from the U.S. state of Michigan.
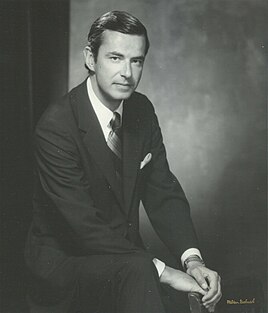
Philip Edward Ruppe is a former politician from the U.S. state of Michigan and a member of the Republican Party. He served in the U.S. House of Representatives from 1967 to 1979 before running, unsuccessfully for the United States Senate in 1982. He is a Korean War veteran, having served as a lieutenant in the U.S. Navy. After leaving the U.S. House, Ruppe became active in business before running for election, without success, to the 103rd Congress.
The 2008 congressional elections in Michigan were held on November 4, 2008 to determine who would represent the state of Michigan in the United States House of Representatives. Michigan had fifteen seats in the House, apportioned according to the 2000 United States Census. Representatives are elected for two-year terms; those elected will serve in the 111th Congress from January 4, 2009 until January 3, 2011. The election coincided with the 2008 U.S. presidential election.
The 1910 South Carolina United States House of Representatives elections were held on November 8, 1910, to select seven Representatives for two-year terms from the state of South Carolina. Six incumbents were re-elected and the open seat in the 2nd congressional district was retained by the Democrats. The composition of the state delegation thus remained solely Democratic.
The 2009 United States elections were held on Tuesday, November 3. During this off-year election, the only seats up for election in the United States Congress were special elections held throughout the year. In total, only the seat representing New York's 23rd congressional district changed party hands, increasing the Democratic Party's majority over the Republicans in the United States House of Representatives, 258–177.
Roy Schmidt is a former politician, having served as a member of the Grand Rapids, Michigan City Commission, and a member of the Michigan House of Representatives representing the 76th district, which includes parts of the Grand Rapids metropolitan area.
Elections were held in Michigan on Tuesday, November 2, 2010. Primary elections were held on August 3, 2010.
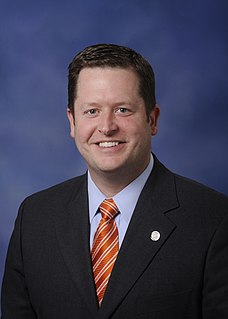
James "Jase" Bolger served as the 71st Speaker of the Michigan House of Representatives from January 12, 2011 to the end of 2014 session. Bolger is a member of the Republican Party, and represented Michigan's 63rd house district from 2009 to 2014. After being term limited out, he founded a consulting firm, Tusker Strategies.
The 2012 United States House of Representatives elections in Louisiana were held on Tuesday, November 6, 2012 and elected the six U.S. Representatives from the state of Louisiana, one from each of the state's six congressional districts, a loss of one seat following reapportionment according to the results of the 2010 Census. The elections coincided with elections for other federal and state offices, including a quadrennial presidential election. A jungle primary took place on November 6, with a runoff, if necessary, scheduled for December 8.
The 2012 United States House of Representatives elections in Michigan was held on Tuesday, November 6, 2012, to elect the 14 U.S. Representatives from the state of Michigan, a decrease of one following the 2010 United States Census. The elections coincided with the elections of other federal and state offices, including a quadrennial presidential election and an election to the U.S. Senate. Primary elections were held on August 7, 2012. The filing deadling for candidates to file to run in the primary was May 15. Except for two seats, all the incumbents sought re-election. The open seats were the 5th and 11th Congressional Districts. Due to the loss of one seat from the 2010 Census, two congressmen ran against each other. Despite Democrats winning more than 240,000 more votes for U.S. House districts statewide, Republicans won nine of 14 seats and Michiganders tied a state record by electing the lowest rate of U.S. Representatives by a major party whilst simultaneously casting its electoral votes for that party's presidential nominee.
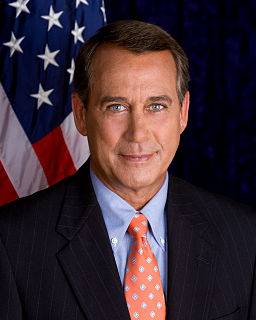
The 2014 United States House of Representatives elections were held on November 4, 2014, in the middle of President Barack Obama's second term in office.
The 2014 Michigan House of Representatives elections were held on November 4, 2014, with partisan primaries to select the parties' nominees in the various districts on August 5, 2014. Members elected at the 2014 election will serve in the 98th Michigan Legislature which convenes on January 7, 2015.
The 2014 U.S. House of Representatives elections in Michigan will be held on Tuesday, November 4, 2014, to elect the 14 members of the U.S. House of Representatives from the state of Michigan, one from each of the state's 18 congressional districts. The elections will coincide with the elections of other federal and state offices, including the election of Michigan's governor, as well as the Class 2 U.S. Senate Seat
The 2016 United States House of Representatives elections in Michigan were held on November 8, 2016, to elect the 14 U.S. Representatives from the state of Michigan, one from each of the state's 14 congressional districts. The elections coincided with the 2016 U.S. presidential election, as well as other elections to the House of Representatives, elections to the United States Senate in 33 other states and various state and local elections. The deadline for candidates to file for the August 2 primary election was April 19.