Panitan

Last updated
Panitan
Ipiong
Municipality of Panitan
Panitan Plaza.jpg
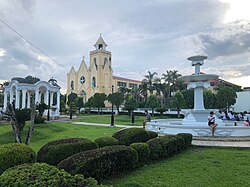
Panitan Plaza and Saint Lawrence the Deacon Parish Church
Flag of Panitan, Capiz.png
Ph locator capiz panitan.png
Map of Capiz with Panitan highlighted
OpenStreetMap
Panitan
Philippines location map (square).svg
Red pog.svg
Panitan
Location within the Philippines
Coordinates: 11°27′50″N122°46′10″E / 11.4639°N 122.7694°E / 11.4639; 122.7694
Country Philippines
Region Western Visayas
Province Capiz
District 1st district
Founded 1621
Barangays 26 (see Barangays)
Government
[1]
  Type Sangguniang Bayan
   Mayor Katherine D. Dequiña-Belo (1Capiz)
   Vice Mayor Audie L. Advincula (1Capiz)
   Representative Ivan Howard A. Guintu (IND)
   Municipal Council
Members
  • Roger C. Delay
  • Ray D. Derramas
  • Agnes D. Buday
  • Carmelo A. Duran
  • Rodriguez T. Dadivas, Jr.
  • Marites B. Versoza
  • Joelito D. Denosta
  • Mark Anthony A. Calinao
   Electorate 28,181 voters (2025)
Area
[2]
  Total
89.88 km2 (34.70 sq mi)
Elevation
34 m (112 ft)
Highest elevation
338 m (1,109 ft)
Lowest elevation
−1 m (−3 ft)
Population
 (2024 census) [3]
  Total
44,246
  Density490/km2 (1,300/sq mi)
   Households
10,868
Economy
   Income class 3rd municipal income class
   Poverty incidence
10.92
% (2021) [4]
   Revenue 198.6 million (2022)
   Assets 243.7 million (2022)
   Expenditure 145.4 million (2022)
   Liabilities 50.02 million (2022)
Service provider
  ElectricityCapiz Electric Cooperative (CAPELCO)
Time zone UTC+8 (PST)
ZIP code
5815
PSGC
IDD : area code +63(0)36
Native languages Capisnon
Hiligaynon
Tagalog

Panitan, officially the Municipality of Panitan (Capiznon/Hiligaynon: Banwa sang Panitan; Tagalog : Bayan ng Panitan), is a municipality in the province of Capiz, Philippines. According to the 2020 census, it has a population of 42,565 people. [5]

Contents

Pronounced as Panit-an, it is 16 kilometres (9.9 mi) from Roxas City.

Geography

Barangays

Panitan is politically subdivided into 26 barangays. [6] Each barangay consists of puroks and some have sitios.

  • Agbabadiang
  • Agkilo
  • Agloway
  • Ambilay
  • Bahit
  • Balatucan
  • Banga-an
  • Cabugao
  • Cabangahan
  • Cadio
  • Cala-an
  • Capagao
  • Cogon
  • Conciencia
  • Enseñagan
  • Intampilan
  • Pasugue
  • Poblacion Ilawod
  • Poblacion Ilaya
  • Quios
  • Salocon
  • Tabuc Norte
  • Tabuc Sur
  • Timpas
  • Tincupon
  • Tinigban

Climate

Climate data for Panitan, Capiz
MonthJanFebMarAprMayJunJulAugSepOctNovDecYear
Mean daily maximum °C (°F)27
(81)
28
(82)
29
(84)
31
(88)
32
(90)
31
(88)
30
(86)
30
(86)
29
(84)
29
(84)
29
(84)
27
(81)
29
(85)
Mean daily minimum °C (°F)23
(73)
23
(73)
23
(73)
24
(75)
25
(77)
25
(77)
24
(75)
24
(75)
24
(75)
24
(75)
24
(75)
23
(73)
24
(75)
Average precipitation mm (inches)61
(2.4)
39
(1.5)
46
(1.8)
48
(1.9)
90
(3.5)
144
(5.7)
152
(6.0)
145
(5.7)
163
(6.4)
160
(6.3)
120
(4.7)
90
(3.5)
1,258
(49.4)
Average rainy days12.39.09.910.018.525.027.426.025.924.917.914.2221
Source: Meteoblue [7]

Demographics

Population census of Panitan
YearPop.±% p.a.
1903 7,578    
1918 10,164+1.98%
1939 14,956+1.86%
1948 15,179+0.16%
1960 19,828+2.25%
1970 23,259+1.61%
1975 26,361+2.54%
1980 27,631+0.95%
YearPop.±% p.a.
1990 32,867+1.75%
1995 33,269+0.23%
2000 37,458+2.57%
2007 38,666+0.44%
2010 37,895−0.73%
2015 40,289+1.17%
2020 42,565+1.16%
2024 44,246+0.93%
Source: Philippine Statistics Authority [8] [9] [10] [11] [12]

In the 2020 census, the population of Panitan was 42,565 people, [13] with a density of 470 inhabitants per square kilometre or 1,200 inhabitants per square mile.

Economy

Poverty incidence of Panitan

10
20
30
40
50
2000
49.62
2003
34.78
2006
28.00
2009
22.05
2012
29.65
2015
17.94
2018
4.80
2021
10.92

Source: Philippine Statistics Authority [14] [15] [16] [17] [18] [19] [20] [21]

Notable people

References

  1. Municipality of Panitan | (DILG)
  2. "2015 Census of Population, Report No. 3 – Population, Land Area, and Population Density" (PDF). Philippine Statistics Authority. Quezon City, Philippines. August 2016. ISSN   0117-1453. Archived (PDF) from the original on May 25, 2021. Retrieved July 16, 2021.
  3. "2024 Census of Population (POPCEN) Population Counts Declared Official by the President". Philippine Statistics Authority. 17 July 2025. Retrieved 18 July 2025.
  4. "PSA Releases the 2021 City and Municipal Level Poverty Estimates". Philippine Statistics Authority. 2 April 2024. Retrieved 28 April 2024.
  5. "2024 Census of Population (POPCEN) Population Counts Declared Official by the President". Philippine Statistics Authority. 17 July 2025. Retrieved 18 July 2025.
  6. "Province: Capiz". PSGC Interactive. Quezon City, Philippines: Philippine Statistics Authority . Retrieved 25 August 2025.
  7. "Panitan: Average Temperatures and Rainfall". Meteoblue. Retrieved 2 May 2020.
  8. "2024 Census of Population (POPCEN) Population Counts Declared Official by the President". Philippine Statistics Authority. 17 July 2025. Retrieved 18 July 2025.
  9. Census of Population (2015). "Region VI (Western Visayas)". Total Population by Province, City, Municipality and Barangay. Philippine Statistics Authority . Retrieved 20 June 2016.
  10. Census of Population and Housing (2010). "Region VI (Western Visayas)" (PDF). Total Population by Province, City, Municipality and Barangay. National Statistics Office . Retrieved 29 June 2016.
  11. Censuses of Population (1903–2007). "Region VI (Western Visayas)". Table 1. Population Enumerated in Various Censuses by Province/Highly Urbanized City: 1903 to 2007. National Statistics Office.
  12. "Province of Capiz". Municipality Population Data. Local Water Utilities Administration Research Division. Retrieved 17 December 2016.
  13. "2024 Census of Population (POPCEN) Population Counts Declared Official by the President". Philippine Statistics Authority. 17 July 2025. Retrieved 18 July 2025.
  14. "Poverty incidence (PI):". Philippine Statistics Authority. Retrieved December 28, 2020.
  15. "Estimation of Local Poverty in the Philippines" (PDF). Philippine Statistics Authority. 29 November 2005.
  16. "2003 City and Municipal Level Poverty Estimates" (PDF). Philippine Statistics Authority. 23 March 2009.
  17. "City and Municipal Level Poverty Estimates; 2006 and 2009" (PDF). Philippine Statistics Authority. 3 August 2012.
  18. "2012 Municipal and City Level Poverty Estimates" (PDF). Philippine Statistics Authority. 31 May 2016.
  19. "Municipal and City Level Small Area Poverty Estimates; 2009, 2012 and 2015". Philippine Statistics Authority. 10 July 2019.
  20. "PSA Releases the 2018 Municipal and City Level Poverty Estimates". Philippine Statistics Authority. 15 December 2021. Retrieved 22 January 2022.
  21. "PSA Releases the 2021 City and Municipal Level Poverty Estimates". Philippine Statistics Authority. 2 April 2024. Retrieved 28 April 2024.