Pontevedra, Capiz Last updated December 27, 2025 Municipality in Capiz, Philippines
Municipality in Western Visayas, Philippines
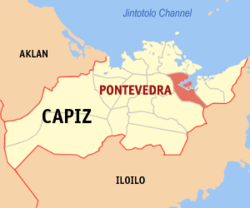
Pontevedra , officially the Municipality of Pontevedra (Capiznon /Hiligaynon : Banwa sang Pontevedra ; Tagalog : Bayan ng Pontevedra municipality in the province of Capiz , Philippines . According to the 2024 census , it has a population of 51,956 people. [ 5]
Geography Pontevedra is 19 kilometres (12 mi) from Roxas City .
Barangays Pontevedra is politically subdivided into 26 barangays . [ 6] Each barangay consists of puroks and some have sitios .
Agbanog Agdalipe Ameligan Bailan Banate Bantigue Binuntucan Cabugao Gabuc (Caugiat) Guba Hipona Intungcan Jolongajog Lantangan Linampongan Malag-it Manapao Ilawod (Poblacion ) Ilaya (Poblacion ) Rizal San Pedro Solo Sublangon Tabuc Tacas Yatingan Climate Climate data for Pontevedra, Capiz Month Jan Feb Mar Apr May Jun Jul Aug Sep Oct Nov Dec Year Mean daily maximum °C (°F) 27 28 29 31 32 31 30 30 29 29 29 27 29 Mean daily minimum °C (°F) 23 23 23 24 25 25 24 24 24 24 24 23 24 Average precipitation mm (inches) 61 39 46 48 90 144 152 145 163 160 120 90 1,258 Average rainy days 12.3 9.0 9.9 10.0 18.5 25.0 27.4 26.0 25.9 24.9 17.9 14.2 221 Source: Meteoblue [ 7]
Demographics Population census of Pontevedra Year ±% p.a. 1903 9,937 — 1918 14,932 +2.75% 1939 23,241 +2.13% 1948 26,329 +1.40% 1960 20,965 −1.88% 1970 25,314 +1.90% 1975 27,266 +1.50% 1980 30,489 +2.26% 1990 36,748 +1.89% 1995 38,223 +0.74% 2000 40,103 +1.03% 2007 42,003 +0.64% 2010 43,525 +1.30% 2015 46,428 +1.24% 2020 49,725 +1.45% 2024 51,956 +1.06% Source: Philippine Statistics Authority [ 8] [ 9] [ 10] [ 11] [ 12]
In the 2024 census, the population of Pontevedra, Capiz, was 51,956 people, [ 13] with a density of 400 inhabitants per square kilometre or 1,000 inhabitants per square mile .
Education The Pontevedra Schools District Office governs all educational institutions within the municipality. It oversees the management and operations of all private and public, from primary to secondary schools. [ 22]
Primary and elementary schools Advance Learning Academy and Tutorial Center Agbanog Elementary School Ameligan Elementary School Banate Elementary School Bible Baptist Pontevedra Pre-School Cabugao Primary School Concepcion Catalan Bisnar Elementary School Congressman Dinggoy Araneta Roxas Elementary School Councilor Nicolas Dais Elementary School Feliciano Consing Elementary School Gabuc Elementary School Hipona Christian School Hipona Elementary School Intongcan Elementary School Manapao Elementary School Maximo Dais Elementary School Pontevedra Elementary School Pontevedra Fundamental Baptist Academy Prof. Antonio Viterbo Elementary School Renato P. Hontiveros Elementary School Rizal Elementary School San Pedro Elementary School Sublangon Christian Faith Development Center Victoria C. Dais Elementary School Secondary schools Bailan Integrated School Jose Diva Avelino Jr. National High School Pontevedra National High School Higher educational institution References ↑ Municipality of Pontevedra | (DILG) ↑ "2015 Census of Population, Report No. 3 – Population, Land Area, and Population Density" (PDF) . Philippine Statistics Authority . Quezon City, Philippines. August 2016. ISSN 0117-1453 . Archived (PDF) from the original on May 25, 2021. Retrieved July 16, 2021 . ↑ "2024 Census of Population (POPCEN) Population Counts Declared Official by the President" . Philippine Statistics Authority. 17 July 2025. Retrieved 18 July 2025 . ↑ "PSA Releases the 2021 City and Municipal Level Poverty Estimates" . Philippine Statistics Authority. 2 April 2024. Retrieved 28 April 2024 . ↑ "2024 Census of Population (POPCEN) Population Counts Declared Official by the President" . Philippine Statistics Authority. 17 July 2025. Retrieved 18 July 2025 . ↑ "Province: Capiz" . PSGC Interactive . Quezon City, Philippines: Philippine Statistics Authority . Retrieved 25 August 2025 . ↑ "Pontevedra: Average Temperatures and Rainfall" . Meteoblue. Retrieved 2 May 2020 . ↑ "2024 Census of Population (POPCEN) Population Counts Declared Official by the President" . Philippine Statistics Authority. 17 July 2025. Retrieved 18 July 2025 . ↑ Census of Population (2015). "Region VI (Western Visayas)" . Total Population by Province, City, Municipality and Barangay . Philippine Statistics Authority . Retrieved 20 June 2016 . ↑ Census of Population and Housing (2010). "Region VI (Western Visayas)" (PDF) . Total Population by Province, City, Municipality and Barangay . National Statistics Office . Retrieved 29 June 2016 . ↑ Censuses of Population (1903–2007). "Region VI (Western Visayas)" . Table 1. Population Enumerated in Various Censuses by Province/Highly Urbanized City: 1903 to 2007 National Statistics Office . ↑ "Province of Capiz" . Municipality Population Data . Local Water Utilities Administration Research Division. Retrieved 17 December 2016 . ↑ "2024 Census of Population (POPCEN) Population Counts Declared Official by the President" . Philippine Statistics Authority. 17 July 2025. Retrieved 18 July 2025 . ↑ "Poverty incidence (PI):" . Philippine Statistics Authority. Retrieved December 28, 2020 . ↑ "Estimation of Local Poverty in the Philippines" (PDF) . Philippine Statistics Authority. 29 November 2005. ↑ "2003 City and Municipal Level Poverty Estimates" (PDF) . Philippine Statistics Authority. 23 March 2009. ↑ "City and Municipal Level Poverty Estimates; 2006 and 2009" (PDF) . Philippine Statistics Authority. 3 August 2012. ↑ "2012 Municipal and City Level Poverty Estimates" (PDF) . Philippine Statistics Authority. 31 May 2016. ↑ "Municipal and City Level Small Area Poverty Estimates; 2009, 2012 and 2015" . Philippine Statistics Authority. 10 July 2019. ↑ "PSA Releases the 2018 Municipal and City Level Poverty Estimates" . Philippine Statistics Authority. 15 December 2021. Retrieved 22 January 2022 . ↑ "PSA Releases the 2021 City and Municipal Level Poverty Estimates" . Philippine Statistics Authority. 2 April 2024. Retrieved 28 April 2024 . ↑ "Masterlist of Schools" (PDF) . Department of Education . January 15, 2021. Retrieved December 24, 2025 . External links
Places adjacent to Pontevedra, Capiz
This page is based on this
Wikipedia article Text is available under the
CC BY-SA 4.0 license; additional terms may apply.
Images, videos and audio are available under their respective licenses.