This is a list of electoral district results for the Victorian 1985 election for the Legislative Assembly.
Party | Candidate | Votes | % | ±% | |
---|---|---|---|---|---|
Labor | Bunna Walsh | 15,186 | 62.2 | +0.6 | |
Liberal | Barry Semmens | 9,616 | 37.8 | +5.8 | |
Total formal votes | 25,432 | 96.7 | |||
Informal votes | 860 | 3.3 | |||
Turnout | 26,292 | 88.2 | |||
Labor hold | Swing | -3.5 | |||
Party | Candidate | Votes | % | ±% | |
---|---|---|---|---|---|
Liberal | Tom Evans | 16,497 | 57.1 | +5.0 | |
Labor | Steve Bracks | 12,377 | 42.9 | −0.5 | |
Total formal votes | 28,874 | 98.2 | |||
Informal votes | 518 | 1.8 | |||
Turnout | 29,392 | 94.5 | |||
Liberal hold | Swing | +3.2 | |||
Party | Candidate | Votes | % | ±% | |
---|---|---|---|---|---|
Labor | Frank Sheehan | 14,780 | 51.8 | +2.6 | |
Liberal | Clive Bubb | 13,764 | 48.2 | +2.7 | |
Total formal votes | 28,544 | 98.2 | |||
Informal votes | 518 | 1.8 | |||
Turnout | 29,062 | 94.7 | |||
Labor hold | Swing | -0.4 | |||
Party | Candidate | Votes | % | ±% | |
---|---|---|---|---|---|
Liberal | Jim Ramsay | 17,994 | 65.4 | +8.2 | |
Labor | Frank Pederick | 9,509 | 34.6 | −0.2 | |
Total formal votes | 27,503 | 98.1 | |||
Informal votes | 543 | 1.9 | |||
Turnout | 28,046 | 92.5 | |||
Liberal hold | Swing | +4.9 | |||
Party | Candidate | Votes | % | ±% | |
---|---|---|---|---|---|
Labor | Graham Ernst | 14,738 | 53.0 | +1.4 | |
Liberal | Hugh McKenzie | 13,098 | 47.0 | +6.0 | |
Total formal votes | 27,836 | 98.1 | |||
Informal votes | 526 | 1.9 | |||
Turnout | 28,362 | 94.7 | |||
Labor hold | Swing | -2.2 | |||
Party | Candidate | Votes | % | ±% | |
---|---|---|---|---|---|
National | Pat McNamara | 13,031 | 47.4 | +13.4 | |
Labor | Grant Triffett | 8,922 | 32.5 | −1.7 | |
Liberal | Leonard Crocombe | 5,529 | 20.1 | −7.7 | |
Total formal votes | 27,482 | 98.3 | |||
Informal votes | 460 | 1.7 | |||
Turnout | 27,942 | 92.6 | |||
Two-party-preferred result | |||||
National | Pat McNamara | 18,163 | 66.1 | +3.2 | |
Labor | Grant Triffett | 9,319 | 33.9 | −3.2 | |
National hold | Swing | +3.2 | |||
Party | Candidate | Votes | % | ±% | |
---|---|---|---|---|---|
Liberal | Lou Lieberman | 18,525 | 69.6 | +11.3 | |
Labor | Virginia Coghill | 8,105 | 30.4 | −2.0 | |
Total formal votes | 26,630 | 98.0 | |||
Informal votes | 533 | 2.0 | |||
Turnout | 27,163 | 91.3 | |||
Liberal hold | Swing | +3.1 | |||
Party | Candidate | Votes | % | ±% | |
---|---|---|---|---|---|
Labor | John Reid | 12,493 | 44.2 | +1.9 | |
Liberal | Michael John | 10,929 | 38.7 | −2.8 | |
National | Barry McNaught | 4,819 | 17.1 | +13.2 | |
Total formal votes | 28,241 | 98.4 | |||
Informal votes | 452 | 1.6 | |||
Turnout | 28,693 | 95.2 | |||
Two-party-preferred result | |||||
Liberal | Michael John | 15,218 | 53.9 | +2.6 | |
Labor | John Reid | 13,023 | 46.1 | −2.6 | |
Liberal hold | Swing | +2.6 | |||
Party | Candidate | Votes | % | ±% | |
---|---|---|---|---|---|
Labor | David Kennedy | 15,687 | 53.7 | +4.0 | |
Liberal | Alexander Sandner | 9,371 | 32.1 | −6.0 | |
National | Reginald Holt | 4,142 | 14.2 | +9.2 | |
Total formal votes | 29,200 | 98.2 | |||
Informal votes | 520 | 1.8 | |||
Turnout | 29,720 | 95.0 | |||
Two-party-preferred result | |||||
Labor | David Kennedy | 16,264 | 55.7 | +1.0 | |
Liberal | Alexander Sandner | 12,936 | 44.3 | −1.0 | |
Labor hold | Swing | +1.0 | |||
Party | Candidate | Votes | % | ±% | |
---|---|---|---|---|---|
Liberal | Roger Pescott | 14,266 | 49.2 | +4.2 | |
Labor | Doug Newton | 13,993 | 48.3 | +1.6 | |
Independent | Ray Nilsen | 716 | 2.5 | +2.5 | |
Total formal votes | 28,975 | 97.7 | |||
Informal votes | 689 | 2.3 | |||
Turnout | 29,664 | 94.4 | |||
Two-party-preferred result | |||||
Liberal | Roger Pescott | 14,717 | 50.8 | +2.0 | |
Labor | Doug Newton | 14,254 | 49.2 | −2.0 | |
Liberal gain from Labor | Swing | +2.0 | |||
Party | Candidate | Votes | % | ±% | |
---|---|---|---|---|---|
Labor | Gordon Hockley | 13,758 | 50.1 | +0.2 | |
Liberal | Peter Norman | 13,696 | 49.9 | +8.0 | |
Total formal votes | 27,454 | 97.5 | |||
Informal votes | 713 | 2.5 | |||
Turnout | 28,167 | 94.3 | |||
Labor hold | Swing | -4.4 | |||
Party | Candidate | Votes | % | ±% | |
---|---|---|---|---|---|
Liberal | Rob Maclellan | 15,144 | 53.1 | +0.8 | |
Labor | Philip Staindl | 13,378 | 46.9 | −0.8 | |
Total formal votes | 28,522 | 97.7 | |||
Informal votes | 684 | 2.3 | |||
Turnout | 29,206 | 94.0 | |||
Liberal hold | Swing | +0.8 | |||
Party | Candidate | Votes | % | ±% | |
---|---|---|---|---|---|
Labor | Margaret Ray | 14,336 | 50.8 | +2.3 | |
Liberal | George Cox | 12,621 | 44.7 | +4.5 | |
Independent | Peter Allan | 1,277 | 4.5 | +0.8 | |
Total formal votes | 28,234 | 98.1 | |||
Informal votes | 553 | 1.9 | |||
Turnout | 28,787 | 93.3 | |||
Two-party-preferred result | |||||
Labor | Margaret Ray | 14,710 | 52.1 | −3.4 | |
Liberal | George Cox | 13,524 | 47.9 | +3.4 | |
Labor hold | Swing | -3.4 | |||
Party | Candidate | Votes | % | ±% | |
---|---|---|---|---|---|
Liberal | Alan Stockdale | 17,301 | 62.1 | +4.0 | |
Labor | Leslie Heimann | 10,560 | 37.9 | +6.0 | |
Total formal votes | 27,861 | 97.4 | |||
Informal votes | 737 | 2.6 | |||
Turnout | 28,598 | 91.9 | |||
Liberal hold | Swing | +3.8 | |||
Party | Candidate | Votes | % | ±% | |
---|---|---|---|---|---|
Labor | Jack Culpin | 17,301 | 70.0 | −3.8 | |
Liberal | Mark Sinclair | 7,405 | 30.0 | +11.1 | |
Total formal votes | 24,706 | 95.1 | |||
Informal votes | 1,268 | 4.9 | |||
Turnout | 25,974 | 93.2 | |||
Labor hold | Swing | -6.8 | |||
Party | Candidate | Votes | % | ±% | |
---|---|---|---|---|---|
Labor | Tom Roper | 18,371 | 70.6 | −1.1 | |
Liberal | Gregory Dinncen | 7,657 | 29.4 | +8.9 | |
Total formal votes | 26,028 | 94.9 | |||
Informal votes | 1,389 | 5.1 | |||
Turnout | 27,417 | 89.8 | |||
Labor hold | Swing | -6.7 | |||
Party | Candidate | Votes | % | ±% | |
---|---|---|---|---|---|
Liberal | David Perrin | 15,645 | 57.8 | +7.9 | |
Labor | John Scomparin | 11,429 | 42.2 | +0.4 | |
Total formal votes | 27,074 | 97.3 | |||
Informal votes | 749 | 2.7 | |||
Turnout | 27,823 | 94.1 | |||
Liberal hold | Swing | +3.4 | |||
Party | Candidate | Votes | % | ±% | |
---|---|---|---|---|---|
Labor | John Cain | 16,184 | 60.6 | −0.2 | |
Liberal | Alistair Urquhart | 8,713 | 32.6 | −0.9 | |
Weekend Trading | Frank Penhalluriack | 1,826 | 6.8 | +6.8 | |
Total formal votes | 26,723 | 98.0 | |||
Informal votes | 545 | 2.0 | |||
Turnout | 27,268 | 94.5 | |||
Two-party-preferred result | |||||
Labor | John Cain | 16,648 | 62.3 | −2.0 | |
Liberal | Alistair Urquhart | 10,075 | 37.7 | +2.0 | |
Labor hold | Swing | -2.0 | |||
Party | Candidate | Votes | % | ±% | |
---|---|---|---|---|---|
Liberal | Jeff Kennett | 15,117 | 55.6 | +6.2 | |
Labor | Eric Hobsbawn | 12,083 | 44.4 | +3.0 | |
Total formal votes | 27,200 | 97.8 | |||
Informal votes | 622 | 2.2 | |||
Turnout | 27,822 | 93.1 | |||
Liberal hold | Swing | +2.5 | |||
Party | Candidate | Votes | % | ±% | |
---|---|---|---|---|---|
Labor | Ian Cathie | 15,440 | 59.4 | +0.5 | |
Liberal | Bruce Bowie | 10,540 | 40.6 | +2.3 | |
Total formal votes | 25,980 | 97.2 | |||
Informal votes | 740 | 2.8 | |||
Turnout | 26,720 | 93.1 | |||
Labor hold | Swing | -1.5 | |||
Party | Candidate | Votes | % | ±% | |
---|---|---|---|---|---|
Liberal | Ted Tanner | 15,460 | 57.3 | +8.6 | |
Labor | Jack Diamond | 11,527 | 42.7 | −0.5 | |
Total formal votes | 26,987 | 96.8 | |||
Informal votes | 877 | 3.2 | |||
Turnout | 27,864 | 90.6 | |||
Liberal hold | Swing | +4.1 | |||
Party | Candidate | Votes | % | ±% | |
---|---|---|---|---|---|
Labor | Gerard Vaughan | 16,303 | 59.8 | +1.2 | |
Liberal | Alan Sandbach | 10,945 | 40.2 | +7.2 | |
Total formal votes | 27,248 | 96.2 | |||
Informal votes | 1,083 | 3.8 | |||
Turnout | 28,331 | 94.0 | |||
Labor hold | Swing | -2.7 | |||
Party | Candidate | Votes | % | ±% | |
---|---|---|---|---|---|
Labor | Peter Gavin | 19,235 | 70.4 | −2.4 | |
Liberal | Antonino Boeti | 8,070 | 29.6 | +11.7 | |
Total formal votes | 27,305 | 96.0 | |||
Informal votes | 1,124 | 4.0 | |||
Turnout | 28,429 | 92.6 | |||
Labor hold | Swing | -5.3 | |||
Party | Candidate | Votes | % | ±% | |
---|---|---|---|---|---|
Labor | Terry Norris | 15,970 | 61.1 | +3.9 | |
Liberal | Ian Fotheringham | 10,182 | 38.9 | −0.7 | |
Total formal votes | 26,152 | 96.1 | |||
Informal votes | 1,046 | 3.9 | |||
Turnout | 27,198 | 92.0 | |||
Labor hold | Swing | +2.2 | |||
Party | Candidate | Votes | % | ±% | |
---|---|---|---|---|---|
Labor | Jan Wilson | 15,436 | 59.1 | +0.6 | |
Liberal | George Grech | 10,679 | 40.9 | +3.3 | |
Total formal votes | 26,115 | 96.5 | |||
Informal votes | 942 | 3.5 | |||
Turnout | 27,057 | 94.4 | |||
Labor hold | Swing | -2.6 | |||
Party | Candidate | Votes | % | ±% | |
---|---|---|---|---|---|
Labor | David Cunningham | 17,326 | 65.6 | −3.3 | |
Liberal | Helen Hurley | 9,078 | 34.4 | +9.2 | |
Total formal votes | 26,404 | 96.4 | |||
Informal votes | 989 | 3.6 | |||
Turnout | 27,393 | 93.9 | |||
Labor hold | Swing | -8.1 | |||
Party | Candidate | Votes | % | ±% | |
---|---|---|---|---|---|
Liberal | Morris Williams | 14,635 | 55.6 | +5.5 | |
Labor | William Poppins | 11,666 | 44.4 | +3.8 | |
Total formal votes | 26,301 | 97.8 | |||
Informal votes | 600 | 2.2 | |||
Turnout | 26,901 | 94.5 | |||
Liberal hold | Swing | +1.4 | |||
Party | Candidate | Votes | % | ±% | |
---|---|---|---|---|---|
Labor | Rob Jolly | 17,116 | 64.9 | +1.6 | |
Liberal | Matthew Starr | 9,264 | 35.1 | −0.7 | |
Total formal votes | 26,380 | 96.8 | |||
Informal votes | 870 | 3.2 | +0.4 | ||
Turnout | 27,250 | 94.0 | |||
Labor hold | Swing | +0.4 | |||
Party | Candidate | Votes | % | ±% | |
---|---|---|---|---|---|
Liberal | Ron Wells | 14,523 | 52.4 | +9.7 | |
Labor | Allison Ogden | 13,179 | 47.6 | +3.0 | |
Total formal votes | 27,702 | 98.3 | |||
Informal votes | 487 | 1.7 | |||
Turnout | 28,189 | 93.6 | |||
Liberal gain from Labor | Swing | +3.8 | |||
Party | Candidate | Votes | % | ±% | |
---|---|---|---|---|---|
Labor | Barry Rowe | 16,964 | 62.1 | −1.8 | |
Liberal | Brian Dodgson | 10,360 | 37.9 | +3.7 | |
Total formal votes | 27,324 | 96.7 | |||
Informal votes | 935 | 3.3 | |||
Turnout | 28,259 | 91.8 | |||
Labor hold | Swing | -2.9 | |||
Party | Candidate | Votes | % | ±% | |
---|---|---|---|---|---|
Liberal | Jim Plowman | 13,899 | 49.9 | +6.6 | |
Labor | Graham Ihlein | 12,594 | 45.2 | +0.3 | |
Independent | Gaye Gelly | 1,360 | 4.9 | +4.9 | |
Total formal votes | 27,853 | 97.9 | |||
Informal votes | 601 | 2.1 | |||
Turnout | 28,454 | 93.8 | |||
Two-party-preferred result | |||||
Liberal | Jim Plowman | 13,899 | 52.8 | +4.1 | |
Labor | Graham Ihlein | 13,137 | 47.2 | −4.1 | |
Liberal gain from Labor | Swing | +4.1 | |||
Party | Candidate | Votes | % | ±% | |
---|---|---|---|---|---|
Labor | Robert Fordham | 20,516 | 73.4 | −2.7 | |
Liberal | Hugh Cameron | 7,455 | 26.6 | +3.0 | |
Total formal votes | 27,971 | 95.2 | |||
Informal votes | 1,401 | 4.8 | |||
Turnout | 29,372 | 91.4 | |||
Labor hold | Swing | -3.0 | |||
Party | Candidate | Votes | % | ±% | |
---|---|---|---|---|---|
Liberal | John Richardson | 14,543 | 53.9 | +7.2 | |
Labor | John Madden | 12,452 | 46.1 | +1.4 | |
Total formal votes | 26,995 | 97.5 | |||
Informal votes | 679 | 2.5 | |||
Turnout | 27,674 | 94.7 | |||
Liberal hold | Swing | +3.3 | |||
Party | Candidate | Votes | % | ±% | |
---|---|---|---|---|---|
Labor | Jane Hill | 15,712 | 57.9 | +0.7 | |
Liberal | Robert Garnett | 10,139 | 37.3 | +0.8 | |
Independent | Judy Hale | 1,292 | 4.8 | +4.8 | |
Total formal votes | 27,143 | 97.5 | |||
Informal votes | 690 | 2.5 | |||
Turnout | 27,833 | 93.2 | |||
Two-party-preferred result | |||||
Labor | Jane Hill | 16,014 | 59.0 | −2.9 | |
Liberal | Robert Garnett | 11,129 | 41.0 | +2.9 | |
Labor hold | Swing | -2.9 | |||
Party | Candidate | Votes | % | ±% | |
---|---|---|---|---|---|
Liberal | Graeme Weideman | 14,384 | 53.6 | +4.1 | |
Labor | Geoffrey Holland | 12,441 | 46.4 | +5.2 | |
Total formal votes | 26,825 | 97.7 | |||
Informal votes | 635 | 2.3 | |||
Turnout | 27,460 | 93.1 | |||
Liberal hold | Swing | +1.4 | |||
Party | Candidate | Votes | % | ±% | |
---|---|---|---|---|---|
Labor | Hayden Shell | 15,946 | 56.1 | +4.6 | |
Liberal | Clive Pugh | 12,501 | 43.9 | +2.7 | |
Total formal votes | 28,447 | 97.7 | |||
Informal votes | 672 | 2.3 | |||
Turnout | 29,119 | 92.8 | |||
Labor hold | Swing | +1.2 | |||
Party | Candidate | Votes | % | ±% | |
---|---|---|---|---|---|
Labor | Neil Trezise | 17,408 | 65.8 | −3.3 | |
Liberal | John Lucas | 9,068 | 34.2 | +3.3 | |
Total formal votes | 26,476 | 96.6 | |||
Informal votes | 929 | 3.4 | |||
Turnout | 27,405 | 93.7 | |||
Labor hold | Swing | -3.3 | |||
Party | Candidate | Votes | % | ±% | |
---|---|---|---|---|---|
National | Bruce Evans | 13,078 | 49.6 | +5.5 | |
Labor | Clifford Harding | 8,081 | 30.7 | −1.7 | |
Liberal | David McInnes | 5,196 | 19.7 | +0.4 | |
Total formal votes | 26,355 | 98.5 | |||
Informal votes | 406 | 1.5 | |||
Turnout | 26,761 | 92.7 | |||
Two-party-preferred result | |||||
National | Bruce Evans | 17,794 | 67.5 | +3.3 | |
Labor | Clifford Harding | 8,561 | 32.5 | −3.3 | |
National hold | Swing | +3.3 | |||
Party | Candidate | Votes | % | ±% | |
---|---|---|---|---|---|
National | Tom Wallace | 13,592 | 48.9 | +16.4 | |
Liberal | Neil McInnes | 7,125 | 25.6 | −10.3 | |
Labor | Max Semken | 7,061 | 25.4 | −0.6 | |
Total formal votes | 27,778 | 98.5 | |||
Informal votes | 435 | 1.5 | |||
Turnout | 28,213 | 93.1 | |||
Two-party-preferred result | |||||
National | Tom Wallace | 19,945 | 71.8 | +3.5 | |
Labor | Max Semken | 7,833 | 28.2 | −3.5 | |
Two-candidate-preferred result | |||||
National | Tom Wallace | 18,960 | 68.3 | ||
Liberal | Neil McInnes | 8,812 | 31.7 | ||
National hold | Swing | ||||
Party | Candidate | Votes | % | ±% | |
---|---|---|---|---|---|
Liberal | Alan Brown | 14,561 | 49.3 | −0.8 | |
Labor | Geoffrey Bull | 10,611 | 35.9 | −0.5 | |
National | William Ronald | 4,368 | 14.8 | +11.2 | |
Total formal votes | 29,540 | 98.2 | |||
Informal votes | 529 | 1.8 | |||
Turnout | 30,069 | 94.8 | |||
Two-party-preferred result | |||||
Liberal | Alan Brown | 18,343 | 62.1 | +2.0 | |
Labor | Geoffrey Bull | 11,196 | 37.9 | −2.0 | |
Liberal hold | Swing | +2.0 | |||
Party | Candidate | Votes | % | ±% | |
---|---|---|---|---|---|
Liberal | Tom Reynolds | 16,400 | 57.5 | +10.5 | |
Labor | Douglas Bishop | 12,114 | 42.5 | −2.8 | |
Total formal votes | 28,514 | 98.3 | |||
Informal votes | 495 | 1.7 | |||
Turnout | 29,009 | 94.7 | |||
Liberal hold | Swing | +6.5 | |||
Party | Candidate | Votes | % | ±% | |
---|---|---|---|---|---|
Liberal | Ross Smith | 16,502 | 60.1 | +8.2 | |
Labor | John Candappa | 10,963 | 39.9 | +1.0 | |
Total formal votes | 27,465 | 97.5 | |||
Informal votes | 694 | 2.5 | |||
Turnout | 28,159 | 95.5 | |||
Liberal hold | Swing | +4.3 | |||
Party | Candidate | Votes | % | ±% | |
---|---|---|---|---|---|
Labor | Pauline Toner | 14,632 | 55.1 | +1.2 | |
Liberal | Andrew Cove | 11,930 | 44.9 | +8.3 | |
Total formal votes | 26,562 | 97.8 | |||
Informal votes | 595 | 2.2 | |||
Turnout | 27,157 | 93.8 | |||
Labor hold | Swing | -3.7 | |||
Party | Candidate | Votes | % | ±% | |
---|---|---|---|---|---|
Liberal | Phil Gude | 15,605 | 55.7 | +4.3 | |
Labor | Jill Eastwood | 12,387 | 44.3 | +3.2 | |
Total formal votes | 27,992 | 97.4 | |||
Informal votes | 738 | 2.6 | |||
Turnout | 28,730 | 90.5 | |||
Liberal hold | Swing | +1.5 | |||
Party | Candidate | Votes | % | ±% | |
---|---|---|---|---|---|
Liberal | Vin Heffernan | 14,665 | 51.6 | +6.4 | |
Labor | Tony Sheehan | 13,740 | 48.4 | +0.1 | |
Total formal votes | 28,405 | 97.7 | |||
Informal votes | 657 | 2.3 | |||
Turnout | 29,062 | 93.6 | |||
Liberal gain from Labor | Swing | +2.7 | |||
Party | Candidate | Votes | % | ±% | |
---|---|---|---|---|---|
Labor | George Seitz | 16,636 | 61.5 | −5.4 | |
Liberal | Graham Andersen | 10,432 | 38.5 | +8.2 | |
Total formal votes | 27,068 | 96.6 | |||
Informal votes | 962 | 3.4 | |||
Turnout | 28,030 | 94.5 | |||
Labor hold | Swing | -7.5 | |||
Party | Candidate | Votes | % | ±% | |
---|---|---|---|---|---|
Liberal | Prue Sibree | 16,403 | 60.2 | +4.4 | |
Labor | Annamaria Dierer | 10,843 | 39.8 | +5.8 | |
Total formal votes | 27,246 | 97.1 | |||
Informal votes | 818 | 2.9 | |||
Turnout | 28,064 | 91.9 | |||
Liberal hold | Swing | -0.3 | |||
Party | Candidate | Votes | % | ±% | |
---|---|---|---|---|---|
Labor | Steve Crabb | 15,236 | 59.3 | +1.2 | |
Liberal | Jill Hall | 9,480 | 36.9 | +1.9 | |
Public Transport | Thomas Tyrer | 967 | 3.8 | +3.8 | |
Total formal votes | 25,683 | 97.9 | |||
Informal votes | 559 | 2.1 | |||
Turnout | 26,242 | 94.2 | |||
Two-party-preferred result | |||||
Labor | Steve Crabb | 15,769 | 61.4 | −0.7 | |
Liberal | Jill Hall | 9,914 | 38.6 | +0.7 | |
Labor hold | Swing | -0.7 | |||
Party | Candidate | Votes | % | ±% | |
---|---|---|---|---|---|
National | Bill McGrath | 17,138 | 63.2 | +14.8 | |
Labor | William Albon | 5,052 | 18.6 | −3.7 | |
Liberal | John Mann | 4,944 | 18.2 | −9.0 | |
Total formal votes | 27,134 | 98.9 | |||
Informal votes | 300 | 1.1 | |||
Turnout | 27,434 | 95.8 | |||
Two-party-preferred result | |||||
National | Bill McGrath | 21,761 | 80.2 | +4.5 | |
Labor | William Albon | 5,373 | 19.8 | −4.5 | |
National hold | Swing | +4.5 | |||
Party | Candidate | Votes | % | ±% | |
---|---|---|---|---|---|
Liberal | Geoff Leigh | 15,920 | 59.8 | +4.3 | |
Labor | Max Dumais | 10,697 | 40.2 | +2.8 | |
Total formal votes | 26,617 | 97.7 | |||
Informal votes | 624 | 2.3 | |||
Turnout | 27,241 | 2.3 | |||
Liberal hold | Swing | +0.5 | |||
Party | Candidate | Votes | % | ±% | |
---|---|---|---|---|---|
Labor | Keith Remington | 15,155 | 61.0 | −3.4 | |
Liberal | Peter Jones | 7,996 | 32.2 | +7.9 | |
Public Transport | Janet Walk | 1,709 | 6.9 | +6.9 | |
Total formal votes | 24,860 | 95.7 | |||
Informal votes | 1,121 | 4.3 | |||
Turnout | 25,981 | 85.5 | |||
Two-party-preferred result | |||||
Labor | Keith Remington | 16,209 | 65.2 | −6.1 | |
Liberal | Peter Jones | 8,651 | 34.8 | +6.1 | |
Labor hold | Swing | -6.1 | |||
Party | Candidate | Votes | % | ±% | |
---|---|---|---|---|---|
Labor | Peter Spyker | 14,406 | 52.0 | +0.1 | |
Liberal | Bill Templeton | 13,315 | 48.0 | −4.9 | |
Total formal votes | 27,721 | 97.4 | |||
Informal votes | 731 | 2.6 | |||
Turnout | 28,452 | 93.7 | |||
Labor notional hold | Swing | -1.7 | |||
Party | Candidate | Votes | % | ±% | |
---|---|---|---|---|---|
National | Milton Whiting | 15,283 | 58.7 | +4.7 | |
Labor | Lindsay Leake | 5,959 | 22.9 | −6.9 | |
Liberal | Diana Duck | 4,796 | 18.4 | +7.2 | |
Total formal votes | 26,038 | 97.9 | |||
Informal votes | 560 | 2.1 | |||
Turnout | 26,598 | 92.3 | |||
Two-party-preferred result | |||||
National | Milton Whiting | 19,008 | 73.0 | +5.7 | |
Labor | Lindsay Leake | 7,050 | 27.0 | −5.7 | |
National hold | Swing | +5.7 | |||
Party | Candidate | Votes | % | ±% | |
---|---|---|---|---|---|
Labor | John Harrowfield | 14,928 | 53.7 | +4.9 | |
Liberal | Bruce Camfield | 12,868 | 46.3 | +5.6 | |
Total formal votes | 27,796 | 97.5 | |||
Informal votes | 708 | 2.5 | |||
Turnout | 28,504 | 94.4 | |||
Labor hold | Swing | +0.1 | |||
Party | Candidate | Votes | % | ±% | |
---|---|---|---|---|---|
Labor | Neil Pope | 14,239 | 53.7 | +12.3 | |
Liberal | Raymond Yates | 12,270 | 46.3 | +7.1 | |
Total formal votes | 26,509 | 97.8 | |||
Informal votes | 608 | 2.2 | |||
Turnout | 27,117 | 92.6 | |||
Labor hold | Swing | +0.9 | |||
Party | Candidate | Votes | % | ±% | |
---|---|---|---|---|---|
Liberal | Robin Cooper | 14,376 | 52.0 | +7.6 | |
Labor | David Hassett | 13,275 | 48.0 | +3.8 | |
Total formal votes | 27,651 | 97.7 | |||
Informal votes | 644 | 2.3 | |||
Turnout | 28,295 | 92.4 | |||
Liberal gain from Labor | Swing | +3.4 | |||
Party | Candidate | Votes | % | ±% | |
---|---|---|---|---|---|
Labor | Valerie Callister | 14,472 | 52.7 | −7.9 | |
Liberal | Graeme Bond | 6,976 | 25.4 | +1.3 | |
Independent | Geoffrey Francis | 3,701 | 13.5 | +13.5 | |
National | Terie Porter | 2,305 | 8.4 | −0.5 | |
Total formal votes | 27,454 | 97.8 | |||
Informal votes | 616 | 2.2 | |||
Turnout | 28,070 | 93.6 | |||
Two-party-preferred result | |||||
Labor | Valerie Callister | 15,759 | 57.4 | −7.4 | |
Liberal | Graeme Bond | 11,695 | 42.6 | +7.4 | |
Labor hold | Swing | -7.4 | |||
Party | Candidate | Votes | % | ±% | |
---|---|---|---|---|---|
National | Ken Jasper | 16,880 | 59.0 | +5.3 | |
Labor | Jill Milthorpe | 7,633 | 26.7 | −3.8 | |
Liberal | Bill Hunter | 4,093 | 14.3 | −1.3 | |
Total formal votes | 28,606 | 98.2 | |||
Informal votes | 526 | 1.8 | |||
Turnout | 29,132 | 94.1 | |||
Two-party-preferred result | |||||
National | Ken Jasper | 20,654 | 72.2 | +3.9 | |
Labor | Jill Milthorpe | 7,952 | 27.8 | −3.9 | |
National hold | Swing | +3.9 | |||
Party | Candidate | Votes | % | ±% | |
---|---|---|---|---|---|
Labor | Robin Matthews | 12,619 | 46.3 | +0.4 | |
Liberal | John Delzoppo | 11,880 | 43.6 | +5.8 | |
National | Julia Ettery | 1,905 | 7.0 | −1.8 | |
Independent | John McNamara | 842 | 3.1 | +3.1 | |
Total formal votes | 27,246 | 98.0 | |||
Informal votes | 564 | 2.0 | |||
Turnout | 27,810 | 94.5 | |||
Two-party-preferred result | |||||
Liberal | John Delzoppo | 13,716 | 50.4 | +1.8 | |
Labor | Robin Matthews | 13,522 | 49.6 | −1.8 | |
Liberal notional gain from Labor | Swing | +1.8 | |||
Party | Candidate | Votes | % | ±% | |
---|---|---|---|---|---|
Labor | Jack Simpson | 17,177 | 63.0 | +0.6 | |
Liberal | Mark Pallett | 10,094 | 37.0 | +9.0 | |
Total formal votes | 27,271 | 96.4 | |||
Informal votes | 1,016 | 3.6 | |||
Turnout | 28,287 | 95.2 | |||
Labor hold | Swing | -5.2 | |||
Party | Candidate | Votes | % | ±% | |
---|---|---|---|---|---|
Labor | Frank Wilkes | 19,120 | 71.8 | −2.8 | |
Liberal | William Hamilton | 7,495 | 28.2 | +2.8 | |
Total formal votes | 26,615 | 95.5 | |||
Informal votes | 1,252 | 4.5 | |||
Turnout | 27,867 | 90.8 | |||
Labor hold | Swing | -2.8 | |||
Party | Candidate | Votes | % | ±% | |
---|---|---|---|---|---|
Labor | Race Mathews | 14,374 | 53.8 | −0.6 | |
Liberal | Norman Kennedy | 11,493 | 43.0 | +5.1 | |
Independent | Antonios Pashos | 846 | 3.2 | +3.2 | |
Total formal votes | 26,713 | 97.1 | |||
Informal votes | 783 | 2.9 | |||
Turnout | 27,496 | 91.8 | |||
Two-party-preferred result | |||||
Labor | Race Mathews | 14,986 | 56.1 | −3.0 | |
Liberal | Norman Kennedy | 11,727 | 43.9 | +3.0 | |
Labor hold | Swing | -3.0 | |||
Party | Candidate | Votes | % | ±% | |
---|---|---|---|---|---|
Labor | Tom Edmunds | 16,783 | 61.4 | +1.3 | |
Liberal | Vincenzo D'Aquino | 10,571 | 38.6 | +2.3 | |
Total formal votes | 27,354 | 96.4 | |||
Informal votes | 1,011 | 3.6 | |||
Turnout | 28,365 | 94.3 | |||
Labor hold | Swing | 0.0 | |||
Party | Candidate | Votes | % | ±% | |
---|---|---|---|---|---|
Liberal | Ian Smith | 16,907 | 54.5 | −6.7 | |
Labor | Jeffery Rootes | 8,401 | 29.4 | −1.0 | |
National | David Seymour | 4,626 | 16.2 | +16.2 | |
Total formal votes | 28,608 | 98.4 | |||
Informal votes | 453 | 1.6 | |||
Turnout | 29,061 | 96.0 | |||
Two-party-preferred result | |||||
Liberal | Ian Smith | 19,539 | 68.3 | +3.3 | |
Labor | Jeffery Rootes | 9,069 | 31.7 | −3.3 | |
Liberal hold | Swing | +3.3 | |||
Party | Candidate | Votes | % | ±% | |
---|---|---|---|---|---|
Liberal | Digby Crozier | 13,562 | 50.3 | −5.4 | |
Labor | William Sharrock | 9,244 | 34.3 | −4.2 | |
National | James Patterson | 4,176 | 15.5 | +15.5 | |
Total formal votes | 26,982 | 98.6 | |||
Informal votes | 388 | 1.4 | |||
Turnout | 27,370 | 94.9 | |||
Two-party-preferred result | |||||
Liberal | Digby Crozier | 17,080 | 63.3 | +4.7 | |
Labor | William Sharrock | 9,902 | 36.7 | −4.7 | |
Liberal hold | Swing | +4.7 | |||
Party | Candidate | Votes | % | ±% | |
---|---|---|---|---|---|
Liberal | Don Hayward | 14,582 | 53.4 | +3.9 | |
Labor | Hendrik van Leeuwen | 11,250 | 41.2 | −3.4 | |
Independent | Norman Long | 746 | 2.7 | +2.7 | |
Public Transport | Alan Parker | 714 | 2.6 | +2.6 | |
Total formal votes | 27,292 | 97.2 | |||
Informal votes | 788 | 2.8 | |||
Turnout | 28,080 | 88.3 | |||
Two-party-preferred result | |||||
Liberal | Don Hayward | 15,502 | 56.8 | +5.1 | |
Labor | Hendrik van Leeuwen | 11,790 | 43.2 | −5.1 | |
Liberal hold | Swing | +5.1 | |||
Party | Candidate | Votes | % | ±% | |
---|---|---|---|---|---|
Labor | Carl Kirkwood | 19,473 | 69.6 | −1.5 | |
Liberal | Mark Leaman | 8,517 | 30.4 | +20.0 | |
Total formal votes | 27,990 | 95.8 | |||
Informal votes | 1,234 | 4.2 | |||
Turnout | 29,224 | 91.3 | |||
Labor hold | Swing | -5.3 | |||
Party | Candidate | Votes | % | ±% | |
---|---|---|---|---|---|
Labor | Jim Simmonds | 18,837 | 68.7 | −2.2 | |
Liberal | Rae Kennett | 8,597 | 31.3 | +2.4 | |
Total formal votes | 27,434 | 95.8 | |||
Informal votes | 1,209 | 4.2 | |||
Turnout | 28,643 | 93.8 | |||
Labor hold | Swing | -2.4 | |||
Party | Candidate | Votes | % | ±% | |
---|---|---|---|---|---|
Labor | Theo Sidiropoulos | 18,396 | 71.4 | +2.1 | |
Liberal | John Sevior | 7,366 | 28.6 | +10.0 | |
Total formal votes | 25,762 | 95.2 | |||
Informal votes | 1,290 | 4.8 | |||
Turnout | 27,052 | 87.1 | |||
Labor hold | Swing | -6.5 | |||
Party | Candidate | Votes | % | ±% | |
---|---|---|---|---|---|
Labor | Kay Setches | 14,466 | 52.7 | +5.5 | |
Liberal | Michael Dobson | 12,986 | 47.3 | +6.8 | |
Total formal votes | 27,452 | 97.9 | |||
Informal votes | 593 | 2.1 | |||
Turnout | 28,045 | 93.9 | |||
Labor hold | Swing | +0.1 | |||
Party | Candidate | Votes | % | ±% | |
---|---|---|---|---|---|
Liberal | Tom Austin | 15,861 | 56.5 | +2.1 | |
Labor | John McQuilten | 12,204 | 43.5 | −2.0 | |
Total formal votes | 28,065 | 98.2 | |||
Informal votes | 501 | 1.8 | |||
Turnout | 28,566 | 95.5 | |||
Liberal hold | Swing | +2.0 | |||
Party | Candidate | Votes | % | ±% | |
---|---|---|---|---|---|
National | Eddie Hann | 19,893 | 70.4 | +8.2 | |
Labor | Denise MacDonald | 5,430 | 19.2 | −0.4 | |
Liberal | John Adams | 2,917 | 10.3 | −4.3 | |
Total formal votes | 28,240 | 98.6 | |||
Informal votes | 393 | 1.4 | |||
Turnout | 28,633 | 94.6 | |||
Two-party-preferred result | |||||
National | Eddie Hann | 22,620 | 80.1 | +2.0 | |
Labor | Denise MacDonald | 5,620 | 19.9 | −2.0 | |
National hold | Swing | +2.0 | |||
Party | Candidate | Votes | % | ±% | |
---|---|---|---|---|---|
Labor | Alex Andrianopoulos | 19,642 | 71.0 | −5.1 | |
Liberal | Martin Power | 8,033 | 29.0 | +6.4 | |
Total formal votes | 27,675 | 93.8 | |||
Informal votes | 1,823 | 6.2 | |||
Turnout | 29,498 | 93.4 | |||
Labor hold | Swing | -6.2 | |||
Party | Candidate | Votes | % | ±% | |
---|---|---|---|---|---|
Labor | Andrew McCutcheon | 13,918 | 52.7 | +3.6 | |
Liberal | Richard Stevenson | 12,518 | 47.3 | +4.4 | |
Total formal votes | 26,436 | 96.4 | |||
Informal votes | 973 | 3.6 | |||
Turnout | 27,409 | 88.9 | |||
Labor hold | Swing | +0.2 | |||
Party | Candidate | Votes | % | ±% | |
---|---|---|---|---|---|
Liberal | David Lea | 15,330 | 54.9 | +4.9 | |
Labor | Ann Corcoran | 12,603 | 45.1 | +1.3 | |
Total formal votes | 27,933 | 97.8 | |||
Informal votes | 640 | 2.2 | |||
Turnout | 28,573 | 92.8 | |||
Liberal gain from Labor | Swing | +2.3 | |||
Party | Candidate | Votes | % | ±% | |
---|---|---|---|---|---|
National | Peter Ross-Edwards | 15,428 | 56.6 | +9.0 | |
Labor | David Wauchope | 7,090 | 26.0 | −4.0 | |
Liberal | Alan Fitzgerald | 4,721 | 17.3 | −5.0 | |
Total formal votes | 27,239 | 98.0 | |||
Informal votes | 545 | 2.0 | |||
Turnout | 27,784 | 93.8 | |||
Two-party-preferred result | |||||
National | Peter Ross-Edwards | 19,830 | 72.8 | +4.9 | |
Labor | David Wauchope | 7,409 | 27.2 | −4.9 | |
National hold | Swing | +4.9 | |||
Party | Candidate | Votes | % | ±% | |
---|---|---|---|---|---|
Liberal | Harley Dickinson | 14,218 | 53.4 | +3.8 | |
Labor | Harry Naylor | 12,406 | 46.6 | +2.8 | |
Total formal votes | 26,224 | 98.0 | |||
Informal votes | 535 | 2.0 | |||
Turnout | 27,159 | 95.8 | |||
Liberal hold | Swing | +1.0 | |||
Party | Candidate | Votes | % | ±% | |
---|---|---|---|---|---|
Labor | Eddie Micallef | 15,207 | 57.0 | +3.0 | |
Liberal | Therese Marley | 11,465 | 43.0 | +2.5 | |
Total formal votes | 26,672 | 95.9 | |||
Informal votes | 1,130 | 4.1 | |||
Turnout | 27,802 | 93.8 | |||
Labor hold | Swing | -0.8 | |||
Party | Candidate | Votes | % | ±% | |
---|---|---|---|---|---|
Labor | Bill Fogarty | 19,032 | 71.1 | −3.2 | |
Liberal | Aldous Hicks | 7,748 | 28.9 | +6.8 | |
Total formal votes | 26,780 | 95.5 | |||
Informal votes | 1,251 | 4.5 | |||
Turnout | 28,031 | 92.4 | |||
Labor hold | Swing | -5.1 | |||
Party | Candidate | Votes | % | ±% | |
---|---|---|---|---|---|
National | Barry Steggall | 15,192 | 58.4 | +38.6 | |
Liberal | Ian Ray | 5,450 | 20.9 | −35.7 | |
Labor | Ronald Stanton | 5,388 | 20.7 | +0.5 | |
Total formal votes | 26,030 | 98.5 | |||
Informal votes | 398 | 1.5 | |||
Turnout | 26,428 | 94.2 | |||
Two-party-preferred result | |||||
National | Barry Steggall | 20,199 | 77.6 | +3.7 | |
Labor | Ronald Stanton | 5,831 | 22.4 | −3.7 | |
National gain from Liberal | Swing | N/A | |||
Party | Candidate | Votes | % | ±% | |
---|---|---|---|---|---|
Liberal | Geoff Coleman | 13,492 | 49.7 | +6.3 | |
Labor | David Gray | 12,862 | 47.4 | +0.8 | |
Independent | Edward Hawthorn | 773 | 2.9 | +2.9 | |
Total formal votes | 27,127 | 97.5 | |||
Informal votes | 696 | 2.5 | |||
Turnout | 27,823 | 95.3 | |||
Two-party-preferred result | |||||
Liberal | Geoff Coleman | 13,929 | 51.4 | +1.5 | |
Labor | David Gray | 13,198 | 48.6 | −1.5 | |
Liberal gain from Labor | Swing | +1.5 | |||
Party | Candidate | Votes | % | ±% | |
---|---|---|---|---|---|
Labor | Beth Gleeson | 19,802 | 73.9 | −1.0 | |
Liberal | Adam Barr | 6,994 | 26.1 | +11.4 | |
Total formal votes | 26,796 | 95.4 | |||
Informal votes | 1,303 | 4.6 | |||
Turnout | 28,099 | 94.5 | |||
Labor hold | Swing | -6.6 | |||
Party | Candidate | Votes | % | ±% | |
---|---|---|---|---|---|
Labor | Carolyn Hirsh | 14,624 | 55.3 | +3.1 | |
Liberal | Karen Dettmann | 11,838 | 44.7 | +5.5 | |
Total formal votes | 26,462 | 97.3 | |||
Informal votes | 724 | 2.7 | |||
Turnout | 27,186 | 95.4 | |||
Labor hold | Swing | -2.1 | |||
Party | Candidate | Votes | % | ±% | |
---|---|---|---|---|---|
Labor | Lou Hill | 12,879 | 48.7 | +3.1 | |
Liberal | Gracia Baylor | 12,270 | 46.4 | +4.8 | |
Independent | Timothy Connellan | 1,275 | 4.8 | +4.8 | |
Total formal votes | 26,424 | 98.2 | |||
Informal votes | 483 | 1.8 | |||
Turnout | 26,907 | 94.4 | |||
Two-party-preferred result | |||||
Labor | Lou Hill | 13,254 | 50.2 | −4.5 | |
Liberal | Gracia Baylor | 13,167 | 49.8 | +4.5 | |
Labor hold | Swing | -4.5 | |||
Party | Candidate | Votes | % | ±% | |
---|---|---|---|---|---|
Liberal | Adam Kempton | 11,417 | 41.4 | −17.7 | |
National | John McGrath | 8,871 | 32.2 | +32.2 | |
Labor | Peter Cox | 7,265 | 26.4 | −8.6 | |
Total formal votes | 27,553 | 99.0 | |||
Informal votes | 288 | 1.0 | |||
Turnout | 27,841 | 94.7 | |||
Two-party-preferred result | |||||
National | John McGrath | 18,130 | 65.8 | +0.7 | |
Labor | Peter Cox | 9,423 | 34.2 | −0.7 | |
Two-candidate-preferred result | |||||
National | John McGrath | 15,578 | 56.5 | +56.5 | |
Liberal | Adam Kempton | 11,975 | 43.5 | −21.6 | |
National gain from Liberal | Swing | N/A | |||
Party | Candidate | Votes | % | ±% | |
---|---|---|---|---|---|
Labor | Ken Coghill | 14,376 | 53.8 | −8.6 | |
Liberal | Thomas Hudson | 10,268 | 38.4 | +8.4 | |
Weekend Trading | Robert Wolstenholme | 2,083 | 7.8 | +7.8 | |
Total formal votes | 26,727 | 97.8 | |||
Informal votes | 592 | 2.2 | |||
Turnout | 27,319 | 92.9 | |||
Two-party-preferred result | |||||
Labor | Ken Coghill | 15,021 | 56.2 | −10.4 | |
Liberal | Thomas Hudson | 11,706 | 43.8 | +10.4 | |
Labor hold | Swing | -10.4 | |||
Party | Candidate | Votes | % | ±% | |
---|---|---|---|---|---|
Labor | Max McDonald | 15,209 | 54.6 | +3.6 | |
Liberal | Haydn Gregson | 12,640 | 45.4 | +2.8 | |
Total formal votes | 27,849 | 97.7 | |||
Informal votes | 652 | 2.3 | |||
Turnout | 28,501 | 94.4 | |||
Labor hold | Swing | -1.1 | |||
Party | Candidate | Votes | % | ±% | |
---|---|---|---|---|---|
Labor | Gordon Stirling | 19,014 | 68.8 | +0.6 | |
Liberal | David Allan | 8,633 | 31.2 | +5.3 | |
Total formal votes | 27,647 | 96.2 | |||
Informal votes | 1,094 | 3.8 | |||
Turnout | 28,741 | 93.3 | |||
Labor hold | Swing | -2.8 | |||
Electoral systems of the Australian states and territories are broadly similar to the electoral system used in federal elections in Australia.
The Victorian Legislative Assembly is the state lower house of the bicameral Parliament of Victoria in Australia; the state upper house being the Victorian Legislative Council. Both houses sit at Parliament House in Spring Street, Melbourne. The main colour used for the upholstery and carpets furnishing the Chamber of the Legislative Assembly is green.
The Victorian Legislative Council (VLC) is the upper house of the bicameral Parliament of Victoria, Australia, the lower house being the Legislative Assembly. Both houses sit at Parliament House in Spring Street, Melbourne. The Legislative Council serves as a house of review, in a similar fashion to its federal counterpart, the Australian Senate. Although, it is possible for legislation to be first introduced in the Council, most bills receive their first hearing in the Legislative Assembly.
A group voting ticket (GVT) is a shortcut for voters in a preferential voting system, where a voter can indicate support for a list of candidates instead of marking preferences for individual candidates. For multi-member electoral divisions with single transferable voting, a group or party registers a GVT before an election with the electoral commission. When a voter selects a group or party above the line on a ballot paper, their vote is distributed according to the registered GVT for that group.
The 2002 Victorian state election, held on Saturday, 30 November 2002, was for the 55th Parliament of Victoria. It was held to elect the 88 members of Victorian Legislative Assembly and 22 members of the 44-member Legislative Council.
The 1999 Victorian state election, held on Saturday, 18 September 1999, was for the 54th Parliament of Victoria. It was held in the Australian state of Victoria to elect the 88 members of the state's Legislative Assembly and 22 members of the 44-member Legislative Council. The Liberal–National Coalition led by Jeff Kennett and Pat McNamara, which had held majority government since the 1996 election, lost 15 seats and its majority due mainly to a swing against it in rural and regional Victoria.
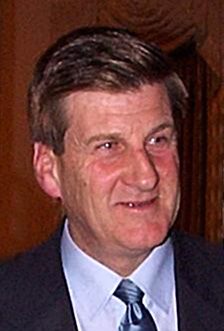
The 1996 Victorian state election, held on Saturday, 30 March 1996, was for the 53rd Parliament of Victoria. It was held in the Australian state of Victoria to elect all 88 members of the state's Legislative Assembly and 22 members of the 44-member Legislative Council. The election took place four weeks after the 1996 federal election which swept the Labor Party from power nationally.
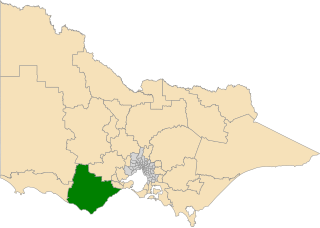
The electoral district of Thomastown is an electorate of the Victorian Legislative Assembly. It currently includes the suburbs of Lalor and Thomastown, and parts of Fawkner, Reservoir and Wollert, and has been in existence since 1985.
The electoral district of Mount Waverley was an electoral district of the Victorian Legislative Assembly. It was located in the south-eastern suburbs of Melbourne and contained the suburbs of Glen Waverley and Mount Waverley.
The electoral district of Geelong is an electoral district of the Victorian Legislative Assembly. It centres on inner metropolitan Geelong and following the June 2013 redistribution of electoral boundaries includes the suburbs of Belmont, Breakwater, East Geelong, Geelong, Geelong West, Newtown and South Geelong, Herne Hill, Manifold Heights, Newcomb, Newtown, St Albans Park, Thomson, Whittington and part of Fyansford.
Prahran is an electoral district of the Legislative Assembly in the Australian state of Victoria. It was created by the Electoral Act Amendment Act 1888, taking effect at the 1889 elections. The electorate is the state’s smallest by area, covering a little under 11 km2 in the inner south-east of Melbourne. It includes the suburbs of South Yarra, Prahran and Windsor, as well as parts of Southbank, St Kilda and St Kilda East.
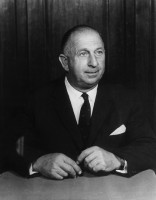
Elections were held in the Australian state of Victoria on 27 June 1964 to elect the 66 members of the state's Legislative Assembly and 17 members of the 34-member Legislative Council. The Liberal and Country Party (LCP) government of Premier Henry Bolte won a fourth term in office.
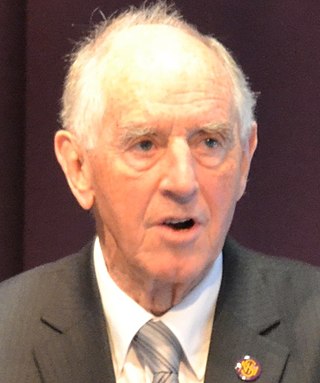
The 1985 Victorian state election, held on Saturday, 2 March 1985, was for the 50th Parliament of Victoria. It was held in the Australian state of Victoria to elect all 88 members of the state's Legislative Assembly and 22 members of the 44-member Legislative Council. Since the previous election, the number of members of the Legislative Assembly was increased by 7 to 88.
The 1927 Victorian state election was held in the Australian state of Victoria on Saturday, 9 April 1927, to elect the 65 members of the state's Legislative Assembly.
The 2018 Victorian state election was held on Saturday, 24 November 2018 to elect the 59th Parliament of Victoria. All 88 seats in the Legislative Assembly and all 40 seats in the Legislative Council were up for election. The first-term incumbent Labor government, led by Premier Daniel Andrews, won a second four-year term, defeating the Liberal/National Coalition opposition, led by Opposition Leader Matthew Guy in a landslide victory. Minor party the Greens led by Samantha Ratnam also contested the election.
The Nunawading Province by-election of 1985 was a by-election in the Nunawading Province for the Victorian Legislative Council held on 17 August 1985. It was ordered by the Court of Disputed Returns after the 1985 Victorian state election had resulted in a dead heat between the top two candidates, and the Chief Electoral Officer drew a name at random. The Chief Electoral Officer drew the name of the ALP candidate Bob Ives. After the Court ordered a new election, the outcome was that the Liberal candidate Rosemary Varty was returned.
This is a list of electoral district results for the Victorian 1982 election.
The 2022 Victorian state election was held on Saturday, 26 November 2022 to elect the 60th Parliament of Victoria. All 88 seats in the Legislative Assembly and all 40 seats in the Legislative Council were up for election at the time the writs were issued, however the election in the district of Narracan was deferred due to the death of a candidate.
The Australian Federation Party (AFP), also known as AusFeds and formerly known as the Country Alliance and the Australian Country Party, is an Australian political party. Founded in 2004 by four rural Victorians, the party lodged its initial registration with the Victorian Electoral Commission on 15 August 2005.
The 2026 Victorian state election is expected to be held on 28 November 2026 to elect the 61st Parliament of Victoria. All 88 seats in the Legislative Assembly and all 40 seats in the Legislative Council will be up for election, presuming there are no new electorates added in a redistribution.