Rg chromaticity

Last updated

The RGB chromaticity space, two dimensions of the normalized RGB space, [1] is a chromaticity space, a two-dimensional color space in which there is no intensity information.

Contents

In the RGB color space a pixel is identified by the intensity of red, green, and blue primary colors. Therefore, a bright red can be represented as (R,G,B) (255,0,0), while a dark red may be (40,0,0). In the normalized RGB space or RG space, a color is represented by the proportion of red, green, and blue in the color, rather than by the intensity of each. Since these proportions must always add up to a total of 1, we are able to quote just the red and green proportions of the color, and can calculate the blue value if necessary.

Conversion between RGB and RG Chromaticity

Given a color (R,G,B) where R, G, B = linear intensity of red, green and blue, this can be converted to color where imply the proportion of red, green and blue in the original color: [2] [3]

The sum of rgb will always equal one, because of this property the b dimension can be thrown away without causing any loss in information. The reverse conversion is not possible with only two dimensions, as the intensity information is lost during the conversion to rg chromaticity, e.g. (1/3, 1/3, 1/3) has equal proportions of each color, but it is not possible to determine whether this corresponds to black, gray, or white. If R, G, B, is normalized to r, g, G color space the conversion can be computed by the following:

The conversion from rgG to RGB, is the same as the conversion from xyY to XYZ. [4] The conversion requires at least some information relative to the intensity of the scene. For this reason if the G is preserved then the inverse is possible.

Version used in computer vision

Motivation

Computer vision algorithms tend to suffer from varying imaging conditions. To make more robust computer vision algorithms it is important to use a (approximately) color invariant color space. Color invariant color spaces are desensitized to disturbances in the image. One common problem in computer vision is varying light source (color and intensity) between multiple images and within a single image. [5]

The rg colorspace is used out of a desire for pixel-based photometric invariance. For example, if a scene is lit by a spotlight, an object of a given color will change in apparent color as it moves across the scene. Where color is being used to track an object in an RGB image, this can cause problems. Removing the intensity component should keep the color constant.

Practice

In practice, computer vision uses an "incorrect" form of rg colorspace derived directly from gamma-corrected RGB, typically sRGB. As a result, full removal of intensity is not achieved and 3D objects still show some of fringing.

Illustration

Elkhorn Slough.jpg
A photograph with varying illumination levels.
RG Chromaticity Example.png
A visual representation of the chromaticity of the image. Each pixel has been scaled so the total red, green, and blue coordinates sum to 1. Notice the effect on the foliage and shadowed regions.
Image without chromaticity.png
A visual representation of the average value of red, green, and blue coordinates for each pixel in the original image. This information can be combined with the rg chromaticity information to reconstruct the original image.

rg color space

Normalized rg Color Space Rg normalized color coordinates.png
Normalized rg Color Space

r, g, and b chromaticity coordinates are ratios of the one tristimulus value over the sum of all three tristimulus values. A neutral object infers equal values of red, green and blue stimulus. The lack of luminance information in rg prevents having more than 1 neutral point where all three coordinates are of equal value. The white point of the rg chromaticity diagram is defined by the point (1/3,1/3). The white point has one third red, one third green and the final third blue. On an rg chromaticity diagram the first quadrant where all values of r and g are positive forms a right triangle. With max r equals 1 unit along the x and max g equals 1 unit along the y axis. Connecting a line from the max r (1,0) to max g (0,1) from a straight line with slope of negative 1. Any sample that falls on this line has no blue. Moving along the line from max r to max g, shows a decrease in red and an increase of green in the sample, without blue changing. The further a sample moves from this line the more blue is present in the sample trying to be matched.

CIE RGB

The CIE 1931 RGB Color matching functions. The color matching functions are the amounts of primaries needed to match the monochromatic test primary at the wavelength shown on the horizontal scale. CIE1931 RGBCMF.svg
The CIE 1931 RGB Color matching functions. The color matching functions are the amounts of primaries needed to match the monochromatic test primary at the wavelength shown on the horizontal scale.

RGB is a color mixture system. Once the color matching function are determined the tristimulus values can be determined easily. Since standardization is required to compare results, CIE established standards to determine color matching function. [6]

  1. The reference stimuli must be monochromatic lights R, G, B. With wavelengths respectively.
  2. The basic stimulus is white with equal energy spectrum. Require a ratio of 1.000:4.5907:0.0601 (RGB) to match white point.

Therefore, a white with equi-energy lights of 1.000 + 4.5907 + 0.0601 = 5.6508 lm can be matched by mixing together R, G and B. Guild and Wright used 17 subjects to determine RGB color matching functions. [7] RGB color matching serve as the base for rg chromaticity. The RGB color matching functions are used to determine the tristimulus RGB values for a spectrum. Normalizing the RGB tristimulus values converts the tristimulus into rgb. Normalized RGB tristimulus value can be plotted on an rg chromaticity diagram.

An example of color matching function below. is any monochromatic. Any monochromatic can be matched by adding reference stimuli and . The test light is also to bright to account for this reference stimuli is added to the target to dull the saturation. Thus is negative. and can be defined as a vector in a three-dimensional space. This three-dimensional space is defined as the color space. Any color can be reached by matching a given amount of and .

The negative calls for color matching functions that are negative at certain wavelengths. This is evidence of why the color matching function appears to have negative tristimulus values.

rg chromaticity diagram

rg Chromaticity Diagram CIE rg Diagram.jpg
rg Chromaticity Diagram

The figure to the side is a plotted rg chromaticity diagram. Noting the importance of the E which is defined as the white point where rg are equal and have a value of 1/3. Next notice the straight line from (0,1) to (1,0), follows the expression y = -x + 1. As the x (red) increases the y (green) decreases by the same amount. Any point on the line represents the limit in rg, and can be defined by a point that has no b information and formed by some combination of r and g. Moving of the linear line towards E represents a decrease in r and g and an increase in b. In computer vision and digital imagery only use the first quadrant because a computer cannot display negative RGB values. The range of RGB is 0-255 for most displays. But when trying to form color matches using real stimuli negative values are needed according to Grassmann's Laws to match all possible colors. This is why the rg chromaticity diagram extends in the negative r direction.

Conversion xyY color system

Avoiding negative color coordinate values prompted the change from to rg to xy. Negative coordinates are used in rg space because when making a spectral sample match can be created by adding stimulus to the sample. The color matching functions r, g, and b are negative at certain wavelengths to allow for any monochromatic sample to be matched. This is why in the rg chromaticity diagram the spectral locus extents into the negative r direction and ever so slightly into the negative g direction. On an xy chromaticity diagram the spectral locus if formed by all positive values of x and y.

See also

Related Research Articles

<span class="mw-page-title-main">RGB color model</span> Color model based on red, green and blue

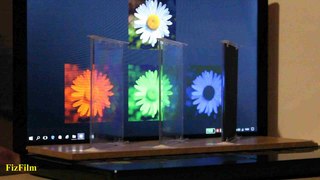
The RGB color model is an additive color model in which the red, green and blue primary colors of light are added together in various ways to reproduce a broad array of colors. The name of the model comes from the initials of the three additive primary colors, red, green, and blue.

<span class="mw-page-title-main">Primary color</span> Sets of colors that can be mixed to produce gamut of colors

A set of primary colors or primary colours consists of colorants or colored lights that can be mixed in varying amounts to produce a gamut of colors. This is the essential method used to create the perception of a broad range of colors in, e.g., electronic displays, color printing, and paintings. Perceptions associated with a given combination of primary colors can be predicted by an appropriate mixing model that reflects the physics of how light interacts with physical media, and ultimately the retina.

<span class="mw-page-title-main">Hue</span> Property of a color indicating balance of color perceived by the normal human eye

In color theory, hue is one of the main properties of a color, defined technically in the CIECAM02 model as "the degree to which a stimulus can be described as similar to or different from stimuli that are described as red, orange, yellow, green, blue, violet," within certain theories of color vision.

<span class="mw-page-title-main">RGB color spaces</span> Any additive color space based on the RGB color model

An RGB color space is any additive color space based on the RGB color model.

<span class="mw-page-title-main">HSL and HSV</span> Alternative representations of the RGB color model

HSL and HSV are alternative representations of the RGB color model, designed in the 1970s by computer graphics researchers. In these models, colors of each hue are arranged in a radial slice, around a central axis of neutral colors which ranges from black at the bottom to white at the top.

In digital photography, computer-generated imagery, and colorimetry, a grayscale image is one in which the value of each pixel is a single sample representing only an amount of light; that is, it carries only intensity information. Grayscale images, a kind of black-and-white or gray monochrome, are composed exclusively of shades of gray. The contrast ranges from black at the weakest intensity to white at the strongest.

In image processing and photography, a color histogram is a representation of the distribution of colors in an image. For digital images, a color histogram represents the number of pixels that have colors in each of a fixed list of color ranges, that span the image's color space, the set of all possible colors.

sRGB Standard RGB color space

sRGB is a standard RGB color space that HP and Microsoft created cooperatively in 1996 to use on monitors, printers, and the World Wide Web. It was subsequently standardized by the International Electrotechnical Commission (IEC) as IEC 61966-2-1:1999. sRGB is the current defined standard colorspace for the web, and it is usually the assumed colorspace for images that are neither tagged for a colorspace nor have an embedded color profile.

<span class="mw-page-title-main">Adobe RGB color space</span> Color space developed by Adobe

The Adobe RGB (1998) color space or opRGB is a color space developed by Adobe Inc. in 1998. It was designed to encompass most of the colors achievable on CMYK color printers, but by using RGB primary colors on a device such as a computer display. The Adobe RGB (1998) color space encompasses roughly 50% of the visible colors specified by the CIELAB color space – improving upon the gamut of the sRGB color space, primarily in cyan-green hues. It was subsequently standardized by the IEC as IEC 61966-2-5:1999 with a name opRGB and is used in HDMI.

<span class="mw-page-title-main">Color balance</span> Adjustment of color intensities in photography

In photography and image processing, color balance is the global adjustment of the intensities of the colors. An important goal of this adjustment is to render specific colors – particularly neutral colors like white or grey – correctly. Hence, the general method is sometimes called gray balance, neutral balance, or white balance. Color balance changes the overall mixture of colors in an image and is used for color correction. Generalized versions of color balance are used to correct colors other than neutrals or to deliberately change them for effect. White balance is one of the most common kinds of balancing, and is when colors are adjusted to make a white object appear white and not a shade of any other colour.

A color model is an abstract mathematical model describing the way colors can be represented as tuples of numbers, typically as three or four values or color components. When this model is associated with a precise description of how the components are to be interpreted, taking account of visual perception, the resulting set of colors is called "color space."

<span class="mw-page-title-main">CIE 1931 color space</span> Color space defined by the CIE in 1931

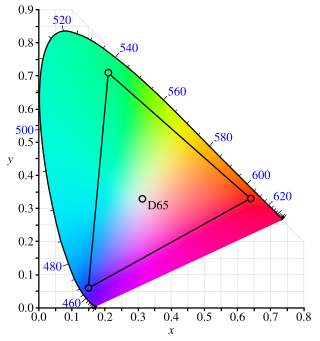
The CIE 1931 color spaces are the first defined quantitative links between distributions of wavelengths in the electromagnetic visible spectrum, and physiologically perceived colors in human color vision. The mathematical relationships that define these color spaces are essential tools for color management, important when dealing with color inks, illuminated displays, and recording devices such as digital cameras. The system was designed in 1931 by the "Commission Internationale de l'éclairage", known in English as the International Commission on Illumination.

The Standard Reference Method or SRM is one of several systems modern brewers use to specify beer color. Determination of the SRM value involves measuring the attenuation of light of a particular wavelength (430 nm) in passing through 1 cm of the beer, expressing the attenuation as an absorption and scaling the absorption by a constant.

<span class="mw-page-title-main">LMS color space</span> Color space represented by the response of the three types of cones of the human eye

LMS, is a color space which represents the response of the three types of cones of the human eye, named for their responsivity (sensitivity) peaks at long, medium, and short wavelengths.

Relative luminance follows the photometric definition of luminance including spectral weighting for human vision, but while luminance is a measure of light in units such as , Relative luminance values are normalized as 0.0 to 1.0, with 1.0 being a theoretical perfect reflector of 100% reference white. Like the photometric definition, it is related to the luminous flux density in a particular direction, which is radiant flux density weighted by the luminous efficiency function y(λ) of the CIE Standard Observer.

<span class="mw-page-title-main">Standard illuminant</span> Theoretical source of visible light

A standard illuminant is a theoretical source of visible light with a spectral power distribution that is published. Standard illuminants provide a basis for comparing images or colors recorded under different lighting.

Adams chromatic valence color spaces are a class of color spaces suggested by Elliot Quincy Adams. Two important Adams chromatic valence spaces are CIELUV and Hunter Lab.

Grassmann's laws describe empirical results about how the perception of mixtures of colored lights composed of different spectral power distributions can be algebraically related to one another in a color matching context. Discovered by Hermann Grassmann these "laws" are actually principles used to predict color match responses to a good approximation under photopic and mesopic vision. A number of studies have examined how and why they provide poor predictions under specific conditions.

<span class="mw-page-title-main">CIE 1960 color space</span>

The CIE 1960 color space ("CIE 1960 UCS", variously expanded Uniform Color Space, Uniform Color Scale, Uniform Chromaticity Scale, Uniform Chromaticity Space) is another name for the (u, v) chromaticity space devised by David MacAdam.

In colorimetry the OSA-UCS is a color space first published in 1947 and developed by the Optical Society of America’s Committee on Uniform Color Scales. Previously created color order systems, such as the Munsell color system, failed to represent perceptual uniformity in all directions. The committee decided that, in order to accurately represent uniform color differences in each direction, a new shape of three dimensional Cartesian geometry would need to be used.

References

  1. J. B. Martinkauppi & M. Pietikäinen (2005). "Facial Skin Color Modeling". In S. Z. Li & Anil K. Jain (eds.). Handbook of face recognition. Springer Science & Business. p. 117. ISBN   978-0-387-40595-7.
  2. W. T. Wintringham (1951). "Color Television and Colorimetry". In D L. MacAdam (ed.). Selected Papers on Colorimetry Fundamentals. SPIE - The International Society for Optical Engineering. p. 343. ISBN   0-8194-1296-1.
  3. Fairman, Hugh S; Brill, Michael H; Hemmendinger, Henry (1997). "How the CIE 1931 color-matching functions were derived from Wright-Guild data". Color Research & Application. 22: 11–23. doi:10.1002/(SICI)1520-6378(199702)22:1<11::AID-COL4>3.0.CO;2-7.
  4. Lindloom, Bruce (13 March 2009). "xyY to XYZ". www.brucelindbloom.com. Retrieved 7 December 2013.{{cite web}}: CS1 maint: url-status (link)
  5. T. Gevers; A. Gijsenji; J. van de Weijer & J. Geusebroek (2012). "Pixel-Based Photometric Invariance". In M. A. Kriss (ed.). Color in Computer Vision Fundamentals and Applications. Wiley - IS&T Series. p. 50. ISBN   978-0-470-89084-4.
  6. N. Ohto & A. R. Robertson (2005). "CIE Standard Colorimetric System". In M. A. Kriss (ed.). Colorimetry Fundamentals and Applications. Wiley - IS&T Series. p. 65. ISBN   978-0-470-09472-3.
  7. R. W. G. Hunt (2004). "The Colour Triangle". In M. A. Kriss (ed.). The Reproduction of Colour. Wiley - IS&T Series. p.  71. ISBN   0-470-02425-9.