
Hjørring nominating district is one of the 92 nominating districts that exists for Danish elections following the 2007 municipal reform. It consists of Hjørring municipality. It was created in 1849 as a constituency, and has been a nomination district since 1920, though its boundaries have been changed since then.
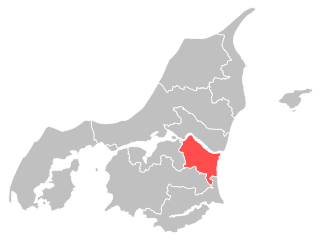
Aalborg East nominating district is one of the 92 nominating districts that was created for Danish elections following the 2007 municipal reform. It is one of the nominating districts from Aalborg Municipality, the others being Aalborg West and Aalborg North. It was created in 1915 as a constituency, and has been a nomination district since 1920, though its boundaries have been changed since then.

Skive nominating district is one of the 92 nominating districts that exists for Danish elections following the 2007 municipal reform. It consists of Skive municipality. It was created in 1849 as a constituency, and has been a nomination district since 1920, though its boundaries have been changed since then.
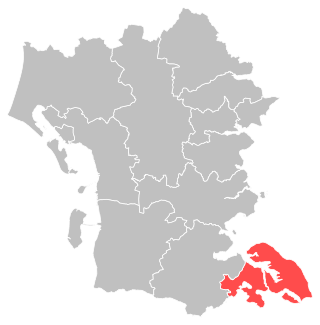
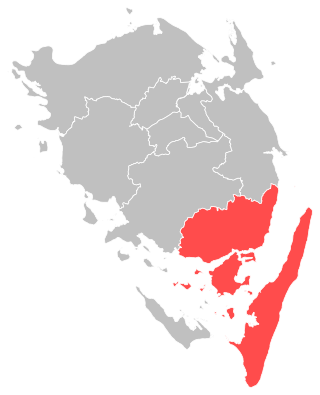
Sønderborg nominating district is one of the 92 nominating districts that exists for Danish elections following the 2007 municipal reform. It consists of Sønderborg municipality. It was created in 1920 following its reunification with Denmark, though its boundaries have been changed since then.
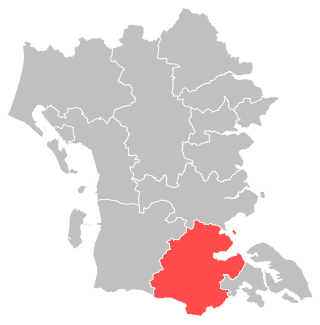
Aabenraa nominating district is one of the 92 nominating districts that exists for Danish elections following the 2007 municipal reform. It consists of Aabenraa Municipality. It was created in 1920 following its reunification with Denmark, though its boundaries have been changed since then.

Varde nominating district is one of the 92 nominating districts that exists for Danish elections following the 2007 municipal reform. It consists of Varde Municipality. It was created in 1849 as a constituency, and has been a nomination district since 1920, though its boundaries have been changed since then.

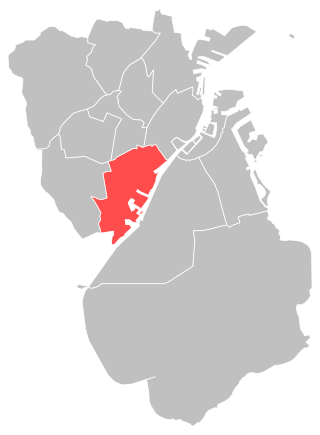
Odense South nominating district is one of the 92 nominating districts that exists for Danish elections following the 2007 municipal reform. It is one of the three nomination districts in Odense Municipality, the others being Odense East and Odense West. It was established as a constituency in 1895 as Odense County 2, and became a nomination district in 1920. It was named Odense County 1 from 1964 to 1970. It obtained its current boundaries and name in 1970.

Middelfart nominating district is one of the 92 nominating districts that exists for Danish elections following the 2007 municipal reform. It consists of Middelfart and Nordfyn municipality. It was created in 1849 as a constituency, and has been a nomination district since 1920, though its boundaries have been changed since then.
Nyborg nominating district is one of the 92 nominating districts that exists for Danish elections following the 2007 municipal reform. It consists of Kertminde and Nyborg municipality. It was created in 1849 as a constituency, and has been a nomination district since 1920, though its boundaries have been changed since then.
Svendborg nominating district is one of the 92 nominating districts that exists for Danish elections following the 2007 municipal reform. It consists of Langeland and Svendborg municipality. It was created in 1849 as a constituency, and has been a nomination district since 1920, though its boundaries have been changed since then.

Næstved nominating district is one of the 92 nominating districts that exists for Danish elections following the 2007 municipal reform. It consists of Næstved Municipality. It was created in 1849 as a constituency, and has been a nomination district since 1920, though its boundaries have been changed since then.

Kalundborg nominating district is one of the 92 nominating districts that exists for Danish elections following the 2007 municipal reform. It consists of Kalundborg and Odsherred municipality. It was created in 1849 as a constituency, and has been a nomination district since 1920, though its boundaries have been changed since then. Prior to 1970 it was known as Kalundborg-Onsbjerg.

Helsingør nominating district is one of the 92 nominating districts that exists for Danish elections following the 2007 municipal reform. It consists of Helsingør Municipality. It was created in 1849 as a constituency, and has been a nomination district since 1920. It is the only current nomination district whose boundaries have been unchanged since 1849.

Fredensborg nominating district is one of the 92 nominating districts that was created for Danish elections following the 2007 municipal reform. It consists of Fredensborg and Hørsholm municipality. It was created in 1849 as a constituency, and has been a nomination district since 1920, though its boundaries have been changed since then.

Gentofte nominating district is one of the 92 nominating districts that exists for Danish elections following the 2007 municipal reform. It consists of Gentofte Municipality. It was created in 1915 with its current boundary, though from 1950 to 2007 the other half of the municipality was part of a separate Hellerup nomination district.

Østerbro nominating district is one of the 92 nominating districts in Denmark. It was latest updated following the 2007 municipal reform. It is one of the 9 nominating districts in Copenhagen Municipality. It was created in 1915, though its boundaries have been changed since then.

Bispebjerg nominating district is one of the 92 nominating districts that exists for Danish elections following the 2007 municipal reform. It is one of the 9 nominating districts in Copenhagen Municipality. It was created in 1915, though its boundaries have been changed since then.

Valby nominating district is one of the 92 nominating districts that was created for Danish elections following the 2007 municipal reform. It is one of the 9 nominating districts in Copenhagen Municipality. It was created in 1895. In 1915 its boundaries were changed, and it became a nomination district. In 1953 it was divided into Valby-vest and Valby-øst. Valby-vest was renamed Valby from 1970 onwards, and this nomination district was expanded in area in 2007.
Vesterbro nominating district is one of the 92 nominating districts exists for Danish elections following the 2007 municipal reform. It is one of the 9 nominating districts in Copenhagen Municipality. It was created in 1915, though its boundaries have been changed since then.

Rønne nominating district is one of the 92 nominating districts that was created for Danish elections following the 2007 municipal reform. It is one of the 2 nominating districts in Bornholm Municipality, the other being Aakirkeby. It was created in 1849 as a constituency, and has been a nomination district since 1920, though its boundaries were changed in 1970.

