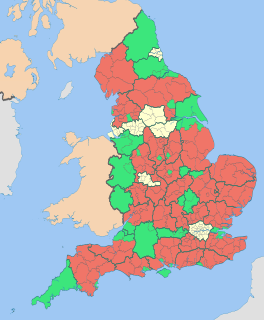
The 2000 Tandridge District Council election took place on 4 May 2000 to elect members of Tandridge District Council in Surrey, England. The whole council was up for election, rather than the normal election by thirds, following boundary changes since the last election in 1999. There remained 42 seats on the council: six three-member wards, ten two-member wards and four one-member wards. [1] [2] The Conservative party gained overall control of the council from no overall control. [3]
Non-metropolitan districts, or colloquially "shire districts", are a type of local government district in England. As created, they are sub-divisions of non-metropolitan counties in a two-tier arrangement.
Surrey is a subdivision of the English region of South East England in the United Kingdom. A historic and ceremonial county, Surrey is also one of the home counties. The county borders Kent to the east, East and West Sussex to the south, Hampshire to the west, Berkshire to the northwest, and Greater London to the northeast.
England is a country that is part of the United Kingdom. It shares land borders with Wales to the west and Scotland to the north-northwest. The Irish Sea lies west of England and the Celtic Sea lies to the southwest. England is separated from continental Europe by the North Sea to the east and the English Channel to the south. The country covers five-eighths of the island of Great Britain, which lies in the North Atlantic, and includes over 100 smaller islands, such as the Isles of Scilly and the Isle of Wight.
Before the election an alliance between the Liberal Democrats and the Labour party ran the council, with the Conservatives needing to make four gains to win a majority. [4]
The Liberal Democrats are a liberal, centrist political party in the United Kingdom. They presently have 11 Members of Parliament in the House of Commons, 96 members of the House of Lords, and one member of the European Parliament. They also have five Members of the Scottish Parliament and a member each in the Welsh Assembly and London Assembly. The party reached the height of its influence in the early 2010s, forming a junior partner in a coalition government from 2010 to 2015. It is presently led by Vince Cable.
The Labour Party is a centre-left political party in the United Kingdom which has been described as an alliance of social democrats, democratic socialists and trade unionists. The party's platform emphasises greater state intervention, social justice and strengthening workers' rights. Labour is a full member of the Party of European Socialists and Progressive Alliance, and holds observer status in the Socialist International. As of 2017, the party was considered the "largest party in Western Europe" in terms of party membership, with more than half a million members.
The Conservatives gained a majority with the leader of the Labour group, Dick Moran, among those to be defeated at the election. [5]
Party | Seats | Gains | Losses | Net gain/loss | Seats % | Votes % | Votes | +/− | |
---|---|---|---|---|---|---|---|---|---|
Conservative | 29 | +11 | 69.0 | ||||||
Liberal Democrat | 10 | -7 | 23.8 | ||||||
Labour | 3 | -4 | 7.1 |
Party | Candidate | Votes | % | ± | |
---|---|---|---|---|---|
Conservative | Marian Myland | 1,146 | 62.5 | ||
Conservative | Tony Elias | 1,120 | |||
Conservative | Sally Herrtage | 1,088 | |||
Liberal Democrat | Brian Martin | 534 | 29.1 | ||
Liberal Democrat | Richard Fowler | 483 | |||
Liberal Democrat | Nielsen N. | 457 | |||
Labour | Maxine Mathews | 154 | 8.4 | ||
Majority | 612 | 33.4 | |||
Turnout | 40.7 |
Party | Candidate | Votes | % | ± | |
---|---|---|---|---|---|
Conservative | Robert Jones | 917 | 58.1 | ||
Conservative | Diana Brown | 902 | |||
Conservative | Peter Brown | 898 | |||
Liberal Democrat | Iain Pavely | 662 | 41.9 | ||
Liberal Democrat | John Brock | 616 | |||
Liberal Democrat | Johnston K. | 597 | |||
Majority | 255 | 16.1 | |||
Turnout | 36.9 |
Party | Candidate | Votes | % | ± | |
---|---|---|---|---|---|
Conservative | Ian Chaplin | 436 | 69.0 | ||
Liberal Democrat | Ann Lardeur | 196 | 31.0 | ||
Majority | 240 | 38.0 | |||
Turnout | 632 | 45.2 |
Party | Candidate | Votes | % | ± | |
---|---|---|---|---|---|
Conservative | June Maylam | 718 | 49.9 | ||
Conservative | John Sampson | 693 | |||
Liberal Democrat | Win Weston | 643 | 44.7 | ||
Liberal Democrat | Rob O'Brien | 491 | |||
Labour | Jeffers E. | 78 | 5.4 | ||
Majority | 75 | 5.2 | |||
Turnout | 47.4 |
Party | Candidate | Votes | % | ± | |
---|---|---|---|---|---|
Conservative | Ken Rimmington | 440 | 65.3 | ||
Liberal Democrat | Harry Marsh | 234 | 34.7 | ||
Majority | 206 | 30.6 | |||
Turnout | 674 | 43.8 |
Party | Candidate | Votes | % | ± | |
---|---|---|---|---|---|
Conservative | Angela Goad | 1,093 | 52.5 | ||
Conservative | Chris Hoskins | 909 | |||
Conservative | Linda Samuels | 886 | |||
Liberal Democrat | Elvie Humphreys | 843 | 40.5 | ||
Liberal Democrat | Colin White | 789 | |||
Liberal Democrat | Milner H. | 704 | |||
Labour | Wilbraham D. | 146 | 7.0 | ||
Majority | 250 | 12.0 | |||
Turnout | 43.4 |
Party | Candidate | Votes | % | ± | |
---|---|---|---|---|---|
Conservative | Terry Servant | 865 | 56.8 | ||
Conservative | Stewart Sinclair-Smith | 760 | |||
Liberal Democrat | Anne Hare | 605 | 39.7 | ||
Liberal Democrat | Sakina Bradbury | 505 | |||
Labour | John Ellis | 53 | 3.5 | ||
Labour | Vane C. | 49 | |||
Majority | 260 | 17.1 | |||
Turnout | 50.4 |
Party | Candidate | Votes | % | ± | |
---|---|---|---|---|---|
Conservative | Colin Hall | 813 | 70.4 | ||
Conservative | Eric Morgan | 804 | |||
Liberal Democrat | Martin Caxton | 291 | 25.2 | ||
Liberal Democrat | Mark Wilson | 279 | |||
Labour | Hunter S. | 51 | 4.4 | ||
Majority | 522 | 45.2 | |||
Turnout | 41.4 |
Party | Candidate | Votes | % | ± | |
---|---|---|---|---|---|
Liberal Democrat | Anthony Dalrymple | 890 | 60.0 | ||
Liberal Democrat | Julie Hearn | 814 | |||
Conservative | Michael Sydney | 594 | 40.0 | ||
Conservative | Nicholas Weston | 517 | 40.0 | ||
Majority | 296 | 20.0 | |||
Turnout | 48.5 |
Party | Candidate | Votes | % | ± | |
---|---|---|---|---|---|
Conservative | Gordon Keymer | 1,110 | 48.7 | ||
Conservative | David Weightman | 1,096 | |||
Conservative | Tony Cherrett | 991 | |||
Liberal Democrat | Belinda Ford | 554 | 24.3 | ||
Liberal Democrat | Stuart Paterson | 506 | |||
Independent | Josh Cosnett | 460 | 20.2 | ||
Liberal Democrat | John Curtin | 442 | |||
Labour | Katherine Saunders | 157 | 6.9 | ||
Majority | 556 | 24.4 | |||
Turnout | 44.4 |
Party | Candidate | Votes | % | ± | |
---|---|---|---|---|---|
Labour | Barbara Harling | 1,046 | 40.5 | ||
Labour | Robin Harling | 1,016 | |||
Conservative | Barry Compton | 1,010 | 39.1 | ||
Conservative | Martin Fisher | 997 | |||
Conservative | Elizabeth Parker | 987 | |||
Labour | Marion West | 903 | |||
Liberal Democrat | Ceri Lewis | 322 | 12.5 | ||
UKIP | Anthony Stone | 203 | 7.9 | ||
Majority | 36 | 1.4 | |||
Turnout | 54.6 |
Party | Candidate | Votes | % | ± | |
---|---|---|---|---|---|
Liberal Democrat | Hilary Turner | 642 | 52.7 | ||
Liberal Democrat | Christopher Botten | 610 | |||
Conservative | Randall H. | 482 | 39.6 | ||
Conservative | Hooper C. | 441 | |||
Labour | Allonby R. | 94 | 7.7 | ||
Majority | 160 | 13.1 | |||
Turnout | 39.2 |
Party | Candidate | Votes | % | ± | |
---|---|---|---|---|---|
Conservative | David Hodge | 724 | 49.2 | ||
Conservative | Geoff Barnes | 706 | |||
Liberal Democrat | John Orrick | 648 | 44.0 | ||
Liberal Democrat | David Gosling | 554 | |||
Labour | Victoria Kennedy | 101 | 6.9 | ||
Labour | Dixon P. | 96 | |||
Majority | 76 | 5.2 | |||
Turnout | 52.4 |
Party | Candidate | Votes | % | ± | |
---|---|---|---|---|---|
Conservative | Christina Fry | 486 | 70.1 | ||
Liberal Democrat | John Allbutt | 189 | 27.3 | ||
Labour | Ed Lucas | 18 | 2.6 | ||
Majority | 297 | 42.9 | |||
Turnout | 693 | 47.6 |
Party | Candidate | Votes | % | ± | |
---|---|---|---|---|---|
Labour | Peter Longhurst | 436 | 36.6 | ||
Liberal Democrat | Jill Caudle | 402 | 33.8 | ||
Liberal Democrat | Pennington D. | 369 | |||
Labour | Shiela Batham | 364 | 21.9 | ||
Conservative | Philip Mortimore | 352 | 29.6 | ||
Conservative | Jackie Servant | 347 | |||
Majority | 34 | 2.9 | |||
Turnout | 42.1 |
Party | Candidate | Votes | % | ± | |
---|---|---|---|---|---|
Liberal Democrat | Jeremy Pursehouse | 758 | 43.3 | ||
Liberal Democrat | Ashley Burridge | 749 | |||
Liberal Democrat | Ian Kilpatrick | 714 | |||
Conservative | Darren Giles | 703 | 40.1 | ||
Conservative | Goscomb J. | 653 | |||
Conservative | Margaret Frankcom | 646 | |||
Labour | Garwood J. | 147 | 8.4 | ||
UKIP | Martin Haley | 144 | 8.2 | ||
Majority | 55 | 3.1 | |||
Turnout | 42.8 |
Party | Candidate | Votes | % | ± | |
---|---|---|---|---|---|
Conservative | Richard Allen | 786 | 67.6 | ||
Conservative | Glynis Whittle | 750 | |||
Liberal Democrat | Ray James | 312 | 26.9 | ||
Liberal Democrat | Barry Newsome | 298 | |||
Labour | Robert Jacques | 64 | 5.5 | ||
Majority | 474 | 40.8 | |||
Turnout | 43.3 |
Party | Candidate | Votes | % | ± | |
---|---|---|---|---|---|
Conservative | Steve Altria | 447 | 46.8 | ||
Conservative | Ros Langham | 440 | |||
Labour | Robin Clements | 327 | 34.2 | ||
Labour | Dick Moran | 320 | |||
Liberal Democrat | Jean Pidgeon | 181 | 19.0 | ||
Liberal Democrat | Bob Tomlin | 138 | |||
Majority | 120 | 12.6 | |||
Turnout | 41.3 |
Party | Candidate | Votes | % | ± | |
---|---|---|---|---|---|
Liberal Democrat | Mike Simpson | 526 | 58.0 | ||
Liberal Democrat | Carl Pavey | 510 | |||
Conservative | Morriss J. | 381 | 42.0 | ||
Conservative | Lavery-Downes M. | 341 | |||
Majority | 145 | 16.0 | |||
Turnout | 34.7 |
Party | Candidate | Votes | % | ± | |
---|---|---|---|---|---|
Conservative | Richard Butcher | 644 | 82.2 | ||
Liberal Democrat | Powell E. | 120 | 15.3 | ||
Labour | Provins L. | 19 | 2.4 | ||
Majority | 524 | 66.9 | |||
Turnout | 783 | 49.5 |
The 1998 Adur District Council election took place on 6 May 1999 to elect members of Adur District Council in West Sussex, England. One third of the council was up for election and the Liberal Democrat party lost overall control of the council to no overall control.
The 1999 Craven District Council election took place on 6 May 1999 to elect members of Craven District Council in North Yorkshire, England. One third of the council was up for election and the Conservative party gained overall control of the council from no overall control.
The 2007 Thurrock Council election took place on 3 May 2007 to elect members of Thurrock Council in Essex, England. One third of the council was up for election and the Conservative party lost overall control of the council to no overall control.
The 2008 Tandridge District Council election took place on 1 May 2008 to elect members of Tandridge District Council in Surrey, England. One third of the council was up for election and the Conservative party stayed in overall control of the council.
The 1999 Lichfield District Council election took place on 6 May 1999 to elect members of Lichfield District Council in Staffordshire, England. The whole council was up for election and the Conservative party gained overall control of the council from the Labour party.
The 1999 Worthing Borough Council election took place on 6 May 1999 to elect members of Worthing Borough Council in West Sussex, England. One third of the council was up for election and the Conservative party gained overall control of the council from the Liberal Democrats. Overall turnout was 34.8%.
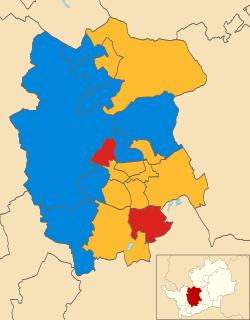
The 2006 St Albans City and District Council election took place on 4 May 2006 to elect members of St Albans District Council in Hertfordshire, England. One third of the council was up for election and the Liberal Democrats gained overall control of the council from no overall control.
The 2007 St Albans City and District Council election took place on 3 May 2007 to elect members of St Albans District Council in Hertfordshire, England. One third of the council was up for election and the Liberal Democrats lost overall control of the council to no overall control.
The 1999 Thurrock Council election took place on 6 May 1999 to elect members of Thurrock Council in Essex, England. One third of the council was up for election and the Labour party stayed in overall control of the council. Overall turnout in the election was 20.0%.
The 2000 Welwyn Hatfield District Council election took place on 6 May 2000 to elect members of Welwyn Hatfield District Council in Hertfordshire, England. One third of the council was up for election and the Labour party gained overall control of the council from no overall control. Overall turnout in the election was 31.71%, down from 33.09% in the 1999 election.
The 2000 Stratford-on-Avon District Council election took place on 4 May 2000 to elect members of Stratford-on-Avon District Council in Warwickshire, England. One third of the council was up for election and the Conservative party gained overall control of the council from no overall control.
The 2000 Southend-on-Sea Council election took place on 4 May 2000 to elect members of Southend-on-Sea Unitary Council in Essex, England. One third of the council was up for election and the Conservative party gained overall control of the council from no overall control.
The 2007 West Lancashire District Council election took place on 3 May 2007 to elect members of West Lancashire District Council in Lancashire, England. One third of the council was up for election and the Conservative party stayed in overall control of the council.
The 2000 Milton Keynes Council election took place on 4 May 2000 to elect members of Milton Keynes Unitary Council in Buckinghamshire, England. One third of the council was up for election and the council stayed under no overall control.
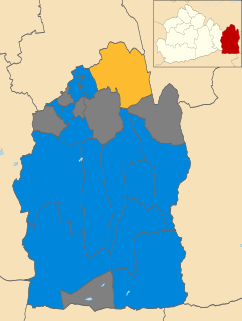
The 2010 Tandridge District Council election took place on 6 May 2010 to elect members of Tandridge District Council in Surrey, England. One third of the council was up for election and the Conservative party stayed in overall control of the council.
The 2011 Tandridge District Council election took place on 5 May 2011 to elect members of Tandridge District Council in Surrey, England. One third of the council was up for election and the Conservative party stayed in overall control of the council.
The 1999 Crawley Borough Council election took place on 6 May 1999 to elect members of Crawley Borough Council in West Sussex, England. One third of the council was up for election and the Labour party stayed in overall control of the council.
The 2006 Brent London Borough Council election took place on 4 May 2006 to elect members of Brent London Borough Council in London, England. The whole council was up for election and the Labour party lost overall control of the council to no overall control.
The 2012 Tandridge District Council election took place on 3 May 2012 to elect members of Tandridge District Council in Surrey, England. One third of the council was up for election and the Conservative party stayed in overall control of the council.
The 2014 Tandridge District Council election took place on 22 May 2014 to elect members of Tandridge District Council in Surrey, England. One third of the council was up for election and the Conservative party stayed in overall control of the council.