1972 United States presidential election in Illinois

Last updated

1972 United States presidential election in Illinois
Flag of Illinois.svg
  1968 November 7, 1972 1976  
Turnout75.99% Decrease2.svg 5.4 pp
  Richard Nixon presidential portrait (1).jpg George McGovern (D-SD) (3x4-1).jpg
Nominee Richard Nixon George McGovern
Party Republican Democratic
Home state California South Dakota
Running mate Spiro Agnew Sargent Shriver
Electoral vote260
Popular vote2,788,1791,913,472
Percentage59.03%40.51%

Illinois Presidential Election Results 1972.svg
County Results

President before election

Richard Nixon
Republican

Elected President

Richard Nixon
Republican

The 1972 United States presidential election in Illinois was held on November 7, 1972 as part of the 1972 United States presidential election. Incumbent President Richard Nixon won the state of Illinois with 59.03 percent of the vote, carrying the state's 26 electoral votes. [1] He defeated his main opponent, Democratic candidate George McGovern in Illinois by a large margin of 18.52%, which still left Illinois 4.63% more Democratic than the nation.

Contents

Nixon won all but one of Illinois’ 102 counties. The solitary exception was Jackson County, home to Southern Illinois University Carbondale, which notably had voted for Nixon in the previous election and was one of six counties outside McGovern’s home state to switch from Republican to Democratic at this election. [lower-alpha 1] [2] Nixon thus became the first Republican to win the White House without carrying this county since Benjamin Harrison in 1888.

This election is the most recent in which Cook County voted Republican, the only Republican victory in St. Clair County since Calvin Coolidge in 1924, [3] and the last until 2016 when Alexander County supported a Republican nominee. [4]

Primaries

The primaries and general elections coincided with those for other federal offices (Senate and House) and those for state offices. [5]

Turnout

Turnout in the primaries was 22.54%, with a total of 1,258,713 votes cast. [5]

Turnout in the general election was 75.99%, with a total of 4,723,236 votes cast. [5] State-run primaries were held for the Democratic and Republican parties on March 21. [5]

Democratic

1972 Illinois Democratic presidential primary
Flag of Illinois.svg
  1968 March 21, 1972 (1972-03-21) 1976  

153 Democratic National Convention delegates
  Edmund Muskie (1).jpg EugeneMcCarthy (1).jpg George McGovern bioguide (1).jpg
Candidate Edmund Muskie Eugene McCarthy George McGovern
Home state Maine Minnesota South Dakota
Delegate count5903
Popular vote766,914444,2603,687
Percentage62.60%36.26%0.30%

The 1972 Illinois Democratic presidential primary was held on March 21, 1972 in the U.S. state of Illinois as one of the Democratic Party's statewide nomination contests ahead of the 1972 presidential election.

The popular vote was a "beauty contest". Delegates were instead selected by direct-vote in each congressional districts on delegate candidates, who had either pledged to support a candidate or been uncommitted. [5]

1972 Democratic presidential primary [5] [6] [7]
CandidateVotes %Delegates[ citation needed ]
Edmund S. Muskie 766,91462.6059
Eugene J. McCarthy 444,26036.260
George Wallace (write-in)7,0170.570
George S. McGovern (write-in)3,6870.303
Hubert H. Humphrey (write-in)1,4760.120
Shirley Chisholm (write-in)7770.060
Henry Jackson (write-in)4420.040
Edward M. Kennedy (write-in)2420.020
John V. Lindsay (write-in)1180.010
Other write-ins2110.020
Uncommitted88
Totals1,225,144100153

Republican

1972 Illinois Republican presidential primary
Flag of Illinois.svg
  1968 March 21, 1972 (1972-03-21) 1976  
  Richard Nixon presidential portrait (1).jpg
Candidate Richard Nixon
Home state California
Popular vote32,550
Percentage96.97%

The 1972 Illinois Republican presidential primary was held on March 21, 1972 in the U.S. state of Illinois as one of the Republican Party's statewide nomination contests ahead of the 1972 presidential election.

In this election, all candidates were write-ins. [5]

The popular vote was a "beauty contest". Delegates were instead selected by direct-vote in each congressional district on delegate candidates, who had either pledged their support to a candidate or indicated their intent to enter the convention uncommitted to any candidate. [5]

1972 Republican presidential primary [5] [6] [7]
CandidateVotes%Delegates
Richard Nixon (write-in)32,55096.97
George Wallace (write-in)5161.54
John Ashbrook (write-in)1700.51
Pete McCloskey (write-in)470.14
Spiro Agnew (write-in)350.10
Other write-ins2510.75
Totals33,569100

Results

1972 United States presidential election in Illinois
PartyCandidatesVotes [5] PercentageElectoral votes
Republican Richard M. Nixon/Spiro T. Agnew 2,788,17959.03%26
Democratic George McGovern/R. Sargent Shriver 1,913,47240.51%0
Socialist Labor Louis Fisher/Genevieve Gunderson12,3440.26%0
Communist Gus Hall/Jarvis Tyner4,5410.10%0
Write-in John Schmitz 2,4710.05%0
Other write-ins2,2290.05%0
Totals4,723,236100.0%26

Results by county

CountyRichard Milhous Nixon
Republican
George Stanley McGovern
Democratic
Louis Fisher
Socialist Labor
Various candidates
Other parties
MarginTotal votes cast [8]
# %# %# %# %# %
Adams 20,73169.46%9,05530.34%570.19%30.01%11,67639.12%29,846
Alexander 2,66951.24%2,48247.65%490.94%90.17%1873.59%5,209
Bond 4,47562.30%2,70437.64%40.06%00.00%1,77124.66%7,183
Boone 7,00368.89%3,13130.80%290.29%20.02%3,87238.09%10,165
Brown 1,78058.90%1,20339.81%361.19%30.10%57719.09%3,022
Bureau 12,78667.47%6,13332.36%220.12%110.06%6,65335.10%18,952
Calhoun 1,70556.51%1,29943.06%130.43%00.00%40613.46%3,017
Carroll 6,04169.99%2,57129.79%180.21%10.01%3,47040.20%8,631
Cass 4,41461.14%2,80338.83%10.01%10.01%1,61122.32%7,219
Champaign 33,70057.43%24,74342.17%970.17%1390.24%8,95715.26%58,679
Christian 10,07256.98%7,55642.75%440.25%30.02%2,51614.23%17,675
Clark 5,70665.74%2,96534.16%80.09%10.01%2,74131.58%8,680
Clay 5,28364.92%2,84434.95%80.10%30.04%2,43929.97%8,138
Clinton 7,93162.39%4,75637.41%150.12%100.08%3,17524.98%12,712
Coles 13,68162.90%7,98836.72%150.07%670.31%5,69326.17%21,751
Cook 1,234,30753.41%1,063,26846.01%7,3280.32%6,1340.27%171,0397.40%2,311,037
Crawford 6,56865.32%3,47734.58%90.09%10.01%3,09130.74%10,055
Cumberland 3,25760.79%2,08338.88%90.17%90.17%1,17421.91%5,358
DeKalb 18,91060.25%12,37539.43%410.13%580.18%6,53520.82%31,384
DeWitt 5,02565.22%2,67234.68%70.09%10.01%2,35330.54%7,705
Douglas 5,84068.66%2,65631.23%80.09%20.02%3,18437.43%8,506
DuPage 172,34175.02%57,04324.83%2970.13%580.03%115,29850.19%229,739
Edgar 7,19564.73%3,88934.99%290.26%30.03%3,30629.74%11,116
Edwards 3,01773.93%1,05525.85%90.22%00.00%1,96248.08%4,081
Effingham 8,75266.34%4,43133.59%70.05%30.02%4,32132.75%13,193
Fayette 6,57461.05%4,19238.93%10.01%10.01%2,38222.12%10,768
Ford 5,65674.51%1,93425.48%10.01%00.00%3,72249.03%7,591
Franklin 10,12154.04%8,54545.62%320.17%310.17%1,5768.41%18,729
Fulton 12,32861.80%7,52937.74%770.39%150.08%4,79924.06%19,949
Gallatin 2,14853.69%1,84446.09%60.15%30.07%3047.60%4,001
Greene 4,67362.13%2,82437.55%230.31%10.01%1,84924.58%7,521
Grundy 8,72570.70%3,58429.04%200.16%120.10%5,14141.66%12,341
Hamilton 3,28261.94%2,00637.86%90.17%20.04%1,27624.08%5,299
Hancock 7,51967.56%3,59232.28%160.14%20.02%3,92735.29%11,129
Hardin 1,91562.54%1,14037.23%60.20%10.03%77525.31%3,062
Henderson 2,68960.62%1,74439.31%20.05%10.02%94521.30%4,436
Henry 14,79663.82%8,36836.09%170.07%40.02%6,42827.72%23,185
Iroquois 11,99576.00%3,72323.59%120.08%520.33%8,27252.41%15,782
Jackson 12,39348.42%13,14651.37%480.19%60.02%-753-2.94%25,593
Jasper 3,46161.18%2,11437.37%80.14%741.31%1,34723.81%5,657
Jefferson 9,44871.55%3,69627.99%500.38%110.08%5,75243.56%13,205
Jersey 5,16460.70%3,31738.99%80.09%180.21%1,84721.71%8,507
Jo Daviess 5,76363.34%3,31836.47%130.14%50.05%2,44526.87%9,099
Johnson 2,82668.54%1,29331.36%40.10%00.00%1,53337.18%4,123
Kane 64,54669.87%27,52529.80%1630.18%1430.15%37,02140.08%92,377
Kankakee 26,86666.54%13,43433.27%540.13%190.05%13,43233.27%40,373
Kendall 9,37378.65%2,52521.19%190.16%00.00%6,84857.46%11,917
Knox 17,31564.69%9,33334.87%600.22%580.22%7,98229.82%26,766
Lake 92,05265.84%47,41633.91%2780.20%660.05%44,63631.93%139,812
LaSalle 31,19059.20%21,40540.63%820.16%100.02%9,78518.57%52,687
Lawrence 5,34765.36%2,81834.45%150.18%10.01%2,52930.91%8,181
Lee 10,63668.67%4,78830.91%120.08%530.34%5,84837.76%15,489
Livingston 13,21772.07%5,11027.86%90.05%30.02%8,10744.21%18,339
Logan 10,27769.95%4,39529.91%180.12%20.01%5,88240.04%14,692
Macon 29,59659.16%20,29640.57%1140.23%230.05%9,30018.59%50,029
Macoupin 13,58358.03%9,66241.28%1470.63%150.06%3,92116.75%23,407
Madison 55,38555.88%43,28943.68%1370.14%3050.31%12,09612.20%99,116
Marion 10,75560.58%6,96839.25%210.12%100.06%3,78721.33%17,754
Marshall 4,45267.43%2,14132.43%80.12%10.02%2,31135.00%6,602
Mason 4,89762.70%2,90137.14%80.10%40.05%1,99625.56%7,810
Massac 4,31369.99%1,83129.71%140.23%40.06%2,48240.28%6,162
McDonough 10,57367.18%5,14332.68%170.11%50.03%5,43034.50%15,738
McHenry 36,11474.75%12,09025.02%880.18%200.04%24,02449.73%48,312
McLean 31,06067.59%14,82432.26%570.12%140.03%16,23635.33%45,955
Menard 3,65769.49%1,58730.15%80.15%110.21%2,07039.33%5,263
Mercer 5,45260.98%3,47738.89%80.09%30.03%1,97522.09%8,940
Monroe 6,47968.44%2,95831.25%240.25%50.05%3,52137.20%9,466
Montgomery 9,02556.71%6,85843.10%270.17%30.02%2,16713.62%15,913
Morgan 11,10366.13%5,67433.80%110.07%10.01%5,42932.34%16,789
Moultrie 3,14357.07%2,35042.67%90.16%50.09%79314.40%5,507
Ogle 13,51273.88%4,74325.93%320.17%30.02%8,76947.94%18,290
Peoria 50,32464.49%27,26434.94%1120.14%3370.43%23,06029.55%78,037
Perry 6,96862.98%4,08436.91%90.08%30.03%2,88426.07%11,064
Piatt 5,05767.72%2,39432.06%160.21%10.01%2,66335.66%7,468
Pike 5,94060.23%3,88339.37%380.39%20.02%2,05720.86%9,863
Pope 1,44064.92%77334.85%40.18%10.05%66730.07%2,218
Pulaski 2,48559.27%1,68340.14%210.50%40.10%80219.13%4,193
Putnam 1,55658.10%1,11241.52%40.15%60.22%44416.58%2,678
Randolph 9,76160.20%6,44039.72%140.09%00.00%3,32120.48%16,215
Richland 5,55868.41%2,55331.42%120.15%20.02%3,00536.98%8,125
Rock Island 37,54853.39%32,52946.25%2270.32%260.04%5,0197.14%70,330
Saline 7,66059.30%5,22640.46%260.20%60.05%2,43418.84%12,918
Sangamon 50,45865.46%25,72033.37%2840.37%6170.80%24,73832.09%77,079
Schuyler 2,99466.03%1,53433.83%20.04%40.09%1,46032.20%4,534
Scott 2,22866.00%1,14533.92%20.06%10.03%1,08332.08%3,376
Shelby 7,21762.08%4,38937.75%170.15%30.03%2,82824.32%11,626
St. Clair 50,51951.50%46,63647.54%8760.89%660.07%3,8833.96%98,097
Stark 2,52971.44%99328.05%80.23%100.28%1,53643.39%3,540
Stephenson 13,58467.86%6,40431.99%240.12%70.03%7,18035.87%20,019
Tazewell 31,93767.08%15,57632.71%830.17%170.04%16,36134.36%47,613
Union 5,03459.36%3,42840.42%160.19%20.02%1,60618.94%8,480
Vermilion 24,86363.06%14,41336.56%700.18%790.20%10,45026.51%39,425
Wabash 4,31068.35%1,98531.48%50.08%60.10%2,32536.87%6,306
Warren 7,02170.15%2,96929.67%150.15%30.03%4,05240.49%10,008
Washington 5,17968.85%2,32730.94%120.16%40.05%2,85237.92%7,522
Wayne 6,40069.75%2,76330.11%100.11%20.02%3,63739.64%9,175
White 6,05262.10%3,67837.74%110.11%50.05%2,37424.36%9,746
Whiteside 17,30568.40%7,90931.26%800.32%70.03%9,39637.14%25,301
Will 65,15565.67%33,63333.90%1850.19%2450.25%31,52231.77%99,218
Williamson 14,10160.02%9,20239.17%120.05%1770.75%4,89920.85%23,492
Winnebago 57,68261.46%35,93738.29%1790.19%520.06%21,74523.17%93,850
Woodford 9,62272.85%3,55826.94%180.14%100.08%6,06445.91%13,208
Totals2,788,17959.03%1,913,47240.51%12,3440.26%9,2410.20%874,70718.52%4,723,236

Counties that flipped from Democratic to Republican

Counties that flipped from Republican to Democratic

Analysis

Nixon's 2,788,179 votes were the most received by a Republican presidential candidate in the state's history. Nixon was the first Republican to win strongly Democratic Macoupin County since 1924 and the first ever to receive a majority there, which thus meant that every antebellum free state county had, as of 1972, given a majority to a Republican presidential candidate at least once. Madison County voted Republican for the first time since 1928.

This was the closest anyone has come to sweeping every Illinois county, making the state along with Kentucky and North Carolina, the only states where no one candidate has ever swept every county in the state's history.

See also

Notes

Related Research Articles

<span class="mw-page-title-main">2004 United States presidential election in Illinois</span>

The 2004 United States presidential election in Illinois took place on November 2, 2004, and was part of the 2004 United States presidential election. Voters chose 21 representatives, or electors to the Electoral College, who voted for president and vice president.

<span class="mw-page-title-main">1972 Democratic Party presidential primaries</span> Selection of the Democratic Party nominee

From January 24 to June 20, 1972, voters of the Democratic Party chose its nominee for president in the 1972 United States presidential election. Senator George McGovern of South Dakota was selected as the nominee through a series of primary elections, caucuses, and state party conventions, culminating in the 1972 Democratic National Convention held from July 10 to July 13, 1972, in Miami, Florida.

<span class="mw-page-title-main">2008 United States presidential election in Illinois</span>

The 2008 United States presidential election in Illinois took place on November 4, 2008, and was part of the 2008 United States presidential election. Voters chose 21 representatives, or electors to the Electoral College, who voted for president and vice president.

<span class="mw-page-title-main">2000 United States presidential election in Illinois</span>

The 2000 United States presidential election in Illinois took place on November 7, 2000, and was part of the 2000 United States presidential election. Voters chose 22 representatives, or electors to the Electoral College, who voted for president and vice president.

<span class="mw-page-title-main">2012 United States presidential election in Illinois</span>

The 2012 United States presidential election in Illinois took place on November 6, 2012, as part of the 2012 United States presidential election in which all 50 states plus the District of Columbia participated. Illinois voters chose 20 electors to represent them in the Electoral College via a popular vote pitting incumbent Democratic President Barack Obama and his running mate, Vice President Joe Biden, against Republican challenger and former Massachusetts Governor Mitt Romney and his running mate, Congressman Paul Ryan. The Obama/Biden ticket won Illinois with 57.50% of the popular vote to Romney/Ryan's 40.66%, thus winning the state's twenty electoral votes by a margin of 16.84%.

<span class="mw-page-title-main">2012 United States presidential election in Missouri</span> Election in Missouri

The 2012 United States presidential election in Missouri took place on November 6, 2012, as part of the 2012 United States presidential election, in which all 50 states plus the District of Columbia participated. Missouri voters chose 10 electors to represent them in the Electoral College via a popular vote pitting incumbent Democratic President Barack Obama and his running mate, Vice President Joe Biden, against Republican challenger and former Massachusetts Governor Mitt Romney and his running mate, Congressman Paul Ryan.

<span class="mw-page-title-main">1996 United States presidential election in Illinois</span>

The 1996 United States presidential election in Illinois took place on November 5, 1996, as part of the 1996 United States presidential election. Voters chose 22 representatives, or electors to the Electoral College, who voted for president and vice president.

<span class="mw-page-title-main">1992 United States presidential election in Illinois</span>

The 1992 United States presidential election in Illinois took place on November 3, 1992, as part of the 1992 United States presidential election. Voters chose 22 representatives, or electors to the Electoral College, who voted for president and vice president.

<span class="mw-page-title-main">1988 United States presidential election in Illinois</span>

The 1988 United States presidential election in Illinois took place on November 8, 1988. All 50 states and the District of Columbia were part of the 1988 United States presidential election. State voters chose 24 electors to the Electoral College, which selected the president and vice president.

<span class="mw-page-title-main">1984 United States presidential election in Illinois</span>

The 1984 United States presidential election in Illinois took place on November 6, 1984. All 50 states and the District of Columbia, were part of the 1984 United States presidential election. State voters chose 24 electors to the Electoral College, which selected the president and vice president of the United States.

<span class="mw-page-title-main">1980 United States presidential election in Illinois</span>

The 1980 United States presidential election in Illinois took place on November 4, 1980. All 50 states and The District of Columbia, were part of the 1980 United States presidential election. State voters chose 26 electors to the Electoral College, who voted for president and vice president. This would be the last time a Democrat failed to win more than three counties as well as the last time Rock Island County voted Republican, with the county turning sharply to the Democratic party beginning with Reagan's reelection bid and continuing through to the present day.

<span class="mw-page-title-main">2016 United States presidential election in Texas</span> Election in Texas

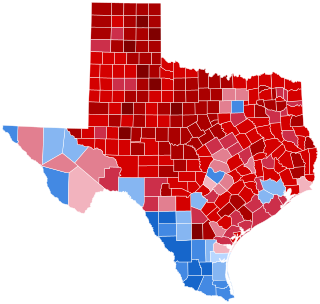
The 2016 United States presidential election in Texas took place on November 8, 2016, as part of the 2016 United States presidential election. Primary elections were held on March 1, 2016.

<span class="mw-page-title-main">2016 United States presidential election in Illinois</span>

The 2016 United States presidential election in Illinois was held on Tuesday, November 8, 2016, as part of the 2016 United States presidential election in which all 50 states plus the District of Columbia participated. Illinois voters chose electors to represent them in the Electoral College via a popular vote, pitting the Republican Party's nominee, businessman Donald Trump, and running mate Indiana Governor Mike Pence against Democratic Party nominee, former Secretary of State Hillary Clinton, and her running mate Virginia Senator Tim Kaine. Illinois had 20 votes in the Electoral College.

<span class="mw-page-title-main">1976 United States presidential election in Illinois</span>

The 1976 United States presidential election in Illinois was held on November 2, 1976. All 50 states and The District of Columbia, were part of the 1976 United States presidential election. State voters chose 26 electors to the Electoral College, who voted for president and vice president.

<span class="mw-page-title-main">1968 United States presidential election in Illinois</span>

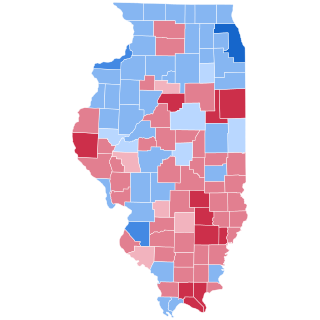
The 1968 United States presidential election in Illinois took place on November 5, 1968, as part of the overall 1968 United States presidential election. Illinois voters selected 26 electors to represent the state in the Electoral College, which would then choose the president and vice president.

<span class="mw-page-title-main">1964 United States presidential election in Illinois</span>

The 1964 United States presidential election in Illinois took place on November 3, 1964, as part of the 1964 United States presidential election. State voters chose 26 representatives, or electors, to the Electoral College, who voted for president and vice president.

<span class="mw-page-title-main">1960 United States presidential election in Illinois</span>

The 1960 United States presidential election in Illinois took place on November 8, 1960, as part of the 1960 United States presidential election. State voters chose 27 representatives, or electors, to the Electoral College, who voted for president and vice president.

<span class="mw-page-title-main">1956 United States presidential election in Illinois</span>

The 1956 United States presidential election in Illinois took place on November 6, 1956, as part of the 1956 United States presidential election. State voters chose 27 representatives, or electors, to the Electoral College, who voted for president and vice president.

<span class="mw-page-title-main">1952 United States presidential election in Illinois</span>

The 1952 United States presidential election in Illinois took place on November 4, 1952, as part of the 1952 United States presidential election. State voters chose 27 representatives, or electors, to the Electoral College, who voted for president and vice president.

<span class="mw-page-title-main">2020 Alabama Republican presidential primary</span>

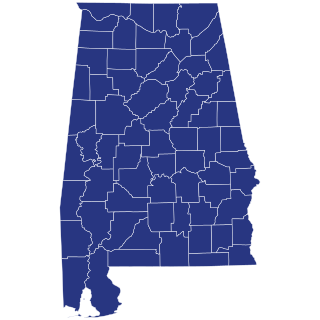
The 2020 Alabama Republican presidential primary took place in Alabama on March 3, 2020, as one of 14 contests scheduled on Super Tuesday in the 2020 Republican Party presidential primaries for the 2020 United States presidential election. The open primary allocated 50 pledged delegates towards the Republican National Convention, distributed with the "winner take most" system of allocating delegates. This system states that a candidate must receive 20% of the vote to receive any delegates statewide or by congressional district, but only if the winner gets less than 50% of the aggregate vote. Should they receive more than 50% of the vote statewide or by congressional district, it becomes winner-take-all.

References

  1. "1972 Presidential General Election Results – Illinois" . Retrieved May 13, 2016.
  2. Menendez, Albert J.; The Geography of Presidential Elections in the United States, 1868-2004, p. 98 ISBN   0786422173
  3. The Political Graveyard; St. Clair County, Illinois
  4. Sullivan, Robert David; ‘How the Red and Blue Map Evolved Over the Past Century’; America Magazine in The National Catholic Review; June 29, 2016
  5. 1 2 3 4 5 6 7 8 9 10 "OFFICIAL VOTE Cast at the GENERAL ELECTION NOVEMBER 7, 1972 JUDICIAL PRIMARY ELECTION GENERAL PRIMARY, MARCH, 21, 1972" (PDF). Illinois State Board of Elections. Retrieved June 26, 2020.[ permanent dead link ]
  6. 1 2 "Late Vote Totals In Illinois Races". The New York Times. March 18, 1976. Retrieved April 2, 2018.
  7. 1 2 "Ford and Carter Amass Delegates in Illinois Races – Georgian Shows Surprising Strength in the Tabulation, Though Stevenson Leads – New Momentum Seen – Reagan, Resisting, Pressed Again to Quit as Gesture Toward Party Unity Ford and Carter Amassing Delegates". The New York Times. March 18, 1976. Retrieved April 2, 2018.
  8. Our Campaigns; IL US President 1972