Colorado's 3rd congressional district

Last updated

Colorado's 3rd congressional district
Interactive map of district boundaries since January 3, 2023. Points indicate the two major cities in the district (Grand Junction in red and Pueblo in blue).
Representative
  Lauren Boebert
RSilt
Distribution
  • 64.75% rural [1]
  • 35.25% urban
Population (2022)731,516 [2]
Median household
income
$67,311 [2]
Ethnicity
Cook PVI R+7 [3]

Colorado's 3rd congressional district is a congressional district in the U.S. state of Colorado. It takes in most of the rural Western Slope in the state's western third portion, with a wing in the south taking in some of the southern portions of the Eastern Plains. It includes the cities of Grand Junction, Durango, Aspen, Glenwood Springs, Ignacio, and Pueblo. The district has been represented by Republican Lauren Boebert since 2021.

Contents

The district was represented from 1987 to 1993 by Ben Nighthorse Campbell before he ran for the U.S. Senate and switched parties from Democratic to Republican. The district's former representative Scott Tipton lost renomination in 2020 to Lauren Boebert in what was considered a major upset. [4] Boebert won the general election on November 3, 2020, and narrowly won re-election in the closest House race of 2022.

The district is mainly rural and leans Republican, though not as much as the neighboring 4th district. However, the Democrats have a strong base in counties on the I-70 corridor and Pueblo, as well as ski towns such as Aspen, thus keeping the seat competitive.

History

1990s

Following the 1990 U.S. census and associated realignment of Colorado congressional districts, the 3rd congressional district consisted of Alamosa, Archuleta, Chaffee, Conejos, Costilla, Delta, Dolores, Eagle, Garfield, Grand, Gunnison, Hinsdale, Huerfano, Jackson, Lake, La Plata, Mesa, Mineral, Moffat, Montezuma, Montrose, Ouray, Park, Pitkin, Pueblo, Rio Blanco, Rio Grande, Routt, Saguache, San Juan, San Miguel, and Summit counties, as well as portions of Douglas, Fremont, and Jefferson counties.

2000s

Following the 2000 U.S. census and realignment of congressional districts, the 3rd congressional district consisted of Alamosa, Archuleta, Conejos, Costilla, Custer, Delta, Dolores, Garfield, Gunnison, Hinsdale, Huerfano, Jackson, La Plata, Las Animas, Mesa, Mineral, Moffat, Montezuma, Montrose, Ouray, Pitkin, Pueblo, Rio Blanco, Rio Grande, Routt, Saguache, San Juan, and San Miguel counties and most of Otero County.

2010s

Following the 2010 U.S. census and realignment of congressional districts, the 3rd congressional district underwent very little change, and continued to cover 27 of the previous counties, excluding Las Animas and Otero counties. [5]

2020s

Following the 2020 U.S. census and realignment of congressional districts, the 3rd congressional district lost Jackson County, Routt County, and most of Eagle County to the 2nd district as well as Custer and Lake counties to the 7th district. It also gained Las Animas and Otero counties from the 4th district. This configuration of the district took effect starting from the 2022 elections.

Characteristics

The district has two major population centers, in Grand Junction and Pueblo. The two cities and their surrounding rural areas provide a competitive arena for congressional races. Grand Junction, on the Western Slope, is a Republican stronghold, while Pueblo, a town with a large Latino population and (by Colorado norms) a heavily unionized workforce, provides a base of support for Democrats.

The Denver Post describes the district as:

The district is red-leaning, and it covers nearly half of Colorado's land mass, including western and southern Colorado, and 29 of the state's 64 counties. It's also diverse, with wealthy ski towns like Aspen, giant swaths of agricultural land and public lands, and middle-class cities like Grand Junction and Pueblo. [6]

Alex Burness, Denver Post (November 3, 2020)

Composition

#CountySeatPopulation
3 Alamosa Alamosa 16,592
7 Archuleta Pagosa Springs 14,003
21 Conejos Conejos 7,579
23 Costilla San Luis 3,603
29 Delta Delta 31,602
33 Dolores Dove Creek 2,455
37 Eagle Eagle 55,285
45 Garfield Glenwood Springs 62,271
51 Gunnison Gunnison 17,267
53 Hinsdale Lake City 775
55 Huerfano Walsenburg 7,082
67 La Plata Durango 56,607
71 Las Animas Trinidad 14,327
77 Mesa Grand Junction 158,636
79 Mineral Creede 931
81 Moffat Craig 13,177
83 Montezuma Cortez 26,468
85 Montrose Montrose 43,811
89 Otero La Junta 18,303
91 Ouray Ouray 5,100
97 Pitkin Aspen 16,876
101 Pueblo Pueblo 169,544
103 Rio Blanco Meeker 6,569
105 Rio Grande Del Norte 11,325
109 Saguache Saguache 6,623
111 San Juan Silverton 803
113 San Miguel Telluride 8,003

Cities of 10,000 people or more

2,500 – 10,000 people

Voting

Election results
YearOfficeResults
2000 President Bush 54% – Al Gore 39%
2004 President Bush 55% – Kerry 44%
2008 President McCain 50% – Obama 47%
2012 President Romney 52% – Obama 46%
2016 President Trump 52% – Clinton 40%
Senate Glenn 50% – Bennet 44%
2018 Governor Stapleton 52% – Polis 48%
2020 President Trump 52% – Biden 46%
Senate Gardner 53% – Hickelooper 45%
2022 Governor Polis 49.5% – Ganahl 47.3%
Senate O'Dea 48.9% - Bennet 47.8%

List of members representing the district

Member
(District home)
PartyTerm durationCong
ress
Electoral historyDistrict location
District created March 4, 1915
Edward Keating.jpg
Edward Keating
(Pueblo)
DemocraticMarch 4, 1915 –
March 3, 1919
64th
65th
Redistricted from the at-large district and re-elected in 1914.
Re-elected in 1916.
Lost re-election.
Guy U. Hardy (Colorado Congressman).jpg
Guy Urban Hardy
(Canon City)
RepublicanMarch 4, 1919 –
March 3, 1933
66th
67th
68th
69th
70th
71st
72nd
Elected in 1918.
Re-elected in 1920.
Re-elected in 1922.
Re-elected in 1924.
Re-elected in 1926.
Re-elected in 1928.
Re-elected in 1930.
Lost re-election.
John A. Martin (Colorado Congressman).jpg
John Andrew Martin
(Pueblo)
DemocraticMarch 4, 1933 –
December 23, 1939
73rd
74th
75th
76th
Elected in 1932.
Re-elected in 1934.
Re-elected in 1936.
Re-elected in 1938.
Died.
VacantDecember 23, 1939 –
November 5, 1940
76th
William E. Burney (Colorado Congressman).jpg
William Evans Burney
(Pueblo)
DemocraticNovember 5, 1940 –
January 3, 1941
76th Elected to finish Martin's term.
Did not run for the next term.
J. Edgar Chenoweth (Colorado Congressman).jpg
J. Edgar Chenoweth
(Trinidad)
RepublicanJanuary 3, 1941–
January 3, 1949
77th
78th
79th
80th
Elected in 1940.
Re-elected in 1942.
Re-elected in 1944.
Re-elected in 1946.
Lost re-election.
John H. Marsalis (Colorado Congressman).jpg
John Henry Marsalis
(Pueblo)
DemocraticJanuary 3, 1949 –
January 3, 1951
81st Elected in 1948.
Lost re-election.
J. Edgar Chenoweth (Colorado Congressman).jpg
J. Edgar Chenoweth
(Trinidad)
RepublicanJanuary 3, 1951 –
January 3, 1965
82nd
83rd
84th
85th
86th
87th
88th
Re-elected in 1950.
Re-elected in 1952.
Re-elected in 1954.
Re-elected in 1956.
Re-elected in 1958.
Re-elected in 1960.
Re-elected in 1962.
Lost re-election.
Frank Edward Evans.jpg
Frank Evans
(Pueblo)
DemocraticJanuary 3, 1965 –
January 3, 1979
89th
90th
91st
92nd
93rd
94th
95th
Elected in 1964.
Re-elected in 1966.
Re-elected in 1968.
Re-elected in 1970.
Re-elected in 1972.
Re-elected in 1974.
Re-elected in 1976.
Retired.
Raymond P. Kogovsek.png
Ray Kogovsek
(Pueblo)
DemocraticJanuary 3, 1979 –
January 3, 1985
96th
97th
98th
Elected in 1978.
Re-elected in 1980.
Re-elected in 1982.
Retired.
Michael L. Strang.jpg
Mike Strang
(Carbondale)
RepublicanJanuary 3, 1985 –
January 3, 1987
99th Elected in 1984.
Lost re-election.
Ben Campbell.jpg
Ben Nighthorse Campbell
(Ignacio)
DemocraticJanuary 3, 1987 –
January 3, 1993
100th
101st
102nd
Elected in 1986.
Re-elected in 1988.
Re-elected in 1990.
Retired to run for U.S. senator.
Scottmcinnis.jpg
Scott McInnis
(Glenwood Springs)
RepublicanJanuary 3, 1993 –
January 3, 2005
103rd
104th
105th
106th
107th
108th
Elected in 1992.
Re-elected in 1994.
Re-elected in 1996.
Re-elected in 1998.
Re-elected in 2000.
Re-elected in 2002.
Retired.
1993–2003
[ data missing ]
2003–2013
US-Congressional-District-CO-3.PNG
Rep John Salazar.jpg
John Salazar
(Manassa)
DemocraticJanuary 3, 2005 –
January 3, 2011
109th
110th
111th
Elected in 2004.
Re-elected in 2006.
Re-elected in 2008.
Lost re-election.
Scott Tipton official photo.jpg
Scott Tipton
(Cortez)
RepublicanJanuary 3, 2011 –
January 3, 2021
112th
113th
114th
115th
116th
Elected in 2010.
Re-elected in 2012.
Re-elected in 2014.
Re-elected in 2016.
Re-elected in 2018.
Lost renomination.
2013–2023
Colorado US Congressional District 3 (since 2013).tif
Lauren Boebert 117th U.S Congress.jpg
Lauren Boebert
(Silt)
RepublicanJanuary 3, 2021 –
present
117th
118th
Elected in 2020.
Re-elected in 2022.
Moved to run in the 4th district.
2023–present
Colorado's 3rd congressional district (since 2023) (new version).svg

Election results

19141916191819201922192419261928193019321934193619381940 (Special)194019421944194619481950195219541956195819601962196419661968197019721974197619781980198219841986198819901992199419961998200020022004200620082010201220142016201820202022

1914

1914 United States House of Representatives elections [7]
PartyCandidateVotes%
Democratic Edward Keating 37,191 53%
Republican Neil N. McLean32,56747%
Total votes69,758 100%
Democratic win (new seat)

1916

1916 United States House of Representatives elections [8]
PartyCandidateVotes%
Democratic Edward Keating (Incumbent) 40,183 54%
Republican George E. McClelland31,13742%
Socialist David McGrew2,4923%
Progressive William G. Francis4431%
Total votes74,255 100%
Democratic hold

1918

1918 United States House of Representatives elections [9]
PartyCandidateVotes%
Republican Guy U. Hardy 31,715 51%
Democratic Edward Keating (Incumbent)29,07547%
Socialist Edith Halcomb1,4532%
Total votes62,243 100%
Republican gain from Democratic

1920

1920 United States House of Representatives elections [10]
PartyCandidateVotes%
Republican Guy U. Hardy (Incumbent) 43,426 58%
Democratic Samuel J. Burris31,89642%
Total votes75,322 100%
Republican hold

1922

1922 United States House of Representatives elections [11]
PartyCandidateVotes%
Republican Guy U. Hardy (Incumbent) 43,508 52%
Democratic Chester B. Horn39,50048%
Total votes83,008 100%
Republican hold

1924

1924 United States House of Representatives elections [12]
PartyCandidateVotes%
Republican Guy U. Hardy (Incumbent) 53,877 59%
Democratic Charles B. Hughes37,97641%
Total votes91,853 100%
Republican hold

1926

1926 United States House of Representatives elections [13]
PartyCandidateVotes%
Republican Guy U. Hardy (Incumbent) 46,916 54%
Democratic Edmond I. Crockett40,00946%
Total votes86,925 100%
Republican hold

1928

1928 United States House of Representatives elections [14]
PartyCandidateVotes%
Republican Guy U. Hardy (Incumbent) 64,116 65%
Democratic Harry A. McIntyre34,67035%
Total votes98,786 100%
Republican hold

1930

1930 United States House of Representatives elections [15]
PartyCandidateVotes%
Republican Guy U. Hardy (Incumbent) 55,170 61%
Democratic Guy M. Weybright35,74439%
Total votes90,914 100%
Republican hold

1932

1932 United States House of Representatives elections [16]
PartyCandidateVotes%
Democratic John Andrew Martin 59,882 51%
Republican Guy U. Hardy (Incumbent)57,79349%
Total votes117,675 100%
Democratic gain from Republican

1934

1934 United States House of Representatives elections [17]
PartyCandidateVotes%
Democratic John Andrew Martin (Incumbent) 73,281 64%
Republican W.O. Peterson39,75335%
Socialist Joseph T. Landis1,1991%
Total votes114,233 100%
Democratic hold

1936

1936 United States House of Representatives elections [18]
PartyCandidateVotes%
Democratic John Andrew Martin (Incumbent) 74,013 60%
Republican J. Arthur Phelps48,87140%
Total votes122,884 100%
Democratic hold

1938

1938 United States House of Representatives elections [19]
PartyCandidateVotes%
Democratic John Andrew Martin (Incumbent) 72,736 57%
Republican Henry Leonard54,00743%
Total votes126,743 100%
Democratic hold

1940 (Special)

1940 Colorado's 3rd congressional district special election [20]
PartyCandidateVotes%
Democratic William E. Burney 68,225 51%
Republican Henry Leonard65,67549%
Total votes133,900 100%
Democratic hold

1940

1940 United States House of Representatives elections [21]
PartyCandidateVotes%
Republican John Chenoweth 70,842 52%
Democratic Byron G. Rogers 65,26948%
Total votes136,111 100%
Republican gain from Democratic

1942

1942 United States House of Representatives elections [22]
PartyCandidateVotes%
Republican John Chenoweth (Incumbent) 55,838 63%
Democratic J.C. Jarrett33,15437%
Total votes88,992 100%
Republican hold

1944

1944 United States House of Representatives elections [23]
PartyCandidateVotes%
Republican John Chenoweth (Incumbent) 69,492 56%
Democratic Arthur M. Wimmell53,90444%
Total votes123,396 100%
Republican hold

1946

1946 United States House of Representatives elections [24]
PartyCandidateVotes%
Republican John Chenoweth (Incumbent) 45,043 55%
Democratic Walter Walford Johnson 37,49645%
Total votes82,539 100%
Republican hold

1948

1948 United States House of Representatives elections [25]
PartyCandidateVotes%
Democratic John H. Marsalis 65,114 51%
Republican John Chenoweth (Incumbent)63,31249%
Total votes128,426 100%
Democratic gain from Republican

1950

1950 United States House of Representatives elections [26]
PartyCandidateVotes%
Republican John Chenoweth 58,831 52%
Democratic John H. Marsalis (Incumbent)55,11048%
Total votes113,941 100%
Republican gain from Democratic

1952

1952 United States House of Representatives elections [27]
PartyCandidateVotes%
Republican John Chenoweth (Incumbent) 84,739 58%
Democratic John H. Marsalis 62,02542%
Total votes146,764 100%
Republican hold

1954

1954 United States House of Representatives elections [28]
PartyCandidateVotes%
Republican John Chenoweth (Incumbent) 62,884 53%
Democratic Alva B. Adams Jr.55,75047%
Total votes118,634 100%
Republican hold

1956

1956 United States House of Representatives elections [29]
PartyCandidateVotes%
Republican John Chenoweth (Incumbent) 74,196 50%
Democratic Alva B. Adams Jr.73,50150%
Total votes147,697 100%
Republican hold

1958

1958 United States House of Representatives elections [30]
PartyCandidateVotes%
Republican John Chenoweth (Incumbent) 63,655 50%
Democratic Fred M. Betz63,11250%
Total votes126,767 100%
Republican hold

1960

1960 United States House of Representatives elections [31]
PartyCandidateVotes%
Republican John Chenoweth (Incumbent) 85,825 52%
Democratic Franklin R. Stewart79,06948%
Total votes164,894 100%
Republican hold

1962

1962 United States House of Representatives elections [32]
PartyCandidateVotes%
Republican John Chenoweth (Incumbent) 74,848 55%
Democratic Albert "Al" Tomsic62,09745%
Total votes136,945 100%
Republican hold

1964

1964 United States House of Representatives elections [33]
PartyCandidateVotes%
Democratic Frank Evans 85,404 51%
Republican John Chenoweth (Incumbent)81,54449%
Total votes166,948 100%
Democratic gain from Republican

1966

1966 United States House of Representatives elections [34]
PartyCandidateVotes%
Democratic Frank Evans (Incumbent) 76,270 52%
Republican David W. Enoch71,21348%
Total votes147,483 100%
Democratic hold

1968

1968 United States House of Representatives elections [35]
PartyCandidateVotes%
Democratic Frank Evans (Incumbent) 88,368 52%
Republican Paul Bradley81,16348%
Total votes169,531 100%
Democratic hold

1970

1970 United States House of Representatives elections [36]
PartyCandidateVotes%
Democratic Frank Evans (Incumbent) 87,000 64%
Republican John "Jack" Mitchell Jr.45,61033%
Raza Unida Martin P. Serna1,8281%
Peace IndependentWalter Cranson1,5981%
American Independent Henry John Olshaw6521%
Total votes136,688 100%
Democratic hold

1972

1972 United States House of Representatives elections [37]
PartyCandidateVotes%
Democratic Frank Evans (Incumbent) 107,511 66%
Republican Chuck Brady54,55634%
Total votes162,067 100%
Democratic hold

1974

1974 United States House of Representatives elections [38]
PartyCandidateVotes%
Democratic Frank Evans (Incumbent) 91,783 68%
Republican E. Keith Records43,29832%
Total votes135,081 100%
Democratic hold

1976

1976 United States House of Representatives elections [39]
PartyCandidateVotes%
Democratic Frank Evans (Incumbent) 89,302 51%
Republican Melvin Takaki82,31547%
Raza Unida Alfredo Archer2,4291%
American Independent Henry John Olshaw1,1861%
Total votes175,232 100%
Democratic hold

1978

1978 United States House of Representatives elections [40]
PartyCandidateVotes%
Democratic Raymond P. Kogovsek 69,669 49%
Republican Harold L. McCormick69,30349%
American Independent Henry John Olshaw2,4752%
Total votes141,447 100%
Democratic hold

1980

1980 United States House of Representatives elections [41]
PartyCandidateVotes%
Democratic Raymond P. Kogovsek (Incumbent) 105,820 55%
Republican Harold L. McCormick84,29244%
Libertarian James S. Glennie2,6701%
Total votes192,782 100%
Democratic hold

1982

1982 United States House of Representatives elections [42]
PartyCandidateVotes%
Democratic Raymond P. Kogovsek (Incumbent) 92,384 53%
Republican Tom Wiena77,40945%
Libertarian Paul "Stormy" Mohn2,4391%
Independent Henry John Olshaw6561%
Total votes172,888 100%
Democratic hold

1984

1984 United States House of Representatives elections [43]
PartyCandidateVotes%
Republican Michael L. Strang 122,669 57%
Democratic W. Mitchell90,96342%
Libertarian Robert Jahelka1,3580.5%
Independent Henry John Olshaw8800.5%
Total votes215,870 100%
Republican gain from Democratic

1986

1986 United States House of Representatives elections [44]
PartyCandidateVotes%
Democratic Ben Nighthorse Campbell 95,353 52%
Republican Michael L. Strang (Incumbent)88,50848%
Total votes183,861 100%
Democratic gain from Republican

1988

1988 United States House of Representatives elections [45]
PartyCandidateVotes%
Democratic Ben Nighthorse Campbell (Incumbent) 169,284 78%
Republican Jim Zartman47,62522%
Total votes216,909 100%
Democratic hold

1990

1990 United States House of Representatives elections [46]
PartyCandidateVotes%
Democratic Ben Nighthorse Campbell (Incumbent) 124,487 70%
Republican Bob Ellis49,96128%
Populist Howard E. Fields2,8592%
Total votes177,307 100%
Democratic hold

1992

1992 United States House of Representatives elections [47]
PartyCandidateVotes%
Republican Scott McInnis 143,293 55%
Democratic Mike Callihan 114,48044%
Populist Ki R. Nelson4,1891%
Total votes261,962 100%
Republican gain from Democratic

1994

1994 United States House of Representatives elections [48]
PartyCandidateVotes%
Republican Scott McInnis (Incumbent) 145,365 70%
Democratic Linda Powers63,42730%
Total votes208,792 100%
Republican hold

1996

1996 United States House of Representatives elections [49]
PartyCandidateVotes%
Republican Scott McInnis (Incumbent) 183,523 69%
Democratic Albert Gurule 82,95331%
Total votes266,476 100%
Republican hold

1998

1998 United States House of Representatives elections [50]
PartyCandidateVotes%
Republican Scott McInnis (Incumbent) 156,501 66%
Democratic Robert Reed Kelley74,47932%
Libertarian Barry Baggert5,6732%
Total votes236,653 100%
Republican hold

2000

2000 United States House of Representatives elections [51]
PartyCandidateVotes%
Republican Scott McInnis (Incumbent) 199,204 66%
Democratic Curtis Imrie 87,92129%
Libertarian Drew Sakson9,9823%
Reform Victor A. Good5,4332%
Total votes302,540 100%
Republican hold

2002

2002 United States House of Representatives elections [52]
PartyCandidateVotes%
Republican Scott McInnis (Incumbent) 143,433 66%
Democratic Dennis Berckefeldt68,16031%
Libertarian J. Brent Shroyer4,3702%
Natural Law Gary W. Swing1,9030.5%
Write-inJason Alessio1060.05
Total votes217,972 100%
Republican hold

2004

2004 United States House of Representatives elections [53]
PartyCandidateVotes%
Democratic John Salazar 153,500 51%
Republican Greg Walcher141,37647%
UnaffiliatedJim Krug8,7702%
Total votes303,646 100%
Democratic gain from Republican

2006

2006 United States House of Representatives elections [54]
PartyCandidateVotes%
Democratic John Salazar (Incumbent) 146,488 62%
Republican Scott Tipton 86,93037%
Libertarian Bert L. Sargent4,4171%
Green Bruce E. Lohmiller (as a write-in)230%
Total votes237,858 100%
Democratic hold

2008

2008 United States House of Representatives elections [55]
PartyCandidateVotes%
Democratic John Salazar (Incumbent) 203,457 62%
Republican Wayne Wolf 126,76238%
Total votes330,219 100%
Democratic hold

2010

2010 United States House of Representatives elections [56]
PartyCandidateVotes%
Republican Scott Tipton 129,257 50%
Democratic John Salazar (Incumbent)118,04846%
Libertarian Gregory Gilman5,6782%
Independent Jake Segrest4,9822%
Write-inJohn W. Hargis Sr.230.00
Write-inJim Fritz110.00
Total votes257,999 100%
Republican gain from Democratic

2012

2012 United States House of Representatives elections [57]
PartyCandidateVotes%
Republican Scott Tipton (Incumbent) 185,291 53%
Democratic Sal Pace142,61941%
Independent Tisha Casida11,1254%
Libertarian Gregory Gilman4,9822%
Total votes347,247 100%
Republican hold

2014

2014 United States House of Representatives elections [58]
PartyCandidateVotes%
Republican Scott Tipton (Incumbent) 163,011 58%
Democratic Abel Tapia100,36436%
Independent Tisha Casida11,2944%
Libertarian Travis Mero6,4722%
Total votes281,143 100%
Republican hold

2016

2016 United States House of Representatives elections [59]
PartyCandidateVotes%
Republican Scott Tipton (Incumbent) 204,220 54.60%
Democratic Gail Schwartz 150,91440.35%
Libertarian Gaylon Kent18,9035.05%
Total votes374,037 100%
Republican hold

2018

2018 United States House of Representatives elections [60]
PartyCandidateVotes%
Republican Scott Tipton (Incumbent) 173,205 51.52%
Democratic Diane Mitsch Bush 146,42643.55%
Independent Mary Malarsie10,8313.22%
Libertarian Gaylon Kent5,7271.71%
Total votes336,189 100%
Republican hold

2020

2020 United States House of Representatives elections [61]
PartyCandidateVotes%
Republican Lauren Boebert 215,279 51.27%
Democratic Diane Mitsch Bush 190,69545.41%
Libertarian John Keil9,8412.34%
Unity Critter Milton4,1040.98%
Total votes419,919 100%
Republican hold

2022

2022 United States House of Representatives elections [62]
PartyCandidateVotes%
Republican Lauren Boebert (incumbent) 163,839 50.08%
Democratic Adam Frisch 163,29349.92%
Total votes327,132 100%
Republican hold

Historical district boundaries

2003-2013 US-Congressional-District-CO-3.PNG
2003–2013
2013-2023 Colorado US Congressional District 3 (since 2013).tif
2013–2023

See also

Related Research Articles

<span class="mw-page-title-main">Colorado Western Slope</span> Geographic region of the U.S. state of Colorado

The Western Slope is a colloquial term generally understood to describe the part of the state of Colorado west of the Continental Divide. Bodies of water west of the Divide flow toward the Pacific Ocean; water that falls and flows east of the Divide heads east toward the Gulf of Mexico. The Western Slope encompasses about 33% of the state, but has just 10% of the state's residents. The eastern part of the state, including the San Luis Valley and the Front Range, is the more populous portion of the state.

<span class="mw-page-title-main">2006 Colorado gubernatorial election</span>

The 2006 Colorado gubernatorial election was held on November 7, 2006. Incumbent Republican governor Bill Owens was unable to run due to term limits, and the election was won by Democratic nominee Bill Ritter.

<span class="mw-page-title-main">Scott Tipton</span> American politician (born 1956)

Scott Randall Tipton is an American politician who served as the U.S. representative for Colorado's 3rd congressional district from 2011 to 2021. A Republican, he was previously a member of the Colorado House of Representatives from 2009 to 2011. Tipton was first elected to the House in November 2010 when he defeated three-term Democratic incumbent John Salazar, and he was re-elected four times. In 2020, he lost renomination to Republican primary challenger Lauren Boebert in what was considered a major upset.

Colorado's 4th congressional district is a congressional district in the U.S. state of Colorado. Located in the eastern part of the state, the district encompasses most of the rural Eastern Plains as well as portions of the Colorado Front Range including Loveland, Highlands Ranch, Castle Rock, and Parker.

<span class="mw-page-title-main">U.S. Route 50 in Colorado</span> Section of U.S. Highway in Colorado, United States

U.S. Route 50 (US 50) is a part of the U.S. Highway System that travels from West Sacramento, California, to Ocean City, Maryland. In the U.S. state of Colorado, US 50 is a major highway crossing through the lower midsection of the state. It connects the Western Slope with the lower Front Range and the Arkansas Valley. The highway serves the areas of Pueblo and Grand Junction as well as many other smaller areas along its corridor. The long-term project to widen the highway from two lanes to a four lane expressway between Grand Junction and Montrose was completed in January 2005. Only about 25% of the remainder of highway 50 in Colorado is four lane highway.

<span class="mw-page-title-main">2000 United States presidential election in Colorado</span> Election in Colorado

The 2000 United States presidential election in Colorado took place on November 7, 2000, and was part of the 2000 United States presidential election. Voters chose eight representatives, or electors to the Electoral College, who voted for president and vice president.

Colorado district courts are the state trial courts of general jurisdiction in the U.S. state of Colorado.

The Colorado water courts are specialized state courts of the U.S. state of Colorado. There are seven water courts, one in each of Colorado's seven major river basins: South Platte, Arkansas, Rio Grande, Gunnison, Colorado, White, and San Juan. The water courts are divisions of the district courts in that basin.

<span class="mw-page-title-main">Diane Mitsch Bush</span> American politician

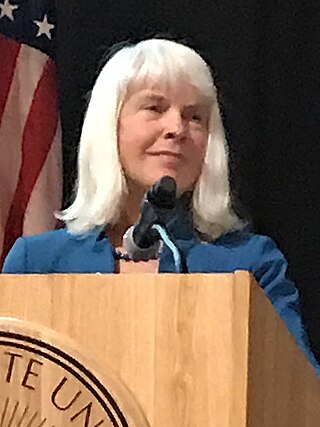
Diane E. Mitsch Bush is an American politician and retired sociology professor who served as a member of the Colorado House of Representatives. She was the Democratic nominee for the U.S. House of Representatives in the 2018 and 2020 elections in Colorado's 3rd congressional district, losing both times.

<span class="mw-page-title-main">1968 United States presidential election in Colorado</span> Election in Colorado

The 1968 United States presidential election in Colorado took place on November 5, 1968, as part of the 1968 United States presidential election. State voters chose six representatives, or electors, to the Electoral College, who voted for president and vice president.

<span class="mw-page-title-main">Donald Valdez</span> American politician

Donald Valdez is an American farmer and politician who served as a member of the Colorado House of Representatives. He represented District 62, which covered portions of Alamosa, Conejos, Costilla, Huerfano, Mineral, Pueblo, Rio Grande, and Saguache counties.

<span class="mw-page-title-main">2020 United States House of Representatives elections in Colorado</span> House elections in Colorado

The 2020 United States House of Representatives elections in Colorado was held on November 3, 2020, to elect the seven U.S. representatives from the state of Colorado, one from each of the state's seven congressional districts. The elections coincided with the 2020 U.S. presidential election, as well as other elections to the House of Representatives, elections to the United States Senate and various state and local elections.

<span class="mw-page-title-main">2022 United States House of Representatives elections in Colorado</span>

The 2022 United States House of Representatives elections in Colorado were held on November 8, 2022, to elect the eight U.S. representatives from the state of Colorado, one from each of the state's eight congressional districts. The elections coincided with the Colorado gubernatorial election, as well as other elections to the U.S. House of Representatives, elections to the U.S. Senate, and various state and local elections.

References

  1. "Congressional Districts Relationship Files (State-based)". U.S. Census Bureau. Archived from the original on April 2, 2013.
  2. 1 2 Center for New Media & Promotion (CNMP), US Census Bureau. "My Congressional District". www.census.gov.
  3. "2022 Cook PVI: District Map and List". Cook Political Report. Retrieved January 10, 2023.
  4. Panetta, Grace. "GOP Congressman Scott Tipton was defeated by right-wing primary challenger Lauren Boebert in Colorado's 3rd congressional district". Business Insider . Archived from the original on July 1, 2020. Retrieved July 1, 2020.
  5. "Colorado Legislative District Information: Congressional District 3" (PDF). Colorado Redistricting.gov. Colorado Independent Redistricting Commission. Retrieved March 17, 2022.
  6. Burness, Alex (November 3, 2020). "Colorado's 3rd Congressional District: Lauren Boebert defeats Diane Mitsch Bush". The Denver Post . Retrieved January 30, 2023.
  7. "Our Campaigns - CO District 3 Race - Nov 03, 1914". www.ourcampaigns.com.
  8. "Our Campaigns - CO District 3 Race - Nov 07, 1916". www.ourcampaigns.com.
  9. "Our Campaigns - CO District 3 Race - Nov 05, 1918". www.ourcampaigns.com.
  10. "1920 Election Results" (PDF).
  11. "1922 Election Results" (PDF).
  12. "1924 Election Results" (PDF).
  13. "1926 Election Results" (PDF).
  14. "1928 Election Results" (PDF).
  15. "1930 Election Results" (PDF).
  16. "1932 Election Results" (PDF).
  17. "1934 Election Results" (PDF).
  18. "1936 Election Results" (PDF).
  19. "1938 Election Results" (PDF).
  20. "Our Campaigns - CO District 3 - Special Election Race - Nov 05, 1940". www.ourcampaigns.com.
  21. "1940 Election Results" (PDF).
  22. "1942 Election Results" (PDF).
  23. "1944 Election Results" (PDF).
  24. "1946 Election Results" (PDF).
  25. "1948 Election Results" (PDF).
  26. "1950 Election Results" (PDF).
  27. "1952 Election Results" (PDF).
  28. "1954 Election Results" (PDF).
  29. "1956 Election Results" (PDF).
  30. "1958 Election Results" (PDF).
  31. "1960 Election Results" (PDF).
  32. "1962 Election Results" (PDF).
  33. "1964 Election Results" (PDF).
  34. "1966 Election Results" (PDF).
  35. "1968 Election Results" (PDF).
  36. "1970 Election Results" (PDF).
  37. "1972 Election Results" (PDF).
  38. "1974 Election Results" (PDF).
  39. "1976 Election Results" (PDF).
  40. "1978 Election Results" (PDF).
  41. "1980 Election Results" (PDF).
  42. "1982 Election Results" (PDF).
  43. "1984 Election Results" (PDF).
  44. "1986 Election Results" (PDF).
  45. "1988 Election Results" (PDF).
  46. "1990 Election Results" (PDF).
  47. "1992 Election Results" (PDF).
  48. "1994 Election Results" (PDF).
  49. "1996 Election Results" (PDF).
  50. "1998 Election Results" (PDF).
  51. "2000 Election Results" (PDF).
  52. "2002 Election Results" (PDF).
  53. "2004 Election Results" (PDF).
  54. "2006 Election Results" (PDF).
  55. "2008 Election Results" (PDF).
  56. "2010 Election Results" (PDF).
  57. "2012 Election Results" (PDF).
  58. "2014 Election Results". Archived from the original on August 22, 2017. Retrieved August 20, 2017.
  59. "2016 Election Results". Archived from the original on August 22, 2017. Retrieved August 20, 2017.
  60. "2018 Colorado general election results" . Retrieved June 21, 2019.
  61. Kim, Cailyn. Lauren Boebert Wins In Colorado's 3rd Congressional District, Colorado Public Radio, November 4, 2020. Retrieved November 7, 2020.
  62. "Representative to the 118th United States Congress - District 3". Colorado Secretary of State. November 26, 2022. Retrieved November 26, 2022.

38°44′36″N107°20′42″W / 38.74333°N 107.34500°W / 38.74333; -107.34500