
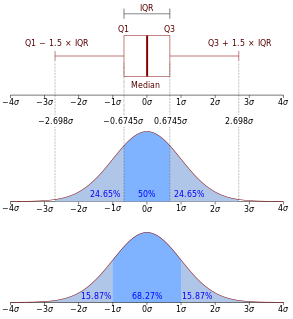
In probability theory and statistics, variance is the expectation of the squared deviation of a random variable from its mean. Informally, it measures how far a set of numbers is spread out from their average value. Variance has a central role in statistics, where some ideas that use it include descriptive statistics, statistical inference, hypothesis testing, goodness of fit, and Monte Carlo sampling. Variance is an important tool in the sciences, where statistical analysis of data is common. The variance is the square of the standard deviation, the second central moment of a distribution, and the covariance of the random variable with itself, and it is often represented by , , or .
In probability theory, a probability density function (PDF), or density of a continuous random variable, is a function whose value at any given sample in the sample space can be interpreted as providing a relative likelihood that the value of the random variable would equal that sample. In other words, while the absolute likelihood for a continuous random variable to take on any particular value is 0, the value of the PDF at two different samples can be used to infer, in any particular draw of the random variable, how much more likely it is that the random variable would equal one sample compared to the other sample.
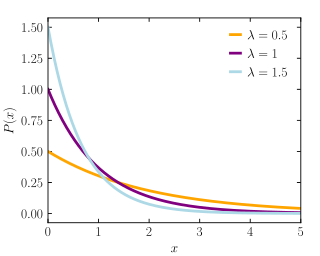
In probability theory and statistics, the exponential distribution is the probability distribution of the time between events in a Poisson point process, i.e., a process in which events occur continuously and independently at a constant average rate. It is a particular case of the gamma distribution. It is the continuous analogue of the geometric distribution, and it has the key property of being memoryless. In addition to being used for the analysis of Poisson point processes it is found in various other contexts.

In probability theory and statistics, the Weibull distribution is a continuous probability distribution. It is named after Swedish mathematician Waloddi Weibull, who described it in detail in 1951, although it was first identified by Fréchet (1927) and first applied by Rosin & Rammler (1933) to describe a particle size distribution.

In mathematics, Jensen's inequality, named after the Danish mathematician Johan Jensen, relates the value of a convex function of an integral to the integral of the convex function. It was proved by Jensen in 1906. Given its generality, the inequality appears in many forms depending on the context, some of which are presented below. In its simplest form the inequality states that the convex transformation of a mean is less than or equal to the mean applied after convex transformation; it is a simple corollary that the opposite is true of concave transformations.
The Laplace–Stieltjes transform, named for Pierre-Simon Laplace and Thomas Joannes Stieltjes, is an integral transform similar to the Laplace transform. For real-valued functions, it is the Laplace transform of a Stieltjes measure, however it is often defined for functions with values in a Banach space. It is useful in a number of areas of mathematics, including functional analysis, and certain areas of theoretical and applied probability.
The Gram–Charlier A series, and the Edgeworth series are series that approximate a probability distribution in terms of its cumulants. The series are the same; but, the arrangement of terms differ. The key idea of these expansions is to write the characteristic function of the distribution whose probability density function f is to be approximated in terms of the characteristic function of a distribution with known and suitable properties, and to recover f through the inverse Fourier transform.
In the theory of stochastic processes, the Karhunen–Loève theorem, also known as the Kosambi–Karhunen–Loève theorem is a representation of a stochastic process as an infinite linear combination of orthogonal functions, analogous to a Fourier series representation of a function on a bounded interval. The transformation is also known as Hotelling transform and eigenvector transform, and is closely related to principal component analysis (PCA) technique widely used in image processing and in data analysis in many fields.

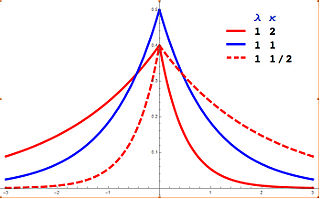
In probability theory and statistics, the Laplace distribution is a continuous probability distribution named after Pierre-Simon Laplace. It is also sometimes called the double exponential distribution, because it can be thought of as two exponential distributions spliced together back-to-back, although the term is also sometimes used to refer to the Gumbel distribution. The difference between two independent identically distributed exponential random variables is governed by a Laplace distribution, as is a Brownian motion evaluated at an exponentially distributed random time. Increments of Laplace motion or a variance gamma process evaluated over the time scale also have a Laplace distribution.
In probability theory and statistics, the noncentral F-distribution is a continuous probability distribution that is a noncentral generalization of the (ordinary) F-distribution. It describes the distribution of the quotient (X/n1)/(Y/n2), where the numerator X has a noncentral chi-squared distribution with n1 degrees of freedom and the denominator Y has a central chi-squared distribution with n2 degrees of freedom. It is also required that X and Y are statistically independent of each other.
In statistics and information theory, a maximum entropy probability distribution has entropy that is at least as great as that of all other members of a specified class of probability distributions. According to the principle of maximum entropy, if nothing is known about a distribution except that it belongs to a certain class, then the distribution with the largest entropy should be chosen as the least-informative default. The motivation is twofold: first, maximizing entropy minimizes the amount of prior information built into the distribution; second, many physical systems tend to move towards maximal entropy configurations over time.
In probability theory the hypoexponential distribution or the generalized Erlang distribution is a continuous distribution, that has found use in the same fields as the Erlang distribution, such as queueing theory, teletraffic engineering and more generally in stochastic processes. It is called the hypoexponetial distribution as it has a coefficient of variation less than one, compared to the hyper-exponential distribution which has coefficient of variation greater than one and the exponential distribution which has coefficient of variation of one.
In Bayesian probability, the Jeffreys prior, named after Sir Harold Jeffreys, is a non-informative (objective) prior distribution for a parameter space; its density function is proportional to the square root of the determinant of the Fisher information matrix:
Differential entropy is a concept in information theory that began as an attempt by Shannon to extend the idea of (Shannon) entropy, a measure of average surprisal of a random variable, to continuous probability distributions. Unfortunately, Shannon did not derive this formula, and rather just assumed it was the correct continuous analogue of discrete entropy, but it is not. The actual continuous version of discrete entropy is the limiting density of discrete points (LDDP). Differential entropy is commonly encountered in the literature, but it is a limiting case of the LDDP, and one that loses its fundamental association with discrete entropy.
A ratio distribution is a probability distribution constructed as the distribution of the ratio of random variables having two other known distributions. Given two random variables X and Y, the distribution of the random variable Z that is formed as the ratio Z = X/Y is a ratio distribution.
In mathematics, the Łukaszyk–Karmowski metric is a function defining a distance between two random variables or two random vectors. This function is not a metric as it does not satisfy the identity of indiscernibles condition of the metric, that is for two identical arguments its value is greater than zero. The concept is named after Szymon Łukaszyk and Wojciech Karmowski.

In probability theory and directional statistics, a wrapped exponential distribution is a wrapped probability distribution that results from the "wrapping" of the exponential distribution around the unit circle.
In probability theory and statistics, the noncentral beta distribution is a continuous probability distribution that is a noncentral generalization of the (central) beta distribution.
In the theory of renewal processes, a part of the mathematical theory of probability, the residual time or the forward recurrence time is the time between any given time and the next epoch of the renewal process under consideration. In the context of random walks, it is also known as overshoot. Another way to phrase residual time is "how much more time is there to wait?".
In probability theory and statistics, the asymmetric Laplace distribution (ALD) is a continuous probability distribution which is a generalization of the Laplace distribution. Just as the Laplace distribution consists of two exponential distributions of equal scale back-to-back about x = m, the asymmetric Laplace consists of two exponential distributions of unequal scale back to back about x = m, adjusted to assure continuity and normalization. The difference of two variates exponentially distributed with different means and rate parameters will be distributed according to the ALD. When the two rate parameters are equal, the difference will be distributed according to the Laplace distribution.


