Voigt profile

Last updated
(Centered) Voigt
Probability density function
VoigtPDF.svg
Plot of the centered Voigt profile for four cases. Each case has a full width at half-maximum of very nearly 3.6. The black and red profiles are the limiting cases of the Gaussian (γ =0) and the Lorentzian (σ =0) profiles respectively.
Cumulative distribution function
VoigtCDF.svg
Parameters
Support
PDF
CDF (complicated - see text)
Mean (not defined)
Median
Mode
Variance (not defined)
Skewness (not defined)
Excess kurtosis (not defined)
MGF (not defined)
CF

The Voigt profile (named after Woldemar Voigt) is a probability distribution given by a convolution of a Cauchy-Lorentz distribution and a Gaussian distribution. It is often used in analyzing data from spectroscopy or diffraction.

Contents

Definition

Without loss of generality, we can consider only centered profiles, which peak at zero. The Voigt profile is then

where x is the shift from the line center, is the centered Gaussian profile:

and is the centered Lorentzian profile:

The defining integral can be evaluated as:

where Re[w(z)] is the real part of the Faddeeva function evaluated for

In the limiting cases of and then simplifies to and , respectively.

History and applications

In spectroscopy, a Voigt profile results from the convolution of two broadening mechanisms, one of which alone would produce a Gaussian profile (usually, as a result of the Doppler broadening), and the other would produce a Lorentzian profile. Voigt profiles are common in many branches of spectroscopy and diffraction. Due to the expense of computing the Faddeeva function, the Voigt profile is sometimes approximated using a pseudo-Voigt profile.

Properties

The Voigt profile is normalized:

since it is a convolution of normalized profiles. The Lorentzian profile has no moments (other than the zeroth), and so the moment-generating function for the Cauchy distribution is not defined. It follows that the Voigt profile will not have a moment-generating function either, but the characteristic function for the Cauchy distribution is well defined, as is the characteristic function for the normal distribution. The characteristic function for the (centered) Voigt profile will then be the product of the two:

Since normal distributions and Cauchy distributions are stable distributions, they are each closed under convolution (up to change of scale), and it follows that the Voigt distributions are also closed under convolution.

Cumulative distribution function

Using the above definition for z , the cumulative distribution function (CDF) can be found as follows:

Substituting the definition of the Faddeeva function (scaled complex error function) yields for the indefinite integral:

which may be solved to yield

where is a hypergeometric function. In order for the function to approach zero as x approaches negative infinity (as the CDF must do), an integration constant of 1/2 must be added. This gives for the CDF of Voigt:

The uncentered Voigt profile

If the Gaussian profile is centered at and the Lorentzian profile is centered at , the convolution is centered at and the characteristic function is:

The probability density function is simply offset from the centered profile by :

where:

The mode and median are both located at .

Derivatives

A Voigt profile (here, assuming
m
V
=
10
{\displaystyle \mu _{V}=10}
,
s
=
1.3
{\displaystyle \sigma =1.3}
, and
g
=
2.5
{\displaystyle \gamma =2.5}
) and its first two partial derivatives with respect to
x
{\displaystyle x}
(the first column) and the three parameters
m
V
{\displaystyle \mu _{V}}
,
s
{\displaystyle \sigma }
, and
g
{\displaystyle \gamma }
(the second, third, and fourth column, respectively), obtained analytically and numerically. Voigt PartialDerivatives.png
A Voigt profile (here, assuming , , and ) and its first two partial derivatives with respect to (the first column) and the three parameters , , and (the second, third, and fourth column, respectively), obtained analytically and numerically.

Using the definition above for and , the first and second derivatives can be expressed in terms of the Faddeeva function as

and

respectively.

Often, one or multiple Voigt profiles and/or their respective derivatives need to be fitted to a measured signal by means of non-linear least squares, e.g., in spectroscopy. Then, further partial derivatives can be utilised to accelerate computations. Instead of approximating the Jacobian matrix with respect to the parameters , , and with the aid of finite differences, the corresponding analytical expressions can be applied. With and , these are given by:

for the original voigt profile ;

for the first order partial derivative ; and

for the second order partial derivative . Since and play a relatively similar role in the calculation of , their respective partial derivatives also look quite similar in terms of their structure, although they result in totally different derivative profiles. Indeed, the partial derivatives with respect to and show more similarity since both are width parameters. All these derivatives involve only simple operations (multiplications and additions) because the computationally expensive and are readily obtained when computing . Such a reuse of previous calculations allows for a derivation at minimum costs. This is not the case for finite difference gradient approximation as it requires the evaluation of for each gradient respectively.

Voigt functions

The Voigt functions [1] U, V, and H (sometimes called the line broadening function) are defined by

where

erfc is the complementary error function, and w(z) is the Faddeeva function.

Relation to Voigt profile

with Gaussian sigma relative variables and

Numeric approximations

Tepper-García Function

The Tepper-García function, named after German-Mexican Astrophysicist Thor Tepper-García, is a combination of an exponential function and rational functions that approximates the line broadening function over a wide range of its parameters. [2] It is obtained from a truncated power series expansion of the exact line broadening function.

In its most computationally efficient form, the Tepper-García function can be expressed as

where , , and .

Thus the line broadening function can be viewed, to first order, as a pure Gaussian function plus a correction factor that depends linearly on the microscopic properties of the absorbing medium (encoded in ); however, as a result of the early truncation in the series expansion, the error in the approximation is still of order , i.e. . This approximation has a relative accuracy of

over the full wavelength range of , provided that . In addition to its high accuracy, the function is easy to implement as well as computationally fast. It is widely used in the field of quasar absorption line analysis. [3]

Pseudo-Voigt approximation

The pseudo-Voigt profile (or pseudo-Voigt function) is an approximation of the Voigt profile V(x) using a linear combination of a Gaussian curve G(x) and a Lorentzian curve L(x) instead of their convolution.

The pseudo-Voigt function is often used for calculations of experimental spectral line shapes.

The mathematical definition of the normalized pseudo-Voigt profile is given by

with .

is a function of full width at half maximum (FWHM) parameter.

There are several possible choices for the parameter. [4] [5] [6] [7] A simple formula, accurate to 1%, is [8] [9]

where now, is a function of Lorentz (), Gaussian () and total () Full width at half maximum (FWHM) parameters. The total FWHM () parameter is described by:

The width of the Voigt profile

The full width at half maximum (FWHM) of the Voigt profile can be found from the widths of the associated Gaussian and Lorentzian widths. The FWHM of the Gaussian profile is

The FWHM of the Lorentzian profile is

An approximate relation (accurate to within about 1.2%) between the widths of the Voigt, Gaussian, and Lorentzian profiles is: [10]

By construction, this expression is exact for a pure Gaussian or Lorentzian.

A better approximation with an accuracy of 0.02% is given by [11] (originally found by Kielkopf [12] )

Again, this expression is exact for a pure Gaussian or Lorentzian. In the same publication, [11] a slightly more precise (within 0.012%), yet significantly more complicated expression can be found.

Related Research Articles

<span class="mw-page-title-main">Normal distribution</span> Probability distribution

In probability theory and statistics, a normal distribution or Gaussian distribution is a type of continuous probability distribution for a real-valued random variable. The general form of its probability density function is

<span class="mw-page-title-main">Pauli matrices</span> Matrices important in quantum mechanics and the study of spin

In mathematical physics and mathematics, the Pauli matrices are a set of three 2 × 2 complex matrices that are Hermitian, involutory and unitary. Usually indicated by the Greek letter sigma, they are occasionally denoted by tau when used in connection with isospin symmetries.

<span class="mw-page-title-main">Fokker–Planck equation</span> Partial differential equation

In statistical mechanics and information theory, the Fokker–Planck equation is a partial differential equation that describes the time evolution of the probability density function of the velocity of a particle under the influence of drag forces and random forces, as in Brownian motion. The equation can be generalized to other observables as well. The Fokker-Planck equation has multiple applications in information theory, graph theory, data science, finance, economics etc.

<span class="mw-page-title-main">Error function</span> Sigmoid shape special function

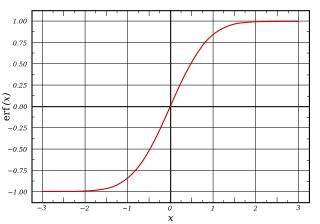
In mathematics, the error function, often denoted by erf, is a function defined as:

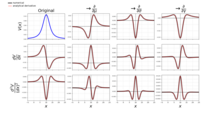
In mathematics, a Gaussian function, often simply referred to as a Gaussian, is a function of the base form

<span class="mw-page-title-main">Rayleigh distribution</span> Probability distribution

In probability theory and statistics, the Rayleigh distribution is a continuous probability distribution for nonnegative-valued random variables. Up to rescaling, it coincides with the chi distribution with two degrees of freedom. The distribution is named after Lord Rayleigh.

<span class="mw-page-title-main">Directional statistics</span>

Directional statistics is the subdiscipline of statistics that deals with directions, axes or rotations in Rn. More generally, directional statistics deals with observations on compact Riemannian manifolds including the Stiefel manifold.

<span class="mw-page-title-main">Confluent hypergeometric function</span> Solution of a confluent hypergeometric equation

In mathematics, a confluent hypergeometric function is a solution of a confluent hypergeometric equation, which is a degenerate form of a hypergeometric differential equation where two of the three regular singularities merge into an irregular singularity. The term confluent refers to the merging of singular points of families of differential equations; confluere is Latin for "to flow together". There are several common standard forms of confluent hypergeometric functions:

<span class="mw-page-title-main">Rice distribution</span> Probability distribution

In probability theory, the Rice distribution or Rician distribution is the probability distribution of the magnitude of a circularly-symmetric bivariate normal random variable, possibly with non-zero mean (noncentral). It was named after Stephen O. Rice (1907–1986).

In Bayesian probability, the Jeffreys prior, named after Sir Harold Jeffreys, is a non-informative prior distribution for a parameter space; its density function is proportional to the square root of the determinant of the Fisher information matrix:

<span class="mw-page-title-main">Chi distribution</span> Probability distribution

In probability theory and statistics, the chi distribution is a continuous probability distribution over the non-negative real line. It is the distribution of the positive square root of a sum of squared independent Gaussian random variables. Equivalently, it is the distribution of the Euclidean distance between a multivariate Gaussian random variable and the origin. It is thus related to the chi-squared distribution by describing the distribution of the positive square roots of a variable obeying a chi-squared distribution.

<span class="mw-page-title-main">Folded normal distribution</span> Probability distribution

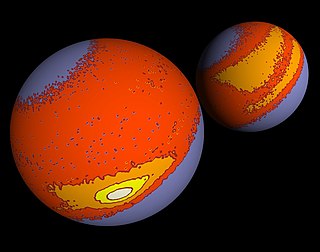
The folded normal distribution is a probability distribution related to the normal distribution. Given a normally distributed random variable X with mean μ and variance σ2, the random variable Y = |X| has a folded normal distribution. Such a case may be encountered if only the magnitude of some variable is recorded, but not its sign. The distribution is called "folded" because probability mass to the left of x = 0 is folded over by taking the absolute value. In the physics of heat conduction, the folded normal distribution is a fundamental solution of the heat equation on the half space; it corresponds to having a perfect insulator on a hyperplane through the origin.

In statistics, the multivariate t-distribution is a multivariate probability distribution. It is a generalization to random vectors of the Student's t-distribution, which is a distribution applicable to univariate random variables. While the case of a random matrix could be treated within this structure, the matrix t-distribution is distinct and makes particular use of the matrix structure.

Expected shortfall (ES) is a risk measure—a concept used in the field of financial risk measurement to evaluate the market risk or credit risk of a portfolio. The "expected shortfall at q% level" is the expected return on the portfolio in the worst of cases. ES is an alternative to value at risk that is more sensitive to the shape of the tail of the loss distribution.

A ratio distribution is a probability distribution constructed as the distribution of the ratio of random variables having two other known distributions. Given two random variables X and Y, the distribution of the random variable Z that is formed as the ratio Z = X/Y is a ratio distribution.

In financial mathematics, tail value at risk (TVaR), also known as tail conditional expectation (TCE) or conditional tail expectation (CTE), is a risk measure associated with the more general value at risk. It quantifies the expected value of the loss given that an event outside a given probability level has occurred.

<span class="mw-page-title-main">Half-normal distribution</span> Probability distribution

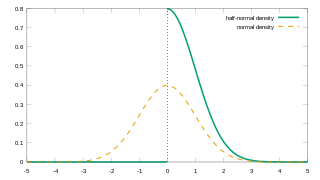
In probability theory and statistics, the half-normal distribution is a special case of the folded normal distribution.

<span class="mw-page-title-main">Normal-inverse-gamma distribution</span>

In probability theory and statistics, the normal-inverse-gamma distribution is a four-parameter family of multivariate continuous probability distributions. It is the conjugate prior of a normal distribution with unknown mean and variance.

A product distribution is a probability distribution constructed as the distribution of the product of random variables having two other known distributions. Given two statistically independent random variables X and Y, the distribution of the random variable Z that is formed as the product is a product distribution.

<span class="mw-page-title-main">Stable count distribution</span> Probability distribution

In probability theory, the stable count distribution is the conjugate prior of a one-sided stable distribution. This distribution was discovered by Stephen Lihn in his 2017 study of daily distributions of the S&P 500 and the VIX. The stable distribution family is also sometimes referred to as the Lévy alpha-stable distribution, after Paul Lévy, the first mathematician to have studied it.

References

  1. Temme, N. M. (2010), "Voigt function", in Olver, Frank W. J.; Lozier, Daniel M.; Boisvert, Ronald F.; Clark, Charles W. (eds.), NIST Handbook of Mathematical Functions , Cambridge University Press, ISBN   978-0-521-19225-5, MR   2723248 .
  2. Tepper-García, Thorsten (2006). "Voigt profile fitting to quasar absorption lines: an analytic approximation to the Voigt-Hjerting function". Monthly Notices of the Royal Astronomical Society. 369 (4): 2025–2035. arXiv: astro-ph/0602124 . Bibcode:2006MNRAS.369.2025T. doi:10.1111/j.1365-2966.2006.10450.x. S2CID   16981310.
  3. List of citations found in the SAO/NASA Astrophysics Data System (ADS): https://ui.adsabs.harvard.edu/abs/2006MNRAS.369.2025T/citations
  4. Wertheim GK, Butler MA, West KW, Buchanan DN (1974). "Determination of the Gaussian and Lorentzian content of experimental line shapes". Review of Scientific Instruments. 45 (11): 1369–1371. Bibcode:1974RScI...45.1369W. doi:10.1063/1.1686503.
  5. Sánchez-Bajo, F.; F. L. Cumbrera (August 1997). "The Use of the Pseudo-Voigt Function in the Variance Method of X-ray Line-Broadening Analysis". Journal of Applied Crystallography. 30 (4): 427–430. doi:10.1107/S0021889896015464.
  6. Liu Y, Lin J, Huang G, Guo Y, Duan C (2001). "Simple empirical analytical approximation to the Voigt profile". JOSA B. 18 (5): 666–672. Bibcode:2001JOSAB..18..666L. doi:10.1364/josab.18.000666.
  7. Di Rocco HO, Cruzado A (2012). "The Voigt Profile as a Sum of a Gaussian and a Lorentzian Functions, when the Weight Coefficient Depends Only on the Widths Ratio". Acta Physica Polonica A. 122 (4): 666–669. Bibcode:2012AcPPA.122..666D. doi: 10.12693/APhysPolA.122.666 . ISSN   0587-4246.
  8. Ida T, Ando M, Toraya H (2000). "Extended pseudo-Voigt function for approximating the Voigt profile". Journal of Applied Crystallography. 33 (6): 1311–1316. doi:10.1107/s0021889800010219. S2CID   55372305.
  9. P. Thompson, D. E. Cox and J. B. Hastings (1987). "Rietveld refinement of Debye-Scherrer synchrotron X-ray data from Al2O3". Journal of Applied Crystallography. 20 (2): 79–83. doi:10.1107/S0021889887087090.
  10. Whiting, E. E. (June 1968). "An empirical approximation to the Voigt profile". Journal of Quantitative Spectroscopy and Radiative Transfer. 8 (6): 1379–1384. Bibcode:1968JQSRT...8.1379W. doi:10.1016/0022-4073(68)90081-2. ISSN   0022-4073.
  11. 1 2 Olivero, J. J.; R. L. Longbothum (February 1977). "Empirical fits to the Voigt line width: A brief review". Journal of Quantitative Spectroscopy and Radiative Transfer. 17 (2): 233–236. Bibcode:1977JQSRT..17..233O. doi:10.1016/0022-4073(77)90161-3. ISSN   0022-4073.
  12. John F. Kielkopf (1973), "New approximation to the Voigt function with applications to spectral-line profile analysis", Journal of the Optical Society of America, 63 (8): 987, Bibcode:1973JOSA...63..987K, doi:10.1364/JOSA.63.000987