Related Research Articles
Econometrics is the application of statistical methods to economic data in order to give empirical content to economic relationships. More precisely, it is "the quantitative analysis of actual economic phenomena based on the concurrent development of theory and observation, related by appropriate methods of inference". An introductory economics textbook describes econometrics as allowing economists "to sift through mountains of data to extract simple relationships". The first known use of the term "econometrics" was by Polish economist Paweł Ciompa in 1910. Jan Tinbergen is considered by many to be one of the founding fathers of econometrics. Ragnar Frisch is credited with coining the term in the sense in which it is used today.
Multivariate statistics is a subdivision of statistics encompassing the simultaneous observation and analysis of more than one outcome variable. The application of multivariate statistics is multivariate analysis.

Statistics is the discipline that concerns the collection, organization, analysis, interpretation and presentation of data. In applying statistics to a scientific, industrial, or social problem, it is conventional to begin with a statistical population or a statistical model to be studied. Populations can be diverse groups of people or objects such as "all people living in a country" or "every atom composing a crystal". Statistics deals with every aspect of data, including the planning of data collection in terms of the design of surveys and experiments. See glossary of probability and statistics.

Statistical inference is the process of using data analysis to deduce properties of an underlying distribution of probability. Inferential statistical analysis infers properties of a population, for example by testing hypotheses and deriving estimates. It is assumed that the observed data set is sampled from a larger population.

A meta-analysis is a statistical analysis that combines the results of multiple scientific studies. Meta-analysis can be performed when there are multiple scientific studies addressing the same question, with each individual study reporting measurements that are expected to have some degree of error. The aim then is to use approaches from statistics to derive a pooled estimate closest to the unknown common truth based on how this error is perceived.
In statistics, interval estimation is the use of sample data to calculate an interval of possible values of an unknown population parameter; this is in contrast to point estimation, which gives a single value. Jerzy Neyman (1937) identified interval estimation as distinct from point estimation. In doing so, he recognized that then-recent work quoting results in the form of an estimate plus-or-minus a standard deviation indicated that interval estimation was actually the problem statisticians really had in mind.
Validity is the extent to which a concept, conclusion or measurement is well-founded and likely corresponds accurately to the real world. The word "valid" is derived from the Latin validus, meaning strong. The validity of a measurement tool is the degree to which the tool measures what it claims to measure. Validity is based on the strength of a collection of different types of evidence described in greater detail below.
In statistics, path analysis is used to describe the directed dependencies among a set of variables. This includes models equivalent to any form of multiple regression analysis, factor analysis, canonical correlation analysis, discriminant analysis, as well as more general families of models in the multivariate analysis of variance and covariance analyses.
In statistics, a categorical variable is a variable that can take on one of a limited, and usually fixed, number of possible values, assigning each individual or other unit of observation to a particular group or nominal category on the basis of some qualitative property. In computer science and some branches of mathematics, categorical variables are referred to as enumerations or enumerated types. Commonly, each of the possible values of a categorical variable is referred to as a level. The probability distribution associated with a random categorical variable is called a categorical distribution.
Statistics, when used in a misleading fashion, can trick the casual observer into believing something other than what the data shows. That is, a misuse of statistics occurs when a statistical argument asserts a falsehood. In some cases, the misuse may be accidental. In others, it is purposeful and for the gain of the perpetrator. When the statistical reason involved is false or misapplied, this constitutes a statistical fallacy.
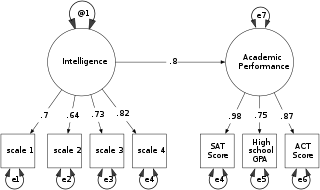
Structural equation modeling (SEM) includes a diverse set of mathematical models, computer algorithms, and statistical methods that fit networks of constructs to data. SEM includes confirmatory factor analysis, confirmatory composite analysis, path analysis, partial least squares path modeling, and latent growth modeling. The concept should not be confused with the related concept of structural models in econometrics, nor with structural models in economics. Structural equation models are often used to assess unobservable 'latent' constructs. They often invoke a measurement model that defines latent variables using one or more observed variables, and a structural model that imputes relationships between latent variables. The links between constructs of a structural equation model may be estimated with independent regression equations or through more involved approaches such as those employed in LISREL.
In economics and econometrics, the parameter identification problem arises when the value of one or more parameters in an economic model cannot be determined from observable variables. It is closely related to non-identifiability in statistics and econometrics, which occurs when a statistical model has more than one set of parameters that generate the same distribution of observations, meaning that multiple parameterizations are observationally equivalent.
Robert Paul Abelson was a Yale University psychologist and political scientist with special interests in statistics and logic.
In statistics, confirmatory factor analysis (CFA) is a special form of factor analysis, most commonly used in social research. It is used to test whether measures of a construct are consistent with a researcher's understanding of the nature of that construct. As such, the objective of confirmatory factor analysis is to test whether the data fit a hypothesized measurement model. This hypothesized model is based on theory and/or previous analytic research. CFA was first developed by Jöreskog and has built upon and replaced older methods of analyzing construct validity such as the MTMM Matrix as described in Campbell & Fiske (1959).
The foundations of statistics concern the epistemological debate in statistics over how one should conduct inductive inference from data. Among the issues considered in statistical inference are the question of Bayesian inference versus frequentist inference, the distinction between Fisher's "significance testing" and Neyman–Pearson "hypothesis testing", and whether the likelihood principle should be followed. Some of these issues have been debated for up to 200 years without resolution.
Causal inference is the process of drawing a conclusion about a causal connection based on the conditions of the occurrence of an effect. The main difference between causal inference and inference of association is that the former analyzes the response of the effect variable when the cause is changed. The science of why things occur is called etiology. Causal inference is an example of causal reasoning.
Predictive probability of success (PPOS) is a statistics concept commonly used in the pharmaceutical industry including by health authorities to support decision making. In clinical trials, PPOS is the probability of observing a success in the future based on existing data. It is one type of probability of success. A Bayesian means by which the PPOS can be determined is through integrating the data's likelihood over possible future responses.
JASP is a free and open-source graphical program for statistical analysis supported by the University of Amsterdam. It is designed to be easy to use, and familiar to users of SPSS. It offers standard analysis procedures in both their classical and Bayesian form. JASP generally produces APA style results tables and plots to ease publication. It promotes open science by integration with the Open Science Framework and reproducibility by integrating the analysis settings into the results. The development of JASP is financially supported by several universities and research funds.
The probability of success (POS) is a statistics concept commonly used in the pharmaceutical industry including by health authorities to support decision making.
Fiona Alison Steele, is a British statistician. Since 2013, she has been Professor of Statistics at the London School of Economics (LSE).
References
- 1 2 3 4 "The MAGIC Criteria". jsvine.com. 16 February 2015. Retrieved 13 February 2020.
- 1 2 3 4 "Criteria for a persuasive statistical argument: MAGIC" (PDF). COURSE HOME PAGE INDEX AND MAILLISTS. Simon Fraser University. Retrieved 13 February 2020.
Adapted from Abelson, Robert P. (1995). Statistics as principled argument. Hillsdale, NJ: Lawrence Erlbaum, pp. 12–14.
- ↑ Qian, Song (2014). "Statistics in ecology is for making a "principled argument"". Landscape Ecology. 29 (6): 937–939. doi: 10.1007/s10980-014-0042-y .
- ↑ Caludia, Stanny. "404 – Page Not Found | University of West Florida" (PDF). uwf.edu. Archived from the original (PDF) on 2019-04-16. Retrieved 2019-12-23.Cite uses generic title (help)
- ↑ Boomsma, Anne (2000). "Reporting Analysis of Covariance Studies". Structural Equation Modeling. 7: 461–483. doi:10.1207/S15328007SEM0703_6. S2CID 67844468.