
In statistics, the percentile rank (PR) of a given score is the percentage of scores in its frequency distribution that are less than that score. [1]
In statistics, the percentile rank (PR) of a given score is the percentage of scores in its frequency distribution that are less than that score. [1]
Its mathematical formula is
where CF—the cumulative frequency—is the count of all scores less than or equal to the score of interest, F is the frequency for the score of interest, and N is the number of scores in the distribution. Alternatively, if CF' is the count of all scores less than the score of interest, then
The figure illustrates the percentile rank computation and shows how the 0.5 × F term in the formula ensures that the percentile rank reflects a percentage of scores less than the specified score. For example, for the 10 scores shown in the figure, 60% of them are below a score of 4 (five less than 4 and half of the two equal to 4) and 95% are below 7 (nine less than 7 and half of the one equal to 7). Occasionally the percentile rank of a score is mistakenly defined as the percentage of scores lower than or equal to it[ citation needed ], but that would require a different computation, one with the 0.5 × F term deleted. Typically percentile ranks are only computed for scores in the distribution but, as the figure illustrates, percentile ranks can also be computed for scores whose frequency is zero. For example, 90% of the scores are less than 6 (nine less than 6, none equal 6).

In educational measurement, a range of percentile ranks, often appearing on a score report, shows the range within which the test taker's "true" percentile rank probably occurs. The "true" value refers to the rank the test taker would obtain if there were no random errors involved in the testing process. [2]
Percentile ranks are commonly used to clarify the interpretation of scores on standardized tests. For the test theory, the percentile rank of a raw score is interpreted as the percentage of examinees in the norm group who scored below the score of interest. [3] [4]
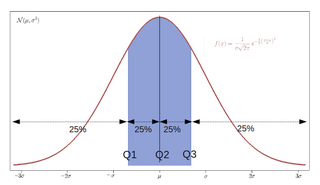
Percentile ranks are not on an equal-interval scale; that is, the difference between any two scores is not the same as between any other two scores whose difference in percentile ranks is the same. For example, 50 − 25 = 25 is not the same distance as 60 − 35 = 25 because of the bell-curve shape of the distribution. Some percentile ranks are closer to some than others. Percentile rank 30 is closer on the bell curve to 40 than it is to 20. If the distribution is normally distributed, the percentile rank can be inferred from the standard score.

In probability theory and statistics, the cumulative distribution function (CDF) of a real-valued random variable , or just distribution function of , evaluated at , is the probability that will take a value less than or equal to .

In statistics and probability theory, the median is the value separating the higher half from the lower half of a data sample, a population, or a probability distribution. For a data set, it may be thought of as "the middle" value. The basic feature of the median in describing data compared to the mean is that it is not skewed by a small proportion of extremely large or small values, and therefore provides a better representation of the center. Median income, for example, may be a better way to describe the center of the income distribution because increases in the largest incomes alone have no effect on the median. For this reason, the median is of central importance in robust statistics.
In statistics and probability, quantiles are cut points dividing the range of a probability distribution into continuous intervals with equal probabilities, or dividing the observations in a sample in the same way. There is one fewer quantile than the number of groups created. Common quantiles have special names, such as quartiles, deciles, and percentiles. The groups created are termed halves, thirds, quarters, etc., though sometimes the terms for the quantile are used for the groups created, rather than for the cut points.

In statistics, the standard deviation is a measure of the amount of variation of a random variable expected about its mean. A low standard deviation indicates that the values tend to be close to the mean of the set, while a high standard deviation indicates that the values are spread out over a wider range.

In probability theory and statistics, skewness is a measure of the asymmetry of the probability distribution of a real-valued random variable about its mean. The skewness value can be positive, zero, negative, or undefined.
The total harmonic distortion is a measurement of the harmonic distortion present in a signal and is defined as the ratio of the sum of the powers of all harmonic components to the power of the fundamental frequency. Distortion factor, a closely related term, is sometimes used as a synonym.
In medicine and health-related fields, a reference range or reference interval is the range or the interval of values that is deemed normal for a physiological measurement in healthy persons. It is a basis for comparison for a physician or other health professional to interpret a set of test results for a particular patient. Some important reference ranges in medicine are reference ranges for blood tests and reference ranges for urine tests.

In statistics, Spearman's rank correlation coefficient or Spearman's ρ, named after Charles Spearman and often denoted by the Greek letter (rho) or as , is a nonparametric measure of rank correlation. It assesses how well the relationship between two variables can be described using a monotonic function.
In statistics, a k-thpercentile, also known as percentile score or centile, is a score below which a given percentage k of scores in its frequency distribution falls or a score at or below which a given percentage falls. Percentiles are expressed in the same unit of measurement as the input scores, not in percent; for example, if the scores refer to human weight, the corresponding percentiles will be expressed in kilograms or pounds. In the limit of an infinite sample size, the percentile approximates the percentile function, the inverse of the cumulative distribution function.
Survival analysis is a branch of statistics for analyzing the expected duration of time until one event occurs, such as death in biological organisms and failure in mechanical systems. This topic is called reliability theory or reliability analysis in engineering, duration analysis or duration modelling in economics, and event history analysis in sociology. Survival analysis attempts to answer certain questions, such as what is the proportion of a population which will survive past a certain time? Of those that survive, at what rate will they die or fail? Can multiple causes of death or failure be taken into account? How do particular circumstances or characteristics increase or decrease the probability of survival?
Mann–Whitney test is a nonparametric test of the null hypothesis that, for randomly selected values X and Y from two populations, the probability of X being greater than Y is equal to the probability of Y being greater than X.
In statistics, an effect size is a value measuring the strength of the relationship between two variables in a population, or a sample-based estimate of that quantity. It can refer to the value of a statistic calculated from a sample of data, the value of a parameter for a hypothetical population, or to the equation that operationalizes how statistics or parameters lead to the effect size value. Examples of effect sizes include the correlation between two variables, the regression coefficient in a regression, the mean difference, or the risk of a particular event happening. Effect sizes complement statistical hypothesis testing, and play an important role in power analyses, sample size planning, and in meta-analyses. The cluster of data-analysis methods concerning effect sizes is referred to as estimation statistics.
In finance, the duration of a financial asset that consists of fixed cash flows, such as a bond, is the weighted average of the times until those fixed cash flows are received. When the price of an asset is considered as a function of yield, duration also measures the price sensitivity to yield, the rate of change of price with respect to yield, or the percentage change in price for a parallel shift in yields.
In statistics, the binomial test is an exact test of the statistical significance of deviations from a theoretically expected distribution of observations into two categories using sample data.
In probability theory and statistics, the coefficient of variation (CV), also known as Normalized Root-Mean-Square Deviation (NRMSD), Percent RMS, and relative standard deviation (RSD), is a standardized measure of dispersion of a probability distribution or frequency distribution. It is defined as the ratio of the standard deviation to the mean , and often expressed as a percentage ("%RSD"). The CV or RSD is widely used in analytical chemistry to express the precision and repeatability of an assay. It is also commonly used in fields such as engineering or physics when doing quality assurance studies and ANOVA gauge R&R, by economists and investors in economic models, and in psychology/neuroscience.
The Wilcoxon signed-rank test is a non-parametric statistical hypothesis test used either to test the location of a population based on a sample of data, or to compare the locations of two populations using two matched samples. The one-sample version serves a purpose similar to that of the one-sample Student's t-test. For two matched samples, it is a paired difference test like the paired Student's t-test. The Wilcoxon test can be a good alternative to the t-test when population means are not of interest; for example, when one wishes to test whether a population's median is nonzero, or whether there is a better than 50% chance that a sample from one population is greater than a sample from another population.
The Hoover index, also known as the Robin Hood index or the Schutz index, is a measure of income inequality. It is equal to the percentage of the total population's income that would have to be redistributed to make all the incomes equal.
In educational statistics, a normal curve equivalent (NCE), developed for the United States Department of Education by the RMC Research Corporation, is a way of normalizing scores received on a test into a 0-100 scale similar to a percentile rank, but preserving the valuable equal-interval properties of a z-score.

In probability and statistics, the quantile function outputs the value of a random variable such that its probability is less than or equal to an input probability value. Intuitively, the quantile function associates with a range at and below a probability input the likelihood that a random variable is realized in that range for some probability distribution. It is also called the percentile function, percent-point function or inverse cumulative distribution function.
Ordinal data is a categorical, statistical data type where the variables have natural, ordered categories and the distances between the categories are not known. These data exist on an ordinal scale, one of four levels of measurement described by S. S. Stevens in 1946. The ordinal scale is distinguished from the nominal scale by having a ranking. It also differs from the interval scale and ratio scale by not having category widths that represent equal increments of the underlying attribute.

