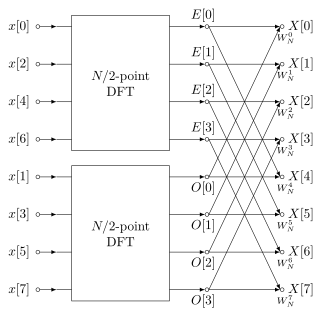
A fast Fourier transform (FFT) is an algorithm that computes the discrete Fourier transform (DFT) of a sequence, or its inverse (IDFT). Fourier analysis converts a signal from its original domain to a representation in the frequency domain and vice versa. The DFT is obtained by decomposing a sequence of values into components of different frequencies. This operation is useful in many fields, but computing it directly from the definition is often too slow to be practical. An FFT rapidly computes such transformations by factorizing the DFT matrix into a product of sparse factors. As a result, it manages to reduce the complexity of computing the DFT from , which arises if one simply applies the definition of DFT, to , where n is the data size. The difference in speed can be enormous, especially for long data sets where n may be in the thousands or millions. In the presence of round-off error, many FFT algorithms are much more accurate than evaluating the DFT definition directly or indirectly. There are many different FFT algorithms based on a wide range of published theories, from simple complex-number arithmetic to group theory and number theory.

In descriptive statistics, a box plot or boxplot is a method for graphically demonstrating the locality, spread and skewness groups of numerical data through their quartiles. In addition to the box on a box plot, there can be lines extending from the box indicating variability outside the upper and lower quartiles, thus, the plot is also called the box-and-whisker plot and the box-and-whisker diagram. Outliers that differ significantly from the rest of the dataset may be plotted as individual points beyond the whiskers on the box-plot. Box plots are non-parametric: they display variation in samples of a statistical population without making any assumptions of the underlying statistical distribution. The spacings in each subsection of the box-plot indicate the degree of dispersion (spread) and skewness of the data, which are usually described using the five-number summary. In addition, the box-plot allows one to visually estimate various L-estimators, notably the interquartile range, midhinge, range, mid-range, and trimean. Box plots can be drawn either horizontally or vertically.
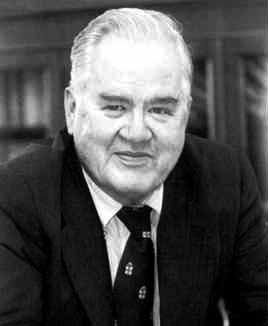
John Wilder Tukey was an American mathematician and statistician, best known for the development of the fast Fourier Transform (FFT) algorithm and box plot. The Tukey range test, the Tukey lambda distribution, the Tukey test of additivity, and the Teichmüller–Tukey lemma all bear his name. He is also credited with coining the term bit and the first published use of the word software.

In statistics, exploratory data analysis (EDA) is an approach of analyzing data sets to summarize their main characteristics, often using statistical graphics and other data visualization methods. A statistical model can be used or not, but primarily EDA is for seeing what the data can tell us beyond the formal modeling and thereby contrasts traditional hypothesis testing. Exploratory data analysis has been promoted by John Tukey since 1970 to encourage statisticians to explore the data, and possibly formulate hypotheses that could lead to new data collection and experiments. EDA is different from initial data analysis (IDA), which focuses more narrowly on checking assumptions required for model fitting and hypothesis testing, and handling missing values and making transformations of variables as needed. EDA encompasses IDA.
Level of measurement or scale of measure is a classification that describes the nature of information within the values assigned to variables. Psychologist Stanley Smith Stevens developed the best-known classification with four levels, or scales, of measurement: nominal, ordinal, interval, and ratio. This framework of distinguishing levels of measurement originated in psychology and has since had a complex history, being adopted and extended in some disciplines and by some scholars, and criticized or rejected by others. Other classifications include those by Mosteller and Tukey, and by Chrisman.
Projection pursuit (PP) is a type of statistical technique that involves finding the most "interesting" possible projections in multidimensional data. Often, projections that deviate more from a normal distribution are considered to be more interesting. As each projection is found, the data are reduced by removing the component along that projection, and the process is repeated to find new projections; this is the "pursuit" aspect that motivated the technique known as matching pursuit.

The Fastest Fourier Transform in the West (FFTW) is a software library for computing discrete Fourier transforms (DFTs) developed by Matteo Frigo and Steven G. Johnson at the Massachusetts Institute of Technology.
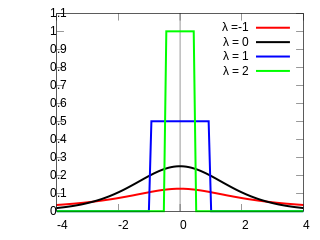
Formalized by John Tukey, the Tukey lambda distribution is a continuous, symmetric probability distribution defined in terms of its quantile function. It is typically used to identify an appropriate distribution and not used in statistical models directly.
Computational statistics, or statistical computing, is the bond between statistics and computer science, and refers to the statistical methods that are enabled by using computational methods. It is the area of computational science specific to the mathematical science of statistics. This area is also developing rapidly, leading to calls that a broader concept of computing should be taught as part of general statistical education.
In statistics and computational geometry, the notion of centerpoint is a generalization of the median to data in higher-dimensional Euclidean space. Given a set of points in d-dimensional space, a centerpoint of the set is a point such that any hyperplane that goes through that point divides the set of points in two roughly equal subsets: the smaller part should have at least a 1/(d + 1) fraction of the points. Like the median, a centerpoint need not be one of the data points. Every non-empty set of points (with no duplicates) has at least one centerpoint.
Structured data analysis is the statistical data analysis of structured data. This can arise either in the form of an a priori structure such as multiple-choice questionnaires or in situations with the need to search for structure that fits the given data, either exactly or approximately. This structure can then be used for making comparisons, predictions, manipulations etc.
Tableau Software, LLC is an American interactive data visualization software company focused on business intelligence. It was founded in 2003 in Mountain View, California, and is currently headquartered in Seattle, Washington. In 2019 the company was acquired by Salesforce for $15.7 billion. At the time, this was the largest acquisition by Salesforce since its foundation. It was later surpassed by Salesforce's acquisition of Slack.

Leland Wilkinson was an American statistician and computer scientist at H2O.ai and Adjunct Professor of Computer Science at University of Illinois at Chicago. Wilkinson developed the SYSTAT statistical package in the early 1980s, sold it to SPSS in 1995, and worked at SPSS for 10 years recruiting and managing the visualization team. He left SPSS in 2008 and became Executive VP of SYSTAT Software Inc. in Chicago. He then served as the VP of Data Visualization at Skytree, Inc and VP of Statistics at Tableau Software before joining H2O.ai. His research focused on scientific visualization and statistical graphics. In these communities he was well known for his book The Grammar of Graphics, which was the foundation for the R package ggplot2.

ggplot2 is an open-source data visualization package for the statistical programming language R. Created by Hadley Wickham in 2005, ggplot2 is an implementation of Leland Wilkinson's Grammar of Graphics—a general scheme for data visualization which breaks up graphs into semantic components such as scales and layers. ggplot2 can serve as a replacement for the base graphics in R and contains a number of defaults for web and print display of common scales. Since 2005, ggplot2 has grown in use to become one of the most popular R packages.
In statistics and computational geometry, the Tukey depth is a measure of the depth of a point in a fixed set of points. The concept is named after its inventor, John Tukey. Given a set of n points in d-dimensional space, Tukey's depth of a point x is the smallest fraction of points in any closed halfspace that contains x.
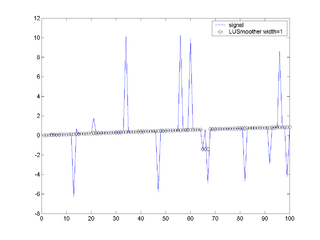
In signal processing, Lulu smoothing is a nonlinear mathematical technique for removing impulsive noise from a data sequence such as a time series. It is a nonlinear equivalent to taking a moving average of a time series, and is similar to other nonlinear smoothing techniques, such as Tukey or median smoothing.
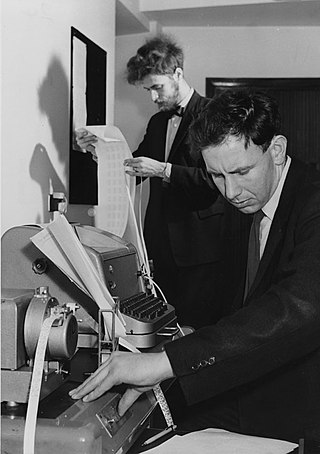
The Blackman–Tukey transformation is a digital signal processing method to transform data from the time domain to the frequency domain. It was originally programmed around 1953 by James Cooley for John Tukey at John von Neumann's Institute for Advanced Study as a way to get "good smoothed statistical estimates of power spectra without requiring large Fourier transforms." It was published by Ralph Beebe Blackman and John Tukey in 1958.

Evelyn Frances Leland (1867–1931) was an American astronomer and member of "Harvard Computers," a group of female astronomers who worked at the Harvard College Observatory under Director Edward Pickering. She worked for 36 years (1889–1925) as his assistant, and represented his team. Leland and her colleagues performed an analysis of photographic plates taken in Cambridge and Arequipa, Peru. She was involved in computing stellar spectra and discovering variable stars. She also worked with other members from the observatory to publish the paper.
Robert Lee Grossman is an American computer scientist and bioinformatician at the University of Chicago. His primary research interests are data science and data-intensive computing.

Vega and Vega-Lite are visualization tools implementing a grammar of graphics, similar to ggplot2. The Vega and Vega-Lite grammars extend Leland Wilkinson's Grammar of Graphics. by adding a novel grammar of interactivity to assist in the exploration of complex datasets.
