1932 United States presidential election in Virginia

Last updated

1932 United States presidential election in Virginia
Flag of Virginia (1861).svg
  1928 November 8, 1932 1936  
  FDR in 1933.jpg Unsuccessful 1932.jpg
Nominee Franklin D. Roosevelt Herbert Hoover
Party Democratic Republican
Home state New York Iowa
Running mate John N. Garner Charles Curtis
Electoral vote110
Popular vote203,97989,637
Percentage68.46%30.09%

Virginia Presidential Election Results 1932.svg
County Results

President before election

Herbert Hoover
Republican

Elected President

Franklin D. Roosevelt
Democratic

The 1932 United States presidential election in Virginia took place on November 8, 1932. Voters chose eleven representatives, or electors to the Electoral College, who voted for president and vice president.

Contents

Like all former Confederate States, early twentieth-century Virginia almost completely disenfranchised its black and poor white populations through the use of a cumulative poll tax and literacy tests. [1] So severe was the disenfranchising effect of the new 1902 Constitution that it has been calculated that a third of the electorate during the first half of the twentieth century comprised state employees and officeholders. [1]

This limited electorate meant Virginian politics was controlled by political machines based in Southside Virginia—the 1920 would see the building of the Byrd Organization which would control the state's politics until the Voting Rights Act. Progressive “antiorganization” factions were rendered impotent by the inability of almost all their potential electorate to vote. [2] Unlike the Deep South, historical fusion with the “Readjuster” Democrats, [3] defection over free silver of substantial proportions of the Northeast-aligned white electorate of the Shenandoah Valley and Southwest Virginia, [4] and an early move towards a “lily white” Jim Crow party [3] meant that in general elections the Republicans retained around one-third of the small statewide electorate, [5] with the majority of GOP support located in the western part of the state. However—like in Tennessee during the same era—the parties avoided competition in many areas by an agreed division over local offices. [2]

1928 saw a substantial change, whereby a combination of anti-Catholicism in the Tidewater region and growing middle-class Republicanism in the cities saw Republican Herbert Hoover carry Virginia's electoral votes [6] and elect three Congressmen, including the local district of emerging machine leader Byrd. [7] However, a combination of record drought [8] and the economic catastrophe of the Great Depression meant that the trend towards the GOP would be short-lived. [9] The Depression had extremely severe effects in the South, which had the highest unemployment rate in the nation, and many Southerners blamed this on the North and on Wall Street, rejecting Hoover's claim that the Depression's causes were exogenous. [10]

For some time in 1932, Byrd was seen as a possible compromise candidate between Roosevelt and Al Smith for the Democratic presidential nomination; [11] however, Southern opposition to Smith meant that Byrd ultimately wavered on seeking the nomination and accepted Roosevelt, [12] as even delegates from such states as North Carolina rejected him for FDR.

Neither major party candidate campaigned in the state, and no polls were taken early in the campaign. when the state was finally polled in the middle of October, Roosevelt was clearly leading over Hoover by around five-to-two. [13] A later poll had Roosevelt winning by seventy thousand votes, despite overall being much more favourable to the incumbent president than most other polls. [14] As it turned out, the earlier poll was more accurate, with Roosevelt winning by over one hundred and fourteen thousand votes. Roosevelt ultimately won the national election with 57.41 percent of the vote.

Results

1932 United States presidential election in Virginia [15]
PartyCandidateVotesPercentageElectoral votes
Democratic Franklin D. Roosevelt 203,97968.46%11
Republican Herbert Hoover (inc.)89,63730.09%0
Socialist Norman Thomas 2,3820.80%0
Prohibition William David Upshaw 1,8430.62%0
Communist William Z. Foster 860.03%0
Farmer-Labor Jacob Coxey 150.01%0
Totals297,942100.00%11

Results by county or independent city

1932 United States presidential election in Virginia by counties and independent cities [16]
Franklin Delano Roosevelt
Democratic
Herbert Clark Hoover
Republican
Various candidates
Other parties
MarginTotal votes cast
# %# %# %# %
Accomack County 2,45881.74%52717.53%220.73%1,93164.22%3,007
Albemarle County 1,94978.24%50820.39%341.36%1,44157.85%2,491
Alleghany County 1,29353.50%1,09545.30%291.20%1988.19%2,417
Amelia County 70182.08%14216.63%111.29%55965.46%854
Amherst County 1,76489.09%1959.85%211.06%1,56979.24%1,980
Appomattox County 1,12383.99%20415.26%100.75%91968.74%1,337
Arlington County 3,28552.69%2,80645.01%1432.29%4797.68%6,234
Augusta County 2,60661.51%1,54136.37%902.12%1,06525.14%4,237
Bath County 59459.88%38438.71%141.41%21021.17%992
Bedford County 2,32181.99%46916.57%411.45%1,85265.42%2,831
Bland County 78357.74%55641.00%171.25%22716.74%1,356
Botetourt County 1,80859.12%1,20939.54%411.34%59919.59%3,058
Brunswick County 1,36195.58%523.65%110.77%1,30991.92%1,424
Buchanan County 1,37265.24%72734.57%40.19%64530.67%2,103
Buckingham County 87079.82%20418.72%161.47%66661.10%1,090
Campbell County 1,69283.72%30114.89%281.39%1,39168.83%2,021
Caroline County 1,07678.89%27019.79%181.32%80659.09%1,364
Carroll County 1,53750.79%1,46148.28%280.93%762.51%3,026
Charles City County 24573.13%8525.37%51.49%16047.76%335
Charlotte County 1,30088.02%16911.44%80.54%1,13176.57%1,477
Chesterfield County 1,88669.90%72626.91%863.19%1,16042.99%2,698
Clarke County 84186.43%12412.74%80.82%71773.69%973
Craig County 64967.18%30231.26%151.55%34735.92%966
Culpeper County 1,34975.70%41723.40%160.90%93252.30%1,782
Cumberland County 51184.05%8413.82%132.14%42770.23%608
Dickenson County 2,63567.95%1,22831.67%150.39%1,40736.28%3,878
Dinwiddie County 1,02890.18%1049.12%80.70%92481.05%1,140
Elizabeth City County 1,22662.58%70035.73%331.68%52626.85%1,959
Essex County 42080.15%10119.27%30.57%31960.88%524
Fairfax County 2,71465.33%1,36832.93%721.73%1,34632.40%4,154
Fauquier County 1,99983.43%37915.82%180.75%1,62067.61%2,396
Floyd County 69939.90%1,05159.99%20.11%-352-20.09%1,752
Fluvanna County 57975.39%17622.92%131.69%40352.47%768
Franklin County 2,24572.96%81226.39%200.65%1,43346.57%3,077
Frederick County 1,53676.19%45622.62%241.19%1,08053.57%2,016
Giles County 1,75462.60%1,01636.26%321.14%73826.34%2,802
Gloucester County 91675.64%28023.12%151.24%63652.52%1,211
Goochland County 62977.65%16620.49%151.85%46357.16%810
Grayson County 2,30658.26%1,62441.03%280.71%68217.23%3,958
Greene County 39460.43%25839.57%00.00%13620.86%652
Greensville County 69285.33%11213.81%70.86%58071.52%811
Halifax County 3,58391.85%2757.05%431.10%3,30884.80%3,901
Hanover County 1,07380.56%23817.87%211.58%83562.69%1,332
Henrico County 2,45863.43%1,29133.32%1263.25%1,16730.12%3,875
Henry County 1,14676.25%34222.75%151.00%80453.49%1,503
Highland County 46455.37%35542.36%192.27%10913.01%838
Isle of Wight County 98277.02%28422.27%90.71%69854.75%1,275
James City County 30271.06%11627.29%71.65%18643.76%425
King and Queen County 36868.79%15428.79%132.43%21440.00%535
King George County 47569.65%20329.77%40.59%27239.88%682
King William County 61276.12%17722.01%151.87%43554.10%804
Lancaster County 63968.93%27229.34%161.73%36739.59%927
Lee County 2,89258.84%1,98540.39%380.77%90718.45%4,915
Loudoun County 2,44079.45%60019.54%311.01%1,84059.92%3,071
Louisa County 87968.62%36628.57%362.81%51340.05%1,281
Lunenburg County 1,14191.50%927.38%141.12%1,04984.12%1,247
Madison County 84961.52%52237.83%90.65%32723.70%1,380
Mathews County 65256.50%48842.29%141.21%16414.21%1,154
Mecklenburg County 2,18888.30%27511.10%150.61%1,91377.20%2,478
Middlesex County 59580.19%12717.12%202.70%46863.07%742
Montgomery County 1,80553.01%1,52244.70%782.29%2838.31%3,405
Nansemond County 1,26486.22%19613.37%60.41%1,06872.85%1,466
Nelson County 1,45785.61%23813.98%70.41%1,21971.62%1,702
New Kent County 28670.44%11528.33%51.23%17142.12%406
Norfolk County 2,92672.09%1,07226.41%611.50%1,85445.68%4,059
Northampton County 1,26480.15%29818.90%150.95%96661.26%1,577
Northumberland County 63071.27%24527.71%91.02%38543.55%884
Nottoway County 1,34880.67%27716.58%462.75%1,07164.09%1,671
Orange County 1,25379.96%30919.72%50.32%94460.24%1,567
Page County 1,85158.61%1,26139.93%461.46%59018.68%3,158
Patrick County 1,34272.42%48626.23%251.35%85646.20%1,853
Pittsylvania County 3,12481.35%65617.08%601.56%2,46864.27%3,840
Powhatan County 43378.02%10819.46%142.52%32558.56%555
Prince Edward County 97081.04%19616.37%312.59%77464.66%1,197
Prince George County 59783.03%11515.99%70.97%48267.04%719
Prince William County 1,49978.61%38620.24%221.15%1,11358.36%1,907
Princess Anne County 1,45176.29%43222.71%191.00%1,01953.58%1,902
Pulaski County 2,31466.99%1,10932.11%310.90%1,20534.89%3,454
Rappahannock County 59081.94%12417.22%60.83%46664.72%720
Richmond County 46169.95%19229.14%60.91%26940.82%659
Roanoke County 2,50958.79%1,70439.93%551.29%80518.86%4,268
Rockbridge County 1,76467.35%81130.97%441.68%95336.39%2,619
Rockingham County 2,75053.85%2,19442.96%1633.19%55610.89%5,107
Russell County 3,27470.09%1,38629.67%110.24%1,88840.42%4,671
Scott County 2,13755.64%1,67343.56%310.81%46412.08%3,841
Shenandoah County 2,63550.51%2,51448.19%681.30%1212.32%5,217
Smyth County 2,28754.50%1,84343.92%661.57%44410.58%4,196
Southampton County 1,35787.15%18211.69%181.16%1,17575.47%1,557
Spotsylvania County 78468.35%34630.17%171.48%43838.19%1,147
Stafford County 73161.38%45438.12%60.50%27723.26%1,191
Surry County 65388.72%739.92%101.36%58078.80%736
Sussex County 68883.39%12214.79%151.82%56668.61%825
Tazewell County 2,71356.97%2,00542.10%440.92%70814.87%4,762
Warren County 1,09674.46%36724.93%90.61%72949.52%1,472
Warwick County 64571.67%24226.89%131.44%40344.78%900
Washington County 2,78460.17%1,77438.34%691.49%1,01021.83%4,627
Westmoreland County 64174.80%21224.74%40.47%42950.06%857
Wise County 5,27668.13%2,40531.06%630.81%2,87137.07%7,744
Wythe County 1,86653.56%1,58945.61%290.83%2777.95%3,484
York County 45756.84%30938.43%384.73%14818.41%804
Alexandria City 2,94170.29%1,19928.66%441.05%1,74241.63%4,184
Bristol City 1,25279.09%30719.39%241.52%94559.70%1,583
Buena Vista City 25858.90%15435.16%265.94%10423.74%438
Charlottesville City 1,28775.53%40924.00%80.47%87851.53%1,704
Clifton Forge City 91772.15%32825.81%262.05%58946.34%1,271
Danville City 2,26473.41%74023.99%802.59%1,52449.42%3,084
Fredericksburg City 81268.18%36630.73%131.09%44637.45%1,191
Hampton City 77271.22%29427.12%181.66%47844.10%1,084
Harrisonburg City 99558.81%66539.30%321.89%33019.50%1,692
Hopewell City 95772.50%34225.91%211.59%61546.59%1,320
Lynchburg City 3,65674.07%1,20024.31%801.62%2,45649.76%4,936
Martinsville City 73977.14%21222.13%70.73%52755.01%958
Newport News City 2,70362.80%1,51535.20%862.00%1,18827.60%4,304
Norfolk City 8,81465.45%4,40332.69%2501.86%4,41132.75%13,467
Petersburg City 1,92078.69%49020.08%301.23%1,43058.61%2,440
Portsmouth City 3,34463.17%1,84034.76%1102.08%1,50428.41%5,294
Radford City 54259.63%34137.51%262.86%20122.11%909
Richmond City 14,63170.75%5,60227.09%4482.17%9,02943.66%20,681
Roanoke City 6,21565.15%3,19533.49%1301.36%3,02031.66%9,540
South Norfolk City 59763.17%32934.81%192.01%26828.36%945
Staunton City 98863.54%55135.43%161.03%43728.10%1,555
Suffolk City 1,01378.71%26520.59%90.70%74858.12%1,287
Williamsburg City 38776.63%9919.60%193.76%28857.03%505
Winchester City 1,17961.73%69836.54%331.73%48125.18%1,910
Totals203,97968.46%89,63730.09%4,3261.45%114,34238.38%297,942

Analysis

Although Roosevelt won Virginia by a margin that exceeded Woodrow Wilson’s two victories in the state and was the best Democratic performance since Andrew Jackson exactly a century previously, Hoover—despite losing every county except Floyd—was still able to maintain a small portion of the urban and Tidewater gains gains made by the Republicans during the 1920s. [6] In some counties of the Virginia Peninsula and Middle Peninsula, the incumbent president bettered Calvin Coolidge’s 1924 performance even in a depression year.

As of the 2020 presidential election , this is the last election in which Carroll County, Highland County, and Shenandoah County voted for a Democratic presidential candidate. [17] This is the closest anyone has come to sweeping every Virginia county since 1820.

Related Research Articles

<span class="mw-page-title-main">1932 United States presidential election</span> 37th quadrennial U.S. presidential election

The 1932 United States presidential election was the 37th quadrennial presidential election, held on Tuesday, November 8, 1932. The election took place against the backdrop of the Great Depression. The incumbent Republican President Herbert Hoover was defeated in a landslide by Democrat Franklin D. Roosevelt, the governor of New York and the vice presidential nominee of the 1920 presidential election. Roosevelt was the first Democrat in 80 years to simultaneously win an outright majority of the electoral college and popular vote, a feat last accomplished by Franklin Pierce in 1852, as well as the first Democrat in 56 years to win a majority of the popular vote, which was last done by Samuel J. Tilden in 1876. Roosevelt was the last sitting governor to be elected president until Bill Clinton in 1992. Hoover became the first incumbent president to lose an election to another term since William Howard Taft in 1912, and the last to do so until Gerald Ford lost 44 years later. The election marked the effective end of the Fourth Party System, which had been dominated by Republicans. It was the first time since 1916 that a Democrat was elected president.

The New Deal coalition was an American political coalition that supported the Democratic Party beginning in 1932. The coalition is named after President Franklin D. Roosevelt's New Deal programs, and the follow-up Democratic presidents. It was composed of voting blocs who supported them. The coalition included labor unions, blue-collar workers, big city machines, racial and religious minorities, white Southerners, and intellectuals. Besides voters the coalition included powerful interest groups: Democratic Party organizations in most states, city machines, labor unions, some third parties, universities, and foundations. It was largely opposed by the Republican Party, the business community, and rich Protestants. In creating his coalition, Roosevelt was at first eager to include liberal Republicans and some radical third parties, even if it meant downplaying the "Democratic" name. By the 1940s, the Republican and third-party allies had mostly been defeated. In 1948, the Democratic Party stood alone and survived the splits that created two splinter parties.

<span class="mw-page-title-main">1960 United States presidential election in Virginia</span> Election in Virginia

The 1960 United States presidential election in Virginia took place on November 8, 1960. Voters chose 12 representatives, or electors to the Electoral College, who voted for president and vice president.

<span class="mw-page-title-main">1964 United States presidential election in Virginia</span> Election in Virginia

The 1964 United States presidential election in Virginia took place on November 3, 1964. All 50 states and the District of Columbia were part of the 1964 United States presidential election. Virginia voters chose 12 electors to the Electoral College, which selected the president and vice president of the United States.

<span class="mw-page-title-main">1956 United States presidential election in Virginia</span> Election in Virginia

The 1956 United States presidential election in Virginia took place on November 6, 1956. Voters chose twelve representatives, or electors to the Electoral College, who voted for president and vice president. For the previous five decades Virginia had almost completely disenfranchised its black and poor white populations through the use of a cumulative poll tax and literacy tests. So restricted was suffrage in this period that it has been calculated that a third of Virginia's electorate during the first half of the twentieth century comprised state employees and officeholders.

<span class="mw-page-title-main">1952 United States presidential election in Virginia</span> Election in Virginia

The 1952 United States presidential election in Virginia took place on November 4, 1952. Voters chose twelve representatives, or electors to the Electoral College, who voted for president and vice president.

<span class="mw-page-title-main">1948 United States presidential election in Virginia</span> Election in Virginia

The 1948 United States presidential election in Virginia took place on November 2, 1948, throughout the 48 contiguous states. Voters chose 11 representatives, or electors to the Electoral College, who voted for president and vice president.

<span class="mw-page-title-main">1928 United States presidential election in Virginia</span> Election in Virginia

The 1928 United States presidential election in Virginia took place on November 6, 1928. Voters chose 12 representatives, or electors to the Electoral College, who voted for president and vice president.

<span class="mw-page-title-main">1924 United States presidential election in Virginia</span> Election in Virginia

The 1924 United States presidential election in Virginia took place on November 4, 1924. Voters chose 12 representatives, or electors to the Electoral College, who voted for president and vice president.

<span class="mw-page-title-main">1912 United States presidential election in Virginia</span> Election in Virginia

The 1912 United States presidential election in Virginia took place on November 5, 1912. Voters chose 12 representatives, or electors to the Electoral College, who voted for president and vice president.

<span class="mw-page-title-main">1936 United States presidential election in Florida</span> Election in Florida

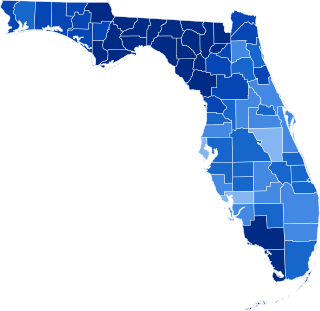
The 1936 United States presidential election in Florida was held on November 8, 1936. Florida voters chose seven electors, or representatives to the Electoral College, who voted for president and vice president.

<span class="mw-page-title-main">1940 United States presidential election in Alabama</span> Election in Alabama

The 1940 United States presidential election in Alabama took place on November 5, 1940, as part of the 1940 United States presidential election. Alabama voters chose 11 representatives, or electors, to the Electoral College, who voted for president and vice president. In Alabama, voters voted for electors individually instead of as a slate, as in the other states.

<span class="mw-page-title-main">1936 United States presidential election in Arkansas</span> Election in Arkansas

The 1936 United States presidential election in Arkansas took place on November 3, 1936, as part of the 1936 United States presidential election. State voters chose nine representatives, or electors, to the Electoral College, who voted for president and vice president.

<span class="mw-page-title-main">1944 United States presidential election in North Carolina</span>

The 1944 United States presidential election in North Carolina took place on November 7, 1944, as part of the 1944 United States presidential election. North Carolina voters chose 14 representatives, or electors, to the Electoral College, who voted for president and vice president.

<span class="mw-page-title-main">1940 United States presidential election in North Carolina</span>

The 1940 United States presidential election in North Carolina took place on November 5, 1940, as part of the 1940 United States presidential election. North Carolina voters chose 13 representatives, or electors, to the Electoral College, who voted for president and vice president.

<span class="mw-page-title-main">1940 United States presidential election in Tennessee</span> Election in Tennessee

The 1940 United States presidential election in Tennessee took place on November 5, 1940, as part of the 1940 United States presidential election. Tennessee voters chose 11 representatives, or electors, to the Electoral College, who voted for president and vice president.

<span class="mw-page-title-main">1936 United States presidential election in Alabama</span> Election in Alabama

The 1936 United States presidential election in Alabama took place on November 3, 1936, as part of the nationwide presidential election. Voters chose eleven representatives, or electors to the Electoral College, who voted for president and vice president. In Alabama, voters voted for electors individually instead of as a slate, as in the other states.

<span class="mw-page-title-main">1936 United States presidential election in North Carolina</span>

The 1936 United States presidential election in North Carolina took place on November 3, 1936, as part of the 1936 United States presidential election. North Carolina voters chose 13 representatives, or electors, to the Electoral College, who voted for president and vice president.

<span class="mw-page-title-main">1932 United States presidential election in Alabama</span> Election in Alabama

The 1932 United States presidential election in Alabama took place on November 8, 1932, as part of the nationwide presidential election. Alabama voters chose eleven representatives, or electors, to the Electoral College, who voted for president and vice president. In Alabama, voters voted for electors individually instead of as a slate, as in the other states.

<span class="mw-page-title-main">1932 United States presidential election in North Carolina</span>

The 1932 United States presidential election in North Carolina took place on November 8, 1932, as part of the 1932 United States presidential election. North Carolina voters chose thirteen representatives, or electors, to the Electoral College, who voted for president and vice president.

References

  1. 1 2 Kousser, J. Morgan. The Shaping of Southern Politics: Suffrage Restriction and the Establishment of the One-Party South, 1880-1910. Yale University Press. pp. 178–181. ISBN   0-300-01696-4.
  2. 1 2 Key, Valdimer Orlando (1949). Southern Politics in State and Nation. pp. 20–25.
  3. 1 2 Heersink, Boris; Jenkins, Jeffrey A. Republican Party Politics and the American South, 1865-1968. pp. 217–221. ISBN   1107158435.
  4. Moger, Allen. "The Rift in Virginia Democracy in 1896". The Journal of Southern History . 4 (3): 295–317.
  5. Phillips, Kevin P. (1969). The Emerging Republican Majority. pp. 193, 219. ISBN   0870000586.
  6. 1 2 Phillips. The Emerging Republican Majority, p. 195
  7. Hawkes (junior), Robert T. (July 1974). "The Emergence of a Leader: Harry Flood Byrd, Governor of Virginia, 1926-1930". The Virginia Magazine of History and Biography. 82 (3): 259–281.
  8. Heinemann, Ronald L. (1996). Harry Byrd of Virginia. Charlottesville, Virginia: University Press of Virginia.
  9. Lewinson, Paul (1965). Race, class and party; a history of Negro suffrage and white politics in the South. pp. 167–168.
  10. Ritchie, Donald A. (2007). Electing FDR: the New Deal campaign of 1932. Lawrence, Kansas: University Press of Kansas. p. 143. ISBN   070061687X.
  11. Heinemann; Harry Byrd of Virginia, p. 141
  12. Heinemann; Harry Byrd of Virginia, p. 143
  13. "Roosevelt Overwhelmingly". The Tampa Times . October 21, 1932. p. 4-A.
  14. Pasquino (October 30, 1932). "Non-Partisan Forecast Gives G.O.P. President Edge over Roosevelt". The Idaho Statesman . Boise, Idaho. pp. 1, 6.
  15. "Statistics of the Congressional and Presidential election of November 8, 1932" (PDF). Clerk of the House of Representatives. p. 38.
  16. Robinson, Edgar Eugene; The Presidential Vote 1896-1932, pp. 354-361 ISBN   9780804716963
  17. Sullivan, Robert David; ‘How the Red and Blue Map Evolved Over the Past Century’; America Magazine in The National Catholic Review; June 29, 2016