2008 United States presidential election in Virginia

Last updated

2008 United States presidential election in Virginia
Flag of Virginia.svg
  2004 November 4, 2008 2012  
Turnout74.0% Increase2.svg 3.2 [1]
  Obama portrait crop.jpg John McCain 2009 Official.jpg
Nominee Barack Obama John McCain
Party Democratic Republican
Home state Illinois Arizona
Running mate Joe Biden Sarah Palin
Electoral vote130
Popular vote1,959,5321,725,005
Percentage52.63%46.33%

Virginia Presidential Election Results 2008.svg
2008 US Presidential election in Virginia by congressional district.svg
2008 Presidential election in Virginia.svg

President before election

George W. Bush
Republican

Elected President

Barack Obama
Democratic

The 2008 United States presidential election in Virginia took place on November 4, 2008, which was part of the 2008 United States presidential election. Voters chose 13 representatives, or electors to the Electoral College, who voted for president and vice president.

Contents

Virginia was won by Democratic nominee Barack Obama by a 6.3% margin of victory. Prior to the election, 16 of 17 news organizations considered this a state Obama would win, or otherwise a likely blue state, despite the fact that Virginia had not voted for a Democratic presidential nominee since Lyndon B. Johnson's 44-state landslide in 1964. The financial meltdown, changing demographics, and population increases in voter-rich Northern Virginia helped make the state more competitive for Obama. His victory marked a powerful shift in the political climate in Virginia, as the state would go on to vote for the Democratic presidential nominee in every election thereafter.

This also marked the first presidential election since 1924 in which Virginia voted for the Democratic presidential candidate whilst neighboring West Virginia voted for the Republican candidate; in every election since, both states have voted for those respective parties. Despite Obama's victory, Virginia's margin was 0.97% more Republican than the national average, though it would be the last time Virginia voted more Republican than the nation. As of the 2020 presidential election , this is the last election in which King and Queen County voted for the Democratic candidate.

Primaries

Campaign

Virginia was one of the first Southern states to break away from its traditional Democratic roots. It voted for Dwight Eisenhower by a convincing margin in 1952, and voted for every Republican nominee since then save for Johnson's massive landslide in 1964.

However, the Democrats had made big gains in recent years with winning two gubernatorial races in a row, regaining control of the Virginia Senate, and electing Democrat Jim Webb to the U.S. Senate over incumbent Republican George Allen in 2006. Democrats made such gains in part due to the ever-expanding Northern Virginia, particularly the suburbs surrounding Washington, D.C. Historically, this area was strongly Republican. However, in recent years it has been dominated by white liberals who tend to vote Democratic. [2] It was, ultimately, this rapid demographic change that provided a huge new influx of Democratic voters to Virginia. [3]

Both presidential campaigns and the mainstream media treated Virginia as a swing state for most of the campaign. Obama campaigned extensively in Virginia and counted on the booming northern parts of the state for a Democratic victory. Victory in the presidential election for McCain would have been extremely difficult without Virginia; he would have had to win every swing state as well as at least one Democratic-leaning state.

Predictions

There were 16 news organizations who made state-by-state predictions of the election. Here are their last predictions before election day:

SourceRanking
D.C. Political Report [4] Lean D (flip)
Cook Political Report [5] Lean D (flip)
The Takeaway [6] Lean D (flip)
Electoral-vote.com [7] Lean D (flip)
Washington Post [8] Lean D (flip)
Politico [9] Lean D (flip)
RealClearPolitics [10] Toss-up
FiveThirtyEight [8] Lean D (flip)
CQ Politics [11] Lean D (flip)
The New York Times [12] Lean D (flip)
CNN [13] Lean D (flip)
NPR [8] Lean D (flip)
MSNBC [8] Lean D (flip)
Fox News [14] Likely D (flip)
Associated Press [15] Likely D (flip)
Rasmussen Reports [16] Lean D (flip)

Polling

After McCain clinched the Republican Party nomination in early March, he took a wide lead in polls against Obama, averaging almost 50%. But through the summer, polling was nearly dead even, with McCain only slightly leading Obama. After the Lehman Brothers went bankrupt, Obama took a wide lead in the polls. In October, Obama won every single poll taken but one, and reached over 50% in most of them. The final three polls averaged Obama leading 51% to 46%. [17] [18]

Fundraising

Obama raised $17,035,784. McCain raised $16,130,194. [19]

Spending and visits

Obama spent over $26 million to McCain spending just $14 million. [20] The Obama-Biden ticket visited the state 19 times compared to just 10 times for McCain-Palin. [21]

Analysis

Voters wait in queue at a polling station on the campus of George Mason University GMU Mason Votes Election Day 004 (3004497702).jpg
Voters wait in queue at a polling station on the campus of George Mason University

On Election Day, early returns showed McCain ahead. [22] This was due in large part to the fact that many of the rural areas began to report first. However, Obama swamped McCain by scoring a near-sweep in Northern Virginia, which reported its returns last.

Obama did exceptionally well throughout the most populous regions of the state. Northern Virginia overwhelmingly supported Obama. [23] In Arlington County and the independent city of Alexandria, the most traditionally Democratic jurisdictions in the region, Obama got over 70% of the vote, improving on Kerry by between 4% and 5% in both. In Fairfax County (the largest county in the state, and a then-traditionally Republican county that Kerry had become the first Democrat in 40 years to carry in 2004) Obama exceeded 60%, improving on Kerry's percentage by just shy of 7%. Just beyond Fairfax, to its south and west, Obama flipped the large counties of Loudoun and Prince William, becoming the first Democrat to carry either since 1964. [24]

The two other major metropolitan areas in the eastern part of the state, Richmond and Hampton Roads, are somewhat less Democratic than Northern Virginia. In both areas, Obama improved significantly on John Kerry's performance. [23] While Obama easily won Richmond itself (which is 57% African American), he also made significant inroads into Richmond's traditionally heavily Republican suburbs. He carried Henrico County with 57% of the vote; that county last supported a Democrat with Harry S. Truman in 1948. [25] In Chesterfield County, Obama did almost 20 points better than Kerry. [26] Both counties had historically been strongly Republican at the national level; Chesterfield had given George W. Bush his largest raw vote margin in Virginia in both 2000 and 2004.

Obama also did very well in Hampton Roads. The four Democratic-leaning cities along the harbor - Hampton, Newport News, Norfolk, and Portsmouth - gave him margins exceeding 60%. Obama also split the Republican-leaning cities of Chesapeake and Virginia Beach; he barely won the former and barely lost the latter. Obama's strong performance in the area likely contributed to Democrat Glenn Nye unseating two-term Republican incumbent Thelma Drake in the 2nd Congressional District , a heavy military district which includes all of Virginia Beach and large portions of Norfolk and Hampton. Outside Virginia's three major metropolitan areas, Obama also significantly outperformed Kerry in Albemarle and Montgomery Counties and in a series of independent cities around the state, most significantly Roanoke. Albemarle County surrounds Charlottesville, home to the University of Virginia, and Montgomery County is home to Virginia Tech.

Elsewhere in rural Virginia, however, McCain did well. [26] In the Shenandoah Valley and Southside Virginia, both traditional bases for the Republican Party in Virginia, [27] Obama ran roughly evenly with Kerry; but in southwestern Virginia—at the time one of the more traditionally Democratic regions of the state—McCain outperformed Bush in 2004, even flipping two counties (Buchanan and Dickenson), both of which last voted Republican in 1972; Obama thus became the first Democrat to win the White House without carrying the aforementioned two counties since Woodrow Wilson in 1916. However, without the support of suburban voters in the eastern metropolitan areas of the commonwealth, McCain was ultimately unable to hold Virginia.

During the same election, former Democratic Governor Mark Warner solidly defeated former Governor (and his predecessor) Republican Jim Gilmore by a two-to-one margin for the open U.S. Senate seat vacated by incumbent Republican John Warner (no relation to Mark Warner). Warner received 65.03% of the vote while Gilmore took in 33.73%. Warner won all but five counties in the state. Democrats also picked up three seats in the U.S. House of Representatives. At the state level, Democrats picked up one seat in the Virginia House of Delegates.

Results

United States presidential election in Virginia, 2008 [28]
PartyCandidateRunning mateVotesPercentageElectoral votes
Democratic Barack Obama Joe Biden 1,959,53252.63%13
Republican John McCain Sarah Palin 1,725,00546.33%0
Independent Ralph Nader Matt Gonzalez 11,4830.31%0
Libertarian Bob Barr Wayne Allyn Root 11,0670.30%0
Constitution Chuck Baldwin Darrell Castle7,4740.20%0
Green Cynthia McKinney Rosa Clemente 2,3440.06%0
Write-insWrite-ins6,3550.17%0
Totals3,723,260100.00%13
Voter turnout (Voting age population)65.1%

By city/county

County/CityBarack Obama
Democratic
John McCain
Republican
Various candidates
Other parties
MarginTotal
#%#%#%#%
Accomack 7,60748.69%7,83350.14%1831.17%-226-1.45%15,623
Albemarle 29,79258.43%20,57640.36%6161.21%9,21618.07%50,984
Alexandria 50,47371.73%19,18127.26%7101.01%31,29244.47%70,364
Alleghany 3,55348.22%3,71550.41%1011.37%-162-2.19%7,369
Amelia 2,48838.11%3,97060.81%711.08%-1,482-22.70%6,529
Amherst 6,09441.46%8,47057.62%1360.92%-2,376-16.16%14,700
Appomattox 2,64134.61%4,90364.26%861.13%-2,262-29.65%7,630
Arlington 78,99471.71%29,87627.12%1,2831.17%49,11844.59%110,153
Augusta 9,82529.47%23,12069.35%3931.18%-13,295-39.88%33,338
Bath 1,04342.89%1,34955.47%401.64%-306-12.58%2,432
Bedford 11,01730.75%24,42068.16%3931.09%-13,403-37.41%35,830
Bedford City 1,20844.18%1,49754.75%291.07%-289-10.57%2,734
Bland 86429.20%2,03168.64%642.16%-1,167-39.44%2,959
Botetourt 5,69332.71%11,47165.90%2421.39%-5,778-33.19%17,406
Bristol 2,66536.21%4,57962.22%1151.57%-1,914-26.01%7,359
Brunswick 4,97362.84%2,87736.35%640.81%2,09626.49%7,914
Buchanan 4,06346.52%4,54151.99%1301.49%-478-5.47%8,734
Buckingham 3,48949.89%3,42849.01%771.10%610.88%6,994
Buena Vista 1,10845.73%1,28252.91%331.36%-174-7.18%2,423
Campbell 8,09131.34%17,44467.58%2791.08%-9,353-36.24%25,814
Caroline 7,16355.45%5,61743.48%1391.07%1,54611.97%12,919
Carroll 4,10932.67%8,18765.08%2832.25%-4,078-32.41%12,579
Charles City 2,83868.34%1,28831.01%270.65%1,55037.33%4,153
Charlotte 2,70543.93%3,37254.77%801.30%-667-10.84%6,157
Charlottesville 15,70578.35%4,07820.35%2611.30%11,62758.00%20,044
Chesapeake 53,99450.22%52,62548.94%9020.84%1,3691.28%107,521
Chesterfield 74,31045.85%86,41353.31%1,3650.84%-12,103-7.46%162,088
Clarke 3,45746.52%3,84051.68%1341.80%-383-5.16%7,431
Colonial Heights 2,56228.95%6,16169.62%1261.43%-3,599-40.67%8,849
Covington 1,30455.40%1,02043.33%301.27%28412.07%2,354
Craig 87733.46%1,69564.67%491.87%-818-31.21%2,621
Culpeper 8,80244.59%10,71154.26%2281.15%-1,909-9.67%19,741
Cumberland 2,25547.73%2,41851.19%511.08%-163-3.46%4,724
Danville 12,35259.13%8,36140.02%1770.85%3,99119.11%20,890
Dickenson 3,27848.54%3,32449.22%1512.24%-46-0.68%6,753
Dinwiddie 6,24648.45%6,52650.62%1200.93%-280-2.17%12,892
Emporia 1,70265.04%89734.28%180.68%80530.76%2,617
Essex 2,93454.70%2,37944.35%510.95%55510.35%5,364
Fairfax 310,35960.12%200,99438.93%4,9010.95%109,36521.19%516,254
Fairfax City 6,57557.69%4,69141.16%1321.15%1,88416.53%11,398
Falls Church 4,69569.56%1,97029.19%851.25%2,72540.37%6,750
Fauquier 14,61642.71%19,22756.19%3761.10%-4,611-13.48%34,219
Floyd 2,93739.08%4,44159.09%1381.83%-1,504-20.01%7,516
Fluvanna 6,18548.57%6,42050.41%1301.02%-235-1.84%12,735
Franklin 9,61837.86%15,41460.68%3691.46%-5,796-22.82%25,401
Franklin City 2,81963.68%1,57635.60%320.72%1,24328.08%4,427
Frederick 12,96138.56%20,14959.95%5021.49%-7,188-21.39%33,612
Fredericksburg 6,15563.60%3,41335.27%1091.13%2,74228.33%9,677
Galax 1,05243.80%1,31754.83%331.37%-265-11.03%2,402
Giles 3,19240.95%4,46257.24%1411.81%-1,270-16.29%7,795
Gloucester 6,91635.98%12,08962.89%2171.13%-5,173-26.91%19,222
Goochland 4,81338.31%7,64360.84%1060.85%-2,830-22.53%12,562
Grayson 2,48034.35%4,54062.88%2002.77%-2,060-28.53%7,220
Greene 3,17438.43%4,98060.29%1061.28%-1,806-21.86%8,260
Greensville 3,12263.88%1,72935.38%360.74%1,39328.50%4,887
Halifax 8,12648.23%8,60051.04%1240.73%-474-2.81%16,850
Hampton 46,91769.05%20,47630.14%5500.81%26,44138.91%67,943
Hanover 18,44732.80%37,34466.39%4570.81%-18,897-33.59%56,248
Harrisonburg 8,44457.54%6,04841.21%1831.25%2,39616.33%14,675
Henrico 86,32355.70%67,38143.48%1,2620.82%18,94212.22%154,966
Henry 11,11844.09%13,75854.56%3391.35%-2,640-10.47%25,215
Highland 59037.97%93059.85%342.18%-340-21.88%1,554
Hopewell 5,28555.49%4,14943.56%900.95%1,13611.93%9,524
Isle of Wight 8,57342.87%11,25856.30%1660.83%-2,685-13.43%19,997
James City 17,35244.95%20,91254.17%3390.88%-3,560-9.22%38,603
King and Queen 1,91851.77%1,76347.58%240.65%1554.19%3,705
King George 4,47342.71%5,88856.22%1131.07%-1,415-13.51%10,474
King William 3,34439.87%4,96659.20%780.93%-1,622-19.33%8,388
Lancaster 3,23546.63%3,64752.57%560.80%-412-5.94%6,938
Lee 3,21934.89%5,82563.13%1831.98%-2,606-28.24%9,227
Lexington 1,54362.24%91436.87%220.89%62925.37%2,479
Loudoun 74,84553.67%63,33645.42%1,2780.91%11,5098.25%139,459
Louisa 6,97845.45%8,18253.29%1931.26%-1,204-7.84%15,353
Lunenburg 2,70347.84%2,90051.33%470.83%-197-3.49%5,650
Lynchburg 16,26947.37%17,63851.36%4341.27%-1,369-3.99%34,341
Madison 2,86242.72%3,75856.10%791.18%-896-13.38%6,699
Manassas 7,51855.17%5,97543.85%1340.98%1,54311.32%13,627
Manassas Park 2,46359.49%1,63439.47%431.04%82920.02%4,140
Martinsville 4,13963.48%2,31135.44%701.08%1,82828.04%6,520
Mathews 1,93435.55%3,45663.53%500.92%-1,522-27.98%5,440
Mecklenburg 7,12747.26%7,81751.83%1380.91%-690-4.57%15,082
Middlesex 2,39139.81%3,54559.02%701.17%-1,154-19.21%6,006
Montgomery 21,03151.73%19,02846.81%5941.46%2,0034.92%40,653
Nelson 4,39153.99%3,64744.84%951.17%7449.15%8,133
New Kent 3,49334.96%6,38563.91%1131.13%-2,892-28.95%9,991
Newport News 51,97263.93%28,66735.26%6560.81%23,30528.67%81,295
Norfolk 62,81971.03%24,81428.06%8130.91%38,00542.97%88,446
Northampton 3,80057.70%2,71341.19%731.11%1,08716.51%6,586
Northumberland 3,31244.72%4,04154.56%530.72%-729-9.84%7,406
Norton 74349.14%74449.21%251.65%-1-0.07%1,512
Nottoway 3,41348.84%3,49950.07%761.09%-86-1.23%6,988
Orange 7,10744.98%8,50653.83%1881.19%-1,399-8.85%15,801
Page 4,23540.76%6,04158.15%1131.09%-1,806-17.39%10,389
Patrick 2,87933.75%5,49164.37%1611.88%-2,612-30.62%8,531
Petersburg 13,77488.64%1,58310.19%1831.17%12,19178.45%15,540
Pittsylvania 11,41537.51%18,73061.55%2880.94%-7,315-24.04%30,433
Poquoson 1,74824.74%5,22974.01%881.25%-3,481-49.27%7,065
Portsmouth 32,32769.27%13,98429.97%3540.76%18,34339.30%46,665
Powhatan 4,23729.31%10,08869.78%1310.91%-5,851-40.47%14,456
Prince Edward 5,10154.34%4,17444.46%1131.20%9279.88%9,388
Prince George 7,13044.55%8,75254.68%1240.77%-1,622-10.13%16,006
Prince William 93,43557.52%67,62141.63%1,3900.85%25,81415.89%162,446
Pulaski 5,91839.32%8,85758.85%2751.83%-2,939-19.53%15,050
Radford 2,93053.97%2,41844.54%811.49%5129.43%5,429
Rappahannock 2,10547.79%2,22750.56%731.65%-122-2.77%4,405
Richmond 1,61843.20%2,09255.86%350.94%-474-12.66%3,745
Richmond City 73,62379.09%18,64920.03%8130.88%54,97459.06%93,085
Roanoke 19,81238.87%30,57159.97%5921.16%-10,759-21.10%50,975
Roanoke City 24,93461.15%15,39437.76%4441.09%9,54023.39%40,772
Rockbridge 4,34742.64%5,73256.22%1161.14%-1,385-13.58%10,195
Rockingham 10,45331.36%22,46867.40%4131.24%-12,015-36.04%33,334
Russell 4,93242.91%6,38955.59%1731.50%-1,457-12.68%11,494
Salem 5,16441.63%7,08857.13%1541.24%-1,924-15.50%12,406
Scott 2,72527.59%6,98070.68%1701.73%-4,255-43.09%9,875
Shenandoah 6,91235.96%12,00562.45%3061.59%-5,093-26.49%19,223
Smyth 4,23934.46%7,81763.54%2462.00%-3,578-29.08%12,302
Southampton 4,40248.55%4,58350.55%820.90%-181-2.00%9,067
Spotsylvania 24,89746.05%28,61052.91%5621.04%-3,713-6.86%54,069
Stafford 25,71646.37%29,22152.69%5180.94%-3,505-6.32%55,455
Staunton 5,56950.56%5,33048.39%1161.05%2392.17%11,015
Suffolk 22,44656.24%17,16543.01%2970.75%5,28113.23%39,908
Surry 2,62660.72%1,66338.45%360.83%96322.27%4,325
Sussex 3,30161.55%2,02637.78%360.67%1,27523.77%5,363
Tazewell 5,59632.80%11,20165.65%2641.55%-5,605-32.85%17,061
Virginia Beach 98,88549.14%100,31949.85%2,0451.01%-1,434-0.71%201,249
Warren 6,99743.39%8,87955.06%2501.55%-1,882-11.67%16,126
Washington 8,06332.91%16,07765.62%3601.47%-8,014-32.71%24,500
Waynesboro 3,90644.09%4,81554.35%1391.56%-909-10.26%8,860
Westmoreland 4,57754.64%3,71944.40%810.96%85810.24%8,377
Williamsburg 4,32863.77%2,35334.67%1060.95%1,97529.10%6,787
Winchester 5,26852.02%4,72546.66%1331.32%5435.36%10,126
Wise 4,99535.33%8,91463.05%2291.62%-3,919-27.72%14,138
Wythe 4,10732.88%8,20765.70%1771.42%-4,100-32.82%12,491
York 13,70040.42%19,83358.51%3641.07%-6,133-18.09%33,897
Totals1,959,53252.63%1,725,00546.33%38,7231.04%234,5276.30%3,723,260
County Flips:
Democratic
Hold
Gain from Republican
Republican
Hold
Gain from Democratic Virginia County Flips 2008.svg
County Flips:

Counties and independent cities that flipped from Democratic to Republican

Counties and independent cities that flipped from Republican to Democratic

By congressional district

Barack Obama carried 6 of the state's 11 congressional districts. Both candidates carried two districts won by the other party.

DistrictMcCainObamaRepresentative
1st 51.35%47.67% Jo Ann Davis (110th Congress)
Robert J. Wittman (111th Congress)
2nd 48.48%50.45% Thelma Drake (110th Congress)
Glenn Nye (111th Congress)
3rd 23.74%75.52% Robert C. Scott
4th 48.80%50.33% Randy Forbes
5th 50.59%48.29% Virgil Goode (110th Congress)
Tom Perriello (111th Congress)
6th 56.93%41.85% Bob Goodlatte
7th 53.16%45.89% Eric Cantor
8th 29.65%69.28% Jim Moran
9th 58.71%39.60% Rick Boucher
10th 46.06%52.90% Frank Wolf
11th 42.06%57.01% Thomas M. Davis (110th Congress)
Gerry Connolly (111th Congress)

Electors

Technically the voters of Virginia cast their ballots for electors: representatives to the Electoral College. Virginia is allocated 13 electors because it has 11 congressional districts and 2 senators. All candidates who appear on the ballot or qualify to receive write-in votes must submit a list of 13 electors, who pledge to vote for their candidate and his or her running mate. Whoever wins the majority of votes in the state is awarded all 13 electoral votes. Their chosen electors then vote for president and vice president. Although electors are pledged to their candidate and running mate, they are not obligated to vote for them. [29] An elector who votes for someone other than his or her candidate is known as a faithless elector.

The electors of each state and the District of Columbia met on December 15, 2008, to cast their votes for president and vice president. The Electoral College itself never meets as one body. Instead the electors from each state and the District of Columbia met in their respective capitols.

The following were the members of the Electoral College from the state. All 13 were pledged to Barack Obama and Joe Biden: [30]

  1. Christia Rey
  2. Sandra Brandt
  3. Betty Squire
  4. Susan Johnston Rowland
  5. Marc Finney
  6. Dorothy Blackwell
  7. James Harold Allen Boyd
  8. Marian Van Landingham
  9. Robert Edgar Childress
  10. Rolland Winter
  11. Janet Carver
  12. Michael Jon
  13. Sophie Ann Salley

Related Research Articles

<span class="mw-page-title-main">2008 United States presidential election in Indiana</span> Election in Indiana

The 2008 United States presidential election in Indiana took place on November 4, 2008, and was part of the 2008 United States presidential election. Voters chose 11 representatives, or electors to the Electoral College, who voted for president and vice president.

<span class="mw-page-title-main">2008 United States presidential election in Colorado</span> Election in Colorado

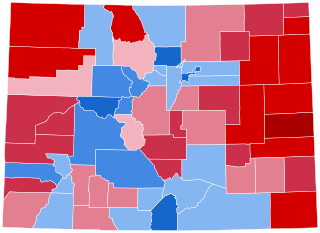
The 2008 United States presidential election in Colorado took place on November 4, 2008, as a part of the 2008 United States presidential election throughout all 50 states and the District of Columbia. Voters chose nine representatives, or electors to the Electoral College, who voted for president and vice president.

<span class="mw-page-title-main">2008 United States presidential election in Wisconsin</span> Election in Wisconsin

The 2008 United States presidential election in Wisconsin took place on November 4, 2008, as part of the 2008 United States presidential election in which all 50 states plus the District of Columbia participated. State voters chose 10 electors to represent them in the Electoral College via a popular vote pitting Democratic U.S. Senator from Illinois Barack Obama, and his running mate U.S. Senator from Delaware Joe Biden, against Republican challenger and U.S. Senator from Arizona John McCain and his running mate, Alaska Governor Sarah Palin.

<span class="mw-page-title-main">2008 United States presidential election in Utah</span> Election in Utah

The 2008 United States presidential election in Utah took place on November 4, 2008. It was part of the 2008 United States presidential election. Voters chose five representatives, or electors to the Electoral College, who voted for president and vice president.

<span class="mw-page-title-main">2008 United States presidential election in Oklahoma</span> Election in Oklahoma

The 2008 United States presidential election in Oklahoma took place on November 4, 2008, and was part of the 2008 United States presidential election. Voters chose seven representatives, or electors to the Electoral College, who voted for president and vice president.

<span class="mw-page-title-main">2008 United States presidential election in Oregon</span> Election in Oregon

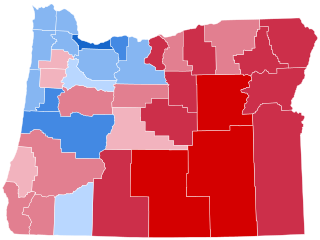
The 2008 United States presidential election in Oregon took place on November 4, 2008, and was part of the 2008 United States presidential election. Voters chose seven representatives, or electors to the Electoral College, who voted for president and vice president.

<span class="mw-page-title-main">2008 United States presidential election in Wyoming</span> Election in Wyoming

The 2008 United States presidential election in Wyoming took place on November 4, 2008, and was part of the 2008 United States presidential election. Voters chose three representatives, or electors to the Electoral College, who voted for president and vice president.

<span class="mw-page-title-main">2008 United States presidential election in North Dakota</span> Election in North Dakota

The 2008 United States presidential election in North Dakota took place on November 4, 2008, and was part of the 2008 United States presidential election. Voters chose three representatives, or electors to the Electoral College, who voted for president and vice president.

<span class="mw-page-title-main">2008 United States presidential election in Ohio</span> Election in Ohio

The 2008 United States presidential election in Ohio took place on November 4, 2008, which was part of the 2008 United States presidential election. Voters chose 20 representatives, or electors to the Electoral College, who voted for president and vice president.

<span class="mw-page-title-main">2008 United States presidential election in Alabama</span> Election in Alabama

The 2008 United States presidential election in Alabama took place on November 4, 2008, and was part of the 2008 United States presidential election. Voters chose nine representatives, or electors, to the Electoral College, who voted for president and vice president.

<span class="mw-page-title-main">2008 United States presidential election in Alaska</span> Election in Alaska

The 2008 United States presidential election in Alaska took place on November 4, 2008, as part of the nationwide presidential election held throughout all 50 states and the District of Columbia. Voters chose 3 electors, or representatives to the Electoral College, who voted for president and vice president.

<span class="mw-page-title-main">2008 United States presidential election in Arkansas</span> Election in Arkansas

The 2008 United States presidential election in Arkansas took place on November 4, 2008, and was part of the 2008 United States presidential election. State voters chose six representatives, or electors to the Electoral College, who voted for president and vice president.

<span class="mw-page-title-main">2008 United States presidential election in Idaho</span> Election in Idaho

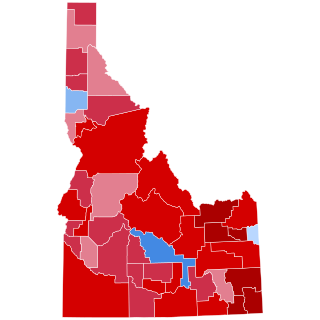
The 2008 United States presidential election in Idaho took place on November 4, 2008, and was part of the 2008 United States presidential election. Voters chose four representatives, or electors to the Electoral College, who voted for president and vice president.

<span class="mw-page-title-main">2008 United States presidential election in West Virginia</span> Election in West Virginia

The 2008 United States presidential election in West Virginia took place on November 4, 2008, and was part of the 2008 United States presidential election. Voters chose 5 representatives, or electors to the Electoral College, who voted for president and vice president.

<span class="mw-page-title-main">2008 United States presidential election in Georgia</span> Election in Georgia

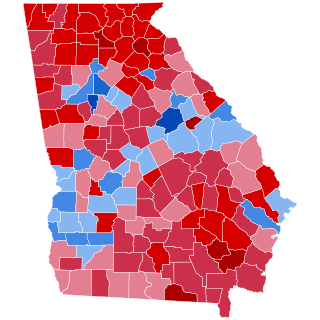
The 2008 United States presidential election in Georgia took place on November 4, 2008. Voters chose 15 representatives, or electors to the Electoral College, who voted for president and vice president.

<span class="mw-page-title-main">2008 United States presidential election in Kansas</span> Election in Kansas

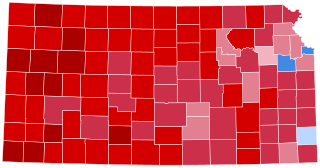
The 2008 United States presidential election in Kansas took place on November 4, 2008, and was part of the 2008 United States presidential election. Voters chose six representatives, or electors to the Electoral College, who voted for president and vice president.

<span class="mw-page-title-main">2008 United States presidential election in Kentucky</span> Election in Kentucky

The 2008 United States presidential election in Kentucky took place on November 4, 2008, and was part of the 2008 United States presidential election. Voters chose eight representatives, or electors to the Electoral College, who voted for president and vice president.

<span class="mw-page-title-main">2008 United States presidential election in Maryland</span> U.S. presidential election in Maryland

The 2008 United States presidential election in Maryland took place on November 4, 2008, and was part of the 2008 United States presidential election. Voters chose 10 representatives, or electors to the Electoral College, who voted for president and vice president.

<span class="mw-page-title-main">2008 United States presidential election in Mississippi</span> Election in Mississippi

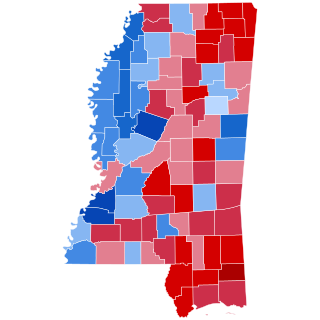
The 2008 United States presidential election in Mississippi took place on November 4, 2008, and was part of the 2008 United States presidential election. Voters chose 6 representatives, or electors to the Electoral College, who voted for president and vice president.

<span class="mw-page-title-main">2008 United States presidential election in Tennessee</span> Election in Tennessee

The 2008 United States presidential election in Tennessee was held on November 4, 2008, and was part of the 2008 United States presidential election. Voters chose 11 representatives, or electors, to the Electoral College, who voted for president and vice president.

References

  1. "Registration/Turnout Statistics". Virginia Department of Elections. Archived from the original on October 18, 2018. Retrieved September 18, 2018.
  2. "Back to the Future - The American Prospect". July 12, 2007. Archived from the original on July 12, 2007.
  3. Continetti, Matthew (October 2, 2006). "George Allen Monkeys Around". The Weekly Standard. Vol. 12, no. 3. Retrieved May 31, 2009.
  4. "D.C.'s Political Report: The complete source for campaign summaries". January 1, 2009. Archived from the original on January 1, 2009. Retrieved August 23, 2021.
  5. "Presidential". May 5, 2015. Archived from the original on May 5, 2015. Retrieved August 23, 2021.
  6. "Vote 2008 - The Takeaway - Track the Electoral College vote predictions". April 22, 2009. Archived from the original on April 22, 2009. Retrieved August 23, 2021.
  7. "Electoral-vote.com: President, Senate, House Updated Daily". electoral-vote.com. Retrieved August 23, 2021.
  8. 1 2 3 4 Based on Takeaway
  9. "POLITICO's 2008 Swing State Map - POLITICO.com". www.politico.com. Retrieved September 22, 2016.
  10. "RealClearPolitics - Electoral Map". Archived from the original on June 5, 2008.
  11. "CQ Presidential Election Maps, 2008". CQ Politics. Archived from the original on June 14, 2009. Retrieved December 20, 2009.
  12. Nagourney, Adam; Zeleny, Jeff; Carter, Shan (November 4, 2008). "The Electoral Map: Key States". The New York Times. Retrieved May 26, 2010.
  13. "October 2008 CNN Political Ticker - CNN.com Blogs". CNN. October 31, 2008. Archived from the original on June 19, 2010. Retrieved May 26, 2010.
  14. "Winning The Electoral College". Fox News. April 27, 2010.
  15. "roadto270". hosted.ap.org. Retrieved September 22, 2016.
  16. "Election 2008: Electoral College Update - Rasmussen Reports". www.rasmussenreports.com. Retrieved September 22, 2016.
  17. "2008 - Virginia: McCain vs. Obama - RealClearPolitics". www.realclearpolitics.com.
  18. "Election 2008 Polls - Dave Leip's Atlas of U.S. Presidential Elections". Archived from the original on October 23, 2008.
  19. "Presidential Campaign Finance". Archived from the original on March 24, 2009. Retrieved August 18, 2009.
  20. "Map: Campaign Ad Spending - Election Center 2008 from CNN.com". CNN. Retrieved May 26, 2010.
  21. "Map: Campaign Candidate Visits - Election Center 2008 from CNN.com". CNN. Retrieved May 26, 2010.
  22. "Election 2008: Time lapse of U.S. counties". USA Today. July 4, 2008. Retrieved May 31, 2009.
  23. 1 2 Leip, David. "2008 Presidential General Election Results". David Leip's Atlas of U.S. Presidential Elections. Retrieved May 31, 2009.
  24. Evie Stone. "372 Counties Flipped In '08". NPR. Retrieved May 3, 2024.
  25. Todd, Chuck and Gawiser, Sheldon. How Barack Obama Won. New York City: Vintage, 2009.
  26. 1 2 "Election Results 2008". New York Times. Archived from the original on November 3, 2004. Retrieved May 31, 2009.
  27. Trende, Sean (February 19, 2009). "Virginia Governor's Preview". RealClearPolitics. Retrieved May 31, 2009. The question in Virginia is always whether the Republican Party can hold together its somewhat unwieldy three-legged coalition of historically Republican Virginians in the mountainous Appalachian western portion of the state, social conservatives in the rural areas east of the Blue Ridge Mountains, and suburbanites in Northern Virginia and in the Richmond/Hampton Roads areas. Why this coalition is having troubles recently could fill a book. For our purposes, we will oversimplify somewhat and observe the following.
  28. Clerk of the U.S. House of Representatives. "Statistics of the Presidential and Congressional Election of November 4, 2008" (PDF). pp. 63 & 64.
  29. "Electoral College". California Secretary of State. Archived from the original on October 30, 2008. Retrieved November 1, 2008.
  30. "President and Vice President November 4, 2008 General Election - Electors Names and Addresses" (PDF). Commonwealth of Virginia State Board of Elections. September 9, 2008. Archived from the original (PDF) on June 4, 2011. Retrieved March 18, 2011.