| ||||||||||||||||||||||||||
| ||||||||||||||||||||||||||
County results
| ||||||||||||||||||||||||||
|
The 1940 United States presidential election in Virginia took place on November 5, 1940. Voters chose 11 representatives, or electors to the Electoral College, who voted for president and vice president.
Virginia voted for the Democratic nominee, incumbent President Franklin D. Roosevelt, over the Republican nominee, businessman Wendell Willkie. Roosevelt ultimately won the national election with 54.74% of the vote. The election would be the last time Fairfax County, Virginia's most populous county would vote Democratic until 2004 apart from 1964. As of the 2020 presidential election [update] , this is the last time the Democratic nominee has won the counties of Greene, [1] Madison [2] and Wythe. [3] It also proved the last time the Democrats would win Montgomery County until Bill Clinton did so in 1992. [4]
Elections in Virginia |
---|
1940 United States presidential election in Virginia [5] | |||||
---|---|---|---|---|---|
Party | Candidate | Votes | Percentage | Electoral votes | |
Democratic | Franklin D. Roosevelt (inc.) | 235,961 | 68.08% | 11 | |
Republican | Wendell Willkie | 109,363 | 31.55% | 0 | |
Prohibition | Roger Babson | 882 | 0.25% | 0 | |
Socialist | Norman Thomas | 282 | 0.08% | 0 | |
Communist | Earl Browder | 71 | 0.02% | 0 | |
Socialist Labor | John W. Aiken | 48 | 0.01% | 0 | |
Totals | 346,607 | 100.00% | 11 | ||
Voter turnout (Voting age) | 22.0% [6] |
County or Independent City | Franklin Delano Roosevelt Democratic | Wendell Lewis Willkie Republican | Various candidates Other parties | Margin | Total votes cast [7] | ||||
---|---|---|---|---|---|---|---|---|---|
# | % | # | % | # | % | # | % | ||
Accomack County | 1,476 | 62.38% | 882 | 37.28% | 8 | 0.34% | 594 | 25.11% | 2,366 |
Albemarle County | 1,648 | 67.05% | 804 | 32.71% | 6 | 0.24% | 844 | 34.34% | 2,458 |
Alleghany County | 2,153 | 64.67% | 1,164 | 34.97% | 12 | 0.36% | 989 | 29.71% | 3,329 |
Amelia County | 562 | 67.63% | 267 | 32.13% | 2 | 0.24% | 295 | 35.50% | 831 |
Amherst County | 2,048 | 87.26% | 292 | 12.44% | 7 | 0.30% | 1,756 | 74.82% | 2,347 |
Appomattox County | 1,144 | 83.93% | 215 | 15.77% | 4 | 0.29% | 929 | 68.16% | 1,363 |
Arlington County | 5,440 | 55.16% | 4,365 | 44.26% | 57 | 0.58% | 1,075 | 10.90% | 9,862 |
Augusta County | 2,774 | 60.78% | 1,768 | 38.74% | 22 | 0.48% | 1,006 | 22.04% | 4,564 |
Bath County | 630 | 54.17% | 527 | 45.31% | 6 | 0.52% | 103 | 8.86% | 1,163 |
Bedford County | 2,535 | 75.90% | 791 | 23.68% | 14 | 0.42% | 1,744 | 52.22% | 3,340 |
Bland County | 753 | 51.97% | 693 | 47.83% | 3 | 0.21% | 60 | 4.14% | 1,449 |
Botetourt County | 1,329 | 54.87% | 1,085 | 44.80% | 8 | 0.33% | 244 | 10.07% | 2,422 |
Brunswick County | 1,288 | 88.46% | 164 | 11.26% | 4 | 0.27% | 1,124 | 77.20% | 1,456 |
Buchanan County | 2,554 | 66.37% | 1,291 | 33.55% | 3 | 0.08% | 1,263 | 32.82% | 3,848 |
Buckingham County | 829 | 73.82% | 289 | 25.73% | 5 | 0.45% | 540 | 48.09% | 1,123 |
Campbell County | 2,358 | 83.65% | 456 | 16.18% | 5 | 0.18% | 1,902 | 67.47% | 2,819 |
Caroline County | 1,136 | 78.51% | 305 | 21.08% | 6 | 0.41% | 831 | 57.43% | 1,447 |
Carroll County | 1,546 | 45.66% | 1,835 | 54.19% | 5 | 0.15% | -289 | -8.54% | 3,386 |
Charles City County | 238 | 72.12% | 92 | 27.88% | 0 | 0.00% | 146 | 44.24% | 330 |
Charlotte County | 1,467 | 85.24% | 251 | 14.58% | 3 | 0.17% | 1,216 | 70.66% | 1,721 |
Chesterfield County | 3,354 | 78.71% | 879 | 20.63% | 28 | 0.66% | 2,475 | 58.08% | 4,261 |
Clarke County | 1,043 | 75.58% | 333 | 24.13% | 4 | 0.29% | 710 | 51.45% | 1,380 |
Craig County | 656 | 68.55% | 299 | 31.24% | 2 | 0.21% | 357 | 37.30% | 957 |
Culpeper County | 1,208 | 67.34% | 579 | 32.27% | 7 | 0.39% | 629 | 35.06% | 1,794 |
Cumberland County | 396 | 70.84% | 157 | 28.09% | 6 | 1.07% | 239 | 42.75% | 559 |
Dickenson County | 2,551 | 58.74% | 1,785 | 41.10% | 7 | 0.16% | 766 | 17.64% | 4,343 |
Dinwiddie County | 1,129 | 80.64% | 264 | 18.86% | 7 | 0.50% | 865 | 61.79% | 1,400 |
Elizabeth City County | 2,337 | 77.90% | 652 | 21.73% | 11 | 0.37% | 1,685 | 56.17% | 3,000 |
Essex County | 547 | 78.93% | 145 | 20.92% | 1 | 0.14% | 402 | 58.01% | 693 |
Fairfax County | 3,263 | 57.65% | 2,371 | 41.89% | 26 | 0.46% | 892 | 15.76% | 5,660 |
Fauquier County | 1,874 | 71.07% | 756 | 28.67% | 7 | 0.27% | 1,118 | 42.40% | 2,637 |
Floyd County | 729 | 32.93% | 1,482 | 66.94% | 3 | 0.14% | -753 | -34.01% | 2,214 |
Fluvanna County | 579 | 70.52% | 241 | 29.35% | 1 | 0.12% | 338 | 41.17% | 821 |
Franklin County | 2,037 | 68.63% | 925 | 31.17% | 6 | 0.20% | 1,112 | 37.47% | 2,968 |
Frederick County | 1,631 | 67.79% | 773 | 32.13% | 2 | 0.08% | 858 | 35.66% | 2,406 |
Giles County | 1,716 | 62.54% | 1,024 | 37.32% | 4 | 0.15% | 692 | 25.22% | 2,744 |
Gloucester County | 937 | 79.41% | 241 | 20.42% | 2 | 0.17% | 696 | 58.98% | 1,180 |
Goochland County | 820 | 81.67% | 180 | 17.93% | 4 | 0.40% | 640 | 63.75% | 1,004 |
Grayson County | 2,703 | 48.91% | 2,806 | 50.78% | 17 | 0.31% | -103 | -1.86% | 5,526 |
Greene County | 363 | 56.28% | 282 | 43.72% | 0 | 0.00% | 81 | 12.56% | 645 |
Greensville County | 843 | 84.38% | 152 | 15.22% | 4 | 0.40% | 691 | 69.17% | 999 |
Halifax County | 3,441 | 89.94% | 373 | 9.75% | 12 | 0.31% | 3,068 | 80.19% | 3,826 |
Hanover County | 1,347 | 78.36% | 364 | 21.18% | 8 | 0.47% | 983 | 57.18% | 1,719 |
Henrico County | 3,993 | 66.25% | 2,005 | 33.27% | 29 | 0.48% | 1,988 | 32.98% | 6,027 |
Henry County | 1,795 | 78.73% | 474 | 20.79% | 11 | 0.48% | 1,321 | 57.94% | 2,280 |
Highland County | 549 | 46.45% | 628 | 53.13% | 5 | 0.42% | -79 | -6.68% | 1,182 |
Isle of Wight County | 1,138 | 84.55% | 208 | 15.45% | 0 | 0.00% | 930 | 69.09% | 1,346 |
James City County | 306 | 67.40% | 146 | 32.16% | 2 | 0.44% | 160 | 35.24% | 454 |
King and Queen County | 365 | 74.49% | 124 | 25.31% | 1 | 0.20% | 241 | 49.18% | 490 |
King George County | 515 | 75.40% | 167 | 24.45% | 1 | 0.15% | 348 | 50.95% | 683 |
King William County | 697 | 74.79% | 235 | 25.21% | 0 | 0.00% | 462 | 49.57% | 932 |
Lancaster County | 711 | 68.63% | 317 | 30.60% | 8 | 0.77% | 394 | 38.03% | 1,036 |
Lee County | 4,180 | 61.39% | 2,623 | 38.52% | 6 | 0.09% | 1,557 | 22.87% | 6,809 |
Loudoun County | 2,156 | 66.73% | 1,061 | 32.84% | 14 | 0.43% | 1,095 | 33.89% | 3,231 |
Louisa County | 896 | 60.46% | 573 | 38.66% | 13 | 0.88% | 323 | 21.79% | 1,482 |
Lunenburg County | 1,213 | 89.26% | 144 | 10.60% | 2 | 0.15% | 1,069 | 78.66% | 1,359 |
Madison County | 692 | 51.56% | 646 | 48.14% | 4 | 0.30% | 46 | 3.43% | 1,342 |
Mathews County | 592 | 62.51% | 349 | 36.85% | 6 | 0.63% | 243 | 25.66% | 947 |
Mecklenburg County | 2,402 | 88.54% | 308 | 11.35% | 3 | 0.11% | 2,094 | 77.18% | 2,713 |
Middlesex County | 586 | 82.19% | 125 | 17.53% | 2 | 0.28% | 461 | 64.66% | 713 |
Montgomery County | 2,168 | 53.20% | 1,890 | 46.38% | 17 | 0.42% | 278 | 6.82% | 4,075 |
Nansemond County | 1,408 | 91.55% | 129 | 8.39% | 1 | 0.07% | 1,279 | 83.16% | 1,538 |
Nelson County | 1,291 | 79.40% | 330 | 20.30% | 5 | 0.31% | 961 | 59.10% | 1,626 |
New Kent County | 286 | 68.26% | 133 | 31.74% | 0 | 0.00% | 153 | 36.52% | 419 |
Norfolk County | 3,821 | 85.39% | 639 | 14.28% | 15 | 0.34% | 3,182 | 71.11% | 4,475 |
Northampton County | 866 | 70.52% | 359 | 29.23% | 3 | 0.24% | 507 | 41.29% | 1,228 |
Northumberland County | 712 | 64.61% | 386 | 35.03% | 4 | 0.36% | 326 | 29.58% | 1,102 |
Nottoway County | 1,290 | 77.06% | 373 | 22.28% | 11 | 0.66% | 917 | 54.78% | 1,674 |
Orange County | 1,283 | 72.94% | 464 | 26.38% | 12 | 0.68% | 819 | 46.56% | 1,759 |
Page County | 1,596 | 49.30% | 1,630 | 50.36% | 11 | 0.34% | -34 | -1.05% | 3,237 |
Patrick County | 1,479 | 73.99% | 514 | 25.71% | 6 | 0.30% | 965 | 48.27% | 1,999 |
Pittsylvania County | 3,710 | 83.28% | 728 | 16.34% | 17 | 0.38% | 2,982 | 66.94% | 4,455 |
Powhatan County | 510 | 76.23% | 157 | 23.47% | 2 | 0.30% | 353 | 52.77% | 669 |
Prince Edward County | 1,110 | 77.35% | 313 | 21.81% | 12 | 0.84% | 797 | 55.54% | 1,435 |
Prince George County | 766 | 82.81% | 156 | 16.86% | 3 | 0.32% | 610 | 65.95% | 925 |
Prince William County | 1,435 | 73.97% | 500 | 25.77% | 5 | 0.26% | 935 | 48.20% | 1,940 |
Princess Anne County | 1,689 | 79.04% | 445 | 20.82% | 3 | 0.14% | 1,244 | 58.21% | 2,137 |
Pulaski County | 2,226 | 68.39% | 1,023 | 31.43% | 6 | 0.18% | 1,203 | 36.96% | 3,255 |
Rappahannock County | 588 | 72.06% | 225 | 27.57% | 3 | 0.37% | 363 | 44.49% | 816 |
Richmond County | 475 | 64.10% | 257 | 34.68% | 9 | 1.21% | 218 | 29.42% | 741 |
Roanoke County | 3,539 | 60.11% | 2,302 | 39.10% | 47 | 0.80% | 1,237 | 21.01% | 5,888 |
Rockbridge County | 1,618 | 63.83% | 902 | 35.58% | 15 | 0.59% | 716 | 28.24% | 2,535 |
Rockingham County | 2,569 | 46.34% | 2,922 | 52.71% | 53 | 0.96% | -353 | -6.37% | 5,544 |
Russell County | 3,109 | 59.79% | 2,080 | 40.00% | 11 | 0.21% | 1,029 | 19.79% | 5,200 |
Scott County | 2,474 | 45.28% | 2,982 | 54.58% | 8 | 0.15% | -508 | -9.30% | 5,464 |
Shenandoah County | 2,450 | 40.89% | 3,527 | 58.87% | 14 | 0.23% | -1,077 | -17.98% | 5,991 |
Smyth County | 2,420 | 52.95% | 2,134 | 46.70% | 16 | 0.35% | 286 | 6.26% | 4,570 |
Southampton County | 1,508 | 87.02% | 213 | 12.29% | 12 | 0.69% | 1,295 | 74.73% | 1,733 |
Spotsylvania County | 785 | 68.02% | 365 | 31.63% | 4 | 0.35% | 420 | 36.40% | 1,154 |
Stafford County | 803 | 63.28% | 463 | 36.49% | 3 | 0.24% | 340 | 26.79% | 1,269 |
Surry County | 658 | 84.58% | 120 | 15.42% | 0 | 0.00% | 538 | 69.15% | 778 |
Sussex County | 737 | 81.62% | 164 | 18.16% | 2 | 0.22% | 573 | 63.46% | 903 |
Tazewell County | 3,108 | 56.80% | 2,356 | 43.06% | 8 | 0.15% | 752 | 13.74% | 5,472 |
Warren County | 1,338 | 73.00% | 491 | 26.79% | 4 | 0.22% | 847 | 46.21% | 1,833 |
Warwick County | 1,065 | 77.57% | 305 | 22.21% | 3 | 0.22% | 760 | 55.35% | 1,373 |
Washington County | 3,245 | 54.30% | 2,697 | 45.13% | 34 | 0.57% | 548 | 9.17% | 5,976 |
Westmoreland County | 845 | 70.24% | 357 | 29.68% | 1 | 0.08% | 488 | 40.57% | 1,203 |
Wise County | 4,538 | 75.66% | 1,448 | 24.14% | 12 | 0.20% | 3,090 | 51.52% | 5,998 |
Wythe County | 1,695 | 52.72% | 1,507 | 46.87% | 13 | 0.40% | 188 | 5.85% | 3,215 |
York County | 787 | 80.31% | 177 | 18.06% | 16 | 1.63% | 610 | 62.24% | 980 |
Alexandria City | 4,004 | 68.67% | 1,802 | 30.90% | 25 | 0.43% | 2,202 | 37.76% | 5,831 |
Bristol City | 1,465 | 76.94% | 423 | 22.22% | 16 | 0.84% | 1,042 | 54.73% | 1,904 |
Buena Vista City | 280 | 70.89% | 113 | 28.61% | 2 | 0.51% | 167 | 42.28% | 395 |
Charlottesville City | 1,759 | 69.94% | 743 | 29.54% | 13 | 0.52% | 1,016 | 40.40% | 2,515 |
Clifton Forge City | 1,179 | 76.41% | 353 | 22.88% | 11 | 0.71% | 826 | 53.53% | 1,543 |
Danville City | 3,324 | 80.27% | 787 | 19.01% | 30 | 0.72% | 2,537 | 61.27% | 4,141 |
Fredericksburg City | 1,037 | 66.26% | 522 | 33.35% | 6 | 0.38% | 515 | 32.91% | 1,565 |
Hampton City | 975 | 81.66% | 215 | 18.01% | 4 | 0.34% | 760 | 63.65% | 1,194 |
Harrisonburg City | 1,462 | 58.93% | 1,000 | 40.31% | 19 | 0.77% | 462 | 18.62% | 2,481 |
Hopewell City | 981 | 76.05% | 308 | 23.88% | 1 | 0.08% | 673 | 52.17% | 1,290 |
Lynchburg City | 4,656 | 70.22% | 1,966 | 29.65% | 9 | 0.14% | 2,690 | 40.57% | 6,631 |
Martinsville City | 980 | 78.15% | 269 | 21.45% | 5 | 0.40% | 711 | 56.70% | 1,254 |
Newport News City | 3,907 | 81.41% | 863 | 17.98% | 29 | 0.60% | 3,044 | 63.43% | 4,799 |
Norfolk City | 10,783 | 75.38% | 3,485 | 24.36% | 36 | 0.25% | 7,298 | 51.02% | 14,304 |
Petersburg City | 2,193 | 77.90% | 604 | 21.46% | 18 | 0.64% | 1,589 | 56.45% | 2,815 |
Portsmouth City | 5,053 | 87.83% | 675 | 11.73% | 25 | 0.43% | 4,378 | 76.10% | 5,753 |
Radford City | 793 | 65.21% | 417 | 34.29% | 6 | 0.49% | 376 | 30.92% | 1,216 |
Richmond City | 19,332 | 75.99% | 6,031 | 23.71% | 76 | 0.30% | 13,301 | 52.29% | 25,439 |
Roanoke City | 6,942 | 65.85% | 3,553 | 33.70% | 47 | 0.45% | 3,389 | 32.15% | 10,542 |
South Norfolk City | 920 | 85.50% | 156 | 14.50% | 0 | 0.00% | 764 | 71.00% | 1,076 |
Staunton City | 1,042 | 59.75% | 687 | 39.39% | 15 | 0.86% | 355 | 20.36% | 1,744 |
Suffolk City | 1,215 | 76.03% | 383 | 23.97% | 0 | 0.00% | 832 | 52.07% | 1,598 |
Williamsburg City | 367 | 67.84% | 168 | 31.05% | 6 | 1.11% | 199 | 36.78% | 541 |
Winchester City | 1,114 | 53.89% | 945 | 45.72% | 8 | 0.39% | 169 | 8.18% | 2,067 |
Totals | 235,961 | 68.08% | 109,363 | 31.55% | 1,284 | 0.37% | 126,598 | 36.52% | 346,608 |
The 1944 United States presidential election was the 40th quadrennial presidential election. It was held on Tuesday, November 7, 1944. The election took place during World War II, which ended the following year. Incumbent Democratic President Franklin D. Roosevelt defeated Republican Thomas E. Dewey to win an unprecedented fourth term. It was also the fifth presidential election in which both major party candidates were registered in the same home state; the others have been in 1860, 1904, 1920, 1940, and 2016.
The 1992 United States presidential election in North Carolina took place on November 3, 1992, and was part of the 1992 United States presidential election. Voters chose 14 representatives, or electors to the Electoral College, who voted for president and vice president.
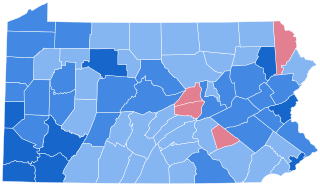
The 1964 United States presidential election in Pennsylvania took place on November 3, 1964, and was part of the 1964 United States presidential election. Voters chose 29 representatives, or electors to the Electoral College, who voted for president and vice president.
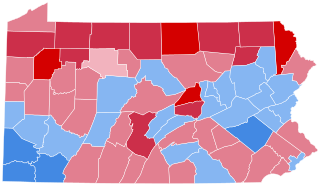
The 1940 United States presidential election in Pennsylvania took place on November 5, 1940 as part of the 1940 United States presidential election. Voters chose 36 representatives, or electors to the Electoral College, who voted for president and vice president.
The 1940 United States presidential election in Montana took place on November 5, 1940 as part of the 1940 United States presidential election. Voters chose four representatives, or electors to the Electoral College, who voted for president and vice president.
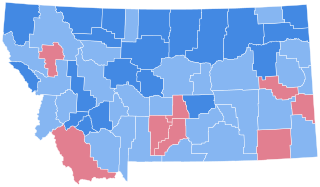
The 1944 United States presidential election in Montana took place on November 7, 1944 as part of the 1944 United States presidential election. Voters chose four representatives, or electors to the Electoral College, who voted for president and vice president.
The 1964 United States presidential election in New York took place on November 3, 1964, as part of the 1964 United States presidential election in which all 50 states plus the District of Columbia participated. New York voters chose 43 electors to represent them in the Electoral College via a popular vote pitting incumbent Democratic President Lyndon B. Johnson and his running mate, President pro tempore of the Senate Hubert Humphrey, against Republican challenger and Senator Barry Goldwater from Arizona and his running mate and Chair of the Republican National Committee, William E. Miller.
The 1912 United States presidential election in New York took place on November 5, 1912. All contemporary 48 states were part of the 1912 United States presidential election. Voters chose 45 electors to the Electoral College, which selected the president and vice president.
The 1948 United States presidential election in Virginia took place on November 2, 1948, throughout the 48 contiguous states. Voters chose 11 representatives, or electors to the Electoral College, who voted for president and vice president.
The 1944 United States presidential election in Virginia took place on November 7, 1944, throughout the 48 contiguous states. Voters chose 11 representatives, or electors to the Electoral College, who voted for president and vice president.
The 1936 United States presidential election in Virginia took place on November 3, 1936. Voters chose 11 representatives, or electors to the Electoral College, who voted for president and vice president.
The 1964 United States presidential election in Ohio was held on November 3, 1964 as part of the 1964 United States presidential election. Voters chose 26 representatives, or electors, to the Electoral College, who voted for President and Vice President.
The 1948 United States presidential election in Texas was held on November 2, 1948. Texas voters chose 23 electors to represent the state in the Electoral College, which chose the president and vice president.
The 1944 United States presidential election in Florida was held on November 7, 1944. Voters chose eight electors, or representatives to the Electoral College, who voted for president and vice president.
The 1956 United States presidential election in Alabama took place on November 6, 1956, as part of the 1956 United States presidential election. Alabama voters chose eleven representatives, or electors, to the Electoral College, who voted for president and vice president. In Alabama, voters voted for electors individually instead of as a slate, as in the other states.
The 1944 United States presidential election in Wyoming took place on November 7, 1944, as part of the 1944 United States presidential election. State voters chose three representatives, or electors, to the Electoral College, who voted for president and vice president.
The 1944 United States presidential election in Alabama took place on November 7, 1944, as part of the 1944 United States presidential election. Alabama voters chose eleven representatives, or electors, to the Electoral College, who voted for president and vice president.
The 1940 United States presidential election in Alabama took place on November 5, 1940, as part of the 1940 United States presidential election. Alabama voters chose 11 representatives, or electors, to the Electoral College, who voted for president and vice president. In Alabama, voters voted for electors individually instead of as a slate, as in the other states.
The 1944 United States presidential election in Mississippi took place on November 7, 1944, as part of the 1944 United States presidential election. Mississippi voters chose nine representatives, or electors, to the Electoral College, who voted for president and vice president.
The 1940 United States presidential election in Nebraska took place on November 5, 1940, as part of the 1940 United States presidential election. Voters chose seven representatives, or electors, to the Electoral College, who voted for president and vice president.