Adur District Council election, 1979

Last updated
Adur District Council election, 1979

Flag of England.svg


  1976 3 May 1979 1980  

All 39 seats to Adur District Council
20 seats needed for a majority

 First partySecond partyThird party
 
Party Conservative Liberal Residents
Seats won20172
Seat changeIncrease2.svg4Steady2.svgSteady2.svg

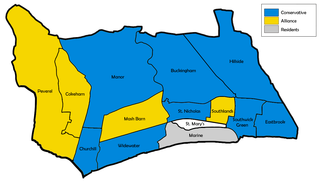
Adur UK local election 1979 map.png

Map showing the results of the 1979 Adur council elections.

Majority party before election

No Overall Control

Majority party after election

Conservative

Elections to the Adur District Council were held on 3 May 1979, alongside the general election. The entire council was up for election, following boundary changes that reduced the number of wards by one, but altogether had added an additional two seats. Overall turnout was recorded at 74.4%. [1]

Non-metropolitan district Type of local government district in England

Non-metropolitan districts, or colloquially "shire districts", are a type of local government district in England. As created, they are sub-divisions of non-metropolitan counties in a two-tier arrangement.

Contents

The election resulted in the Conservatives gaining control of the council. [2] [3]

Conservative Party (UK) Political party in the United Kingdom

The Conservative Party, officially the Conservative and Unionist Party, is a centre-right political party in the United Kingdom. Presently led by Theresa May, it has been the governing party since 2010. It presently has 314 Members of Parliament in the House of Commons, 249 members of the House of Lords, and 18 members of the European Parliament. It also has 31 Members of the Scottish Parliament, 12 members of the Welsh Assembly, eight members of the London Assembly and 9,008 local councillors. One of the major parties of UK politics, it has formed the government on 45 occasions, more than any other party.

Election result

Adur District Council Election Result 1979 [2]
PartySeatsGainsLossesNet gain/lossSeats %Votes %Votes+/−
  Conservative 2000+451.345.115,819+0.3
  Liberal 1700043.635.312,364-0.9
  Residents 20005.14.01,408+0.5
  Labour 000-20.015.65,452+0.1

This resulted in the following composition of the council [2] :

PartyPrevious councilNew council
Conservative1620
Liberal1717
Labour20
Independent Residents22
Total3739
Working majority -5  1 

Ward results

Buckingham (4025) [2]
PartyCandidateVotes%±
Conservative Merrick A.1,96060.8N/A
Conservative Morris H. Ms.1,890
Conservative Smith M.1,850
Liberal Symonds A.89127.6N/A
Liberal Wright G. Ms.861
Liberal Jewiss A.795
Labour Bovingdon K.37211.5N/A
Majority1,06933.2N/A
Turnout 3,22380.1N/A
Conservative win (new seat)
Churchill (3781) [2]
PartyCandidateVotes%±
Conservative Burley Y. Ms.1,32246.5N/A
Conservative Kemp C.1,283
Conservative Stepney L. Ms.1,226
Liberal Denyer P.1,13239.8N/A
Liberal Dolding R.1,093
Liberal Martin E. Ms.1,046
Labour Woods J. Ms.38913.7N/A
Majority1906.7N/A
Turnout 2,84375.2N/A
Conservative win (new seat)
Cokeham (3596) [2]
PartyCandidateVotes%±
Liberal Cheal J.1,41349.6N/A
Liberal Martin D.1,340
Liberal Spalding M.1,277
Conservative Lodge R.1,06137.2N/A
Conservative Newman H.852
Labour Atkins B.37713.2N/A
Majority35212.3N/A
Turnout 2,85179.3N/A
Liberal win (new seat)
Eastbrook (3692) [2]
PartyCandidateVotes%±
Conservative Coghlan J.1,33855.2N/A
Conservative Dunn R.1,318
Conservative Parish D. Ms.1,238
Labour Hobbis J.1,08744.8N/A
Labour Barnard I.1,059
Labour Boreham J.666
Majority25110.4N/A
Turnout 2,42565.7N/A
Conservative win (new seat)
Hillside (3891) [2]
PartyCandidateVotes%±
Conservative Barber B.1,61350.3N/A
Conservative Wey G.1,495
Conservative Moore M.1,436
Labour Colville P.84026.2N/A
Liberal Hammond D.75423.5N/A
Liberal Kimmings R.684
Liberal Ongley C.569
Majority77324.1N/A
Turnout 3,20782.4N/A
Conservative win (new seat)
Manor (3336) [2]
PartyCandidateVotes%±
Liberal Robinson C.1,44456.7N/A
Liberal Barton J.1,313
Liberal Cooper M.1,195
Conservative Lewis J.1,10143.3N/A
Conservative Hockett L.1,058
Conservative Shackleton P. Ms.1,039
Majority34313.5N/A
Turnout 2,54576.3N/A
Liberal win (new seat)
Marine (2577)2 [2]
PartyCandidateVotes%±
Residents Warner B. Ms.1,40865.2N/A
Residents James P. Ms.1,369
Conservative Harding I. Ms.61828.6N/A
Labour Kell D.1346.2N/A
Majority79036.6N/A
Turnout 2,16083.8N/A
Residents win (new seat)
Mash Barn (2809) [2]
PartyCandidateVotes%±
Liberal Allen C. Ms.1,04651.2N/A
Liberal Hartley J. Ms.1,017
Liberal Deedman D.1,001
Conservative Floyd J.75536.9N/A
Conservative Clothier W.724
Conservative Grover M.709
Labour Harwood R.24311.9N/A
Labour Grafton R.237
Labour Jacques W.233
Majority29114.2N/A
Turnout 2,04472.8N/A
Liberal win (new seat)
Peverel (3178) [2]
PartyCandidateVotes%±
Liberal Davis G.1,21350.9N/A
Liberal Green W.1,203
Liberal Hall M. Ms.1,107
Conservative Glynn E.82934.8N/A
Conservative Donegan I. Ms.818
Conservative Martin P. Ms.773
Labour Atkins H. Ms.34314.4N/A
Majority38416.1N/A
Turnout 2,38575.0N/A
Liberal win (new seat)
Southlands (3282) [2]
PartyCandidateVotes%±
Liberal Little S.1,14748.7N/A
Liberal Edwards A.1,095
Liberal Robinson J.1,055
Conservative Osmond P.86636.7N/A
Conservative Cakebread J.776
Conservative Thomson W.696
Labour Whipp B.34414.6N/A
Labour Paling A.327
Labour Paling M. Ms.292
Majority28111.9N/A
Turnout 2,35771.8N/A
Liberal win (new seat)
Southwick Green (3479) [2]
PartyCandidateVotes%±
Conservative Davies B. Ms.1,29852.0N/A
Conservative Divers N.1,286
Conservative Sweet I. Ms.1,245
Liberal Hutchinson J. Ms.68627.5N/A
Liberal Biggs A.642
Liberal Isherwood P.557
Labour Munnery D.51120.5N/A
Majority61224.5N/A
Turnout 2,49571.7N/A
Conservative win (new seat)
St. Marys (1069) [2]
PartyCandidateVotes%±
Conservative Richards R.34547.8N/A
Liberal Bienati C. Ms.27938.6N/A
Labour Whipp L. Ms.9813.6N/A
Majority669.1N/A
Turnout 72267.5N/A
Conservative win (new seat)
St. Nicolas (3687)3 [2]
PartyCandidateVotes%±
Conservative Carr G.1,40450.3N/A
Conservative Huber J.1,372
Conservative Potter E.1,332
Liberal Atrill D. Ms.1,01736.4N/A
Liberal Lock M.902
Liberal Stanley A.867
Labour Phillips J.37313.4N/A
Labour Pirie M. Ms.310
Majority38713.9N/A
Turnout 2,79475.8N/A
Conservative win (new seat)
Widewater (3968) [2]
PartyCandidateVotes%±
Liberal Gasson J.1,34244.9N/A
Conservative Melvey T.1,30943.8N/A
Liberal Sherlock M. Ms.1,299
Conservative Mitchell M. Ms.1,276
Liberal Isherwood D. Ms.1,268
Conservative Charlton S.1,232
Labour Harwood J. Ms.34111.4N/A
Majority331.1N/A
Turnout 2,99275.4N/A
Liberal win (new seat)
Conservative win (new seat)
Liberal win (new seat)

Related Research Articles

Adur District Non-metropolitan district in England

Adur is a local government district of West Sussex, England. It is named after its main river and is historically part of the English county of Sussex. The council is based in Shoreham-by-Sea and the district has a population of 59,627 according to the 2001 census.

Half of Adur District Council in West Sussex, England is elected every two years. Until 2003, the council was elected by thirds. Since the last boundary changes in 2004, 29 councillors have been elected from 14 wards.

West Sussex County Council in England is elected every four years.

Elections to Adur District Council were held on 2 May 2002. One third of the council was up for election and the Conservative party gained control of the council from no overall control. Overall turnout was 33%.

2008 Adur District Council election

Elections to Adur District Council in West Sussex, England were held on 1 May 2008. Half of the council was up for election and the Conservative party held overall control of the council.

One third of Worthing Borough Council in Worthing, West Sussex, England is elected each year, followed by one year without election. Since the last boundary changes in 2003, 37 councillors are elected from 13 wards.

2010 Adur District Council election

The 2010 Adur District Council election took place on 6 May 2010 to elect members of Adur District Council in West Sussex, England. Half of the council was up for election and the Conservative party stayed in overall control of the council.

2012 Adur District Council election

The 2012 Adur District Council elections took place on 3 May 2012 to elect members of Adur District Council in West Sussex, England. Half of the council was up for election, and the Conservative Party remained in overall control of the council.

Elections to West Sussex County Council were held on 7 June 2001, alongside a parliamentary general election. The whole council was up for election, and the Conservative Party remained in control of the council. Turnout across the county ranged from 42.7% in Broadfield to 69.6% in Midhurst, with the county average standing at 60.8%.

2016 Adur District Council election

The 2016 Adur District Council elections took place on 5 May 2016 to elect members of Adur District Council in West Sussex, England. Half of the council was up for election, and the Conservative Party remained in overall control of the council. The Labour Party trebled their number of seats from one to three.

The first elections to the newly created Adur District Council established by the Local Government Act 1972 in England and Wales were held 7 June 1973. Overall turnout was recorded at 46.6%.

Elections to the Adur District Council were held on 6 May 1976, with the entire council up for election. The two councillors in Marine elected as Residents were defending their seats as Independents. Overall turnout was recorded at 51.8%.

1980 Adur District Council election

Elections to the Adur District Council were held on 1 May 1980, with one third of the council up for election. There was an additional vacancy in the Southwick Green ward, and no elections for the single-member ward St Marys. Overall turnout dropped to 48.7%.
1982 Adur District Council election

Elections to the Adur District Council were held on 6 May 1982, with one third of the council up for election. There was additional vacancies in the Mash Barn and Peverel wards, but no elections for the single-member ward St Marys and Residents stronghold, Marine, went uncontested. In the intervening years, the newly formed Alliance had gained three seats at the expense of the Conservatives. Overall turnout fell to 42.4%.

1983 Adur District Council election

Elections to the Adur District Council were held on 5 May 1983, with one third of the council up for election. There was an additional vacancy in the Peverel ward and no elections for the Marine ward. Overall turnout climbed to 47.6%.

1984 Adur District Council election

Elections to the Adur District Council were held on 3 May 1984, with one third of the council up for election. There was no elections held for the single-member St Mary's ward. Overall turnout was recorded at 45.6%.

1986 Adur District Council election

Elections to the Adur District Council were held on 8 May 1986, with minor boundary changes taking effect, impacting the Peverel ward. One third of the council was due for re-election, with additional vacancies in Buckingham, Churchill and Mash Barn wards. No elections were to be held for the single-member St Mary's ward. The formerly Conservative councillor for Southwick Green was defending the seat as an Independent, with no Conservative contesting that ward. Overall turnout was down slightly to 45.3%.

1987 Adur District Council election

Elections to the Adur District Council were held on 7 May 1987, with one third of the council up for election. There were additional vacancies in the Churchill and Widewater wards and no elections for the two-member Marine ward. Overall turnout climbed to 48.3%.

1988 Adur District Council election

Elections to the Adur District Council were held on 5 May 1988, with one third of the council up for election however no elections were held for the single-member ward St Mary's. Overall turnout dropped to 42.5%.
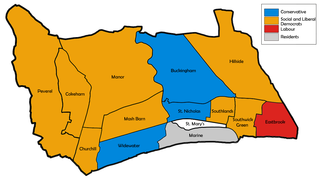
1990 Adur District Council election

Elections to the Adur District Council were held on 3 May 1990, with one third of the council up for election, as well as vacancies in the Churchill and Manor wards. No elections were held for the single-member St Mary's ward. The sitting Resident councillor in Overall turnout jumped to 49.8%.
References

  1. Local elections in Britain: a statistical digest, edited by Colin Rallings and Michael Thrasher. 2nd Edition 2003
  2. 1 2 3 4 5 6 7 8 9 10 11 12 13 14 15 16 17 "Elections Centre: Adur 1973-2012" (PDF). electionscentre.co.uk/plymouth.ac.uk. Retrieved 2017-07-25.
  3. "Vote 2012: Adur". bbc.co.uk. Retrieved 2018-03-18.