| ||
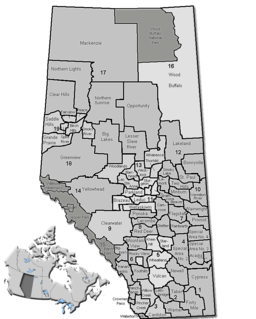
 Distribution of Alberta's 269 urban municipalities as of August 31, 2013 | ||
Alberta has provincial legislation allowing its municipalities to conduct municipal censuses between April 1 and June 30 inclusive. [1] [2] Municipalities choose to conduct their own censuses for multiple reasons such as: to better inform municipal service planning and provision; to capitalize on per capita based grant funding from higher levels of government; or to simply update their populations since the last federal census. [3]

Alberta is a western province of Canada. With an estimated population of 4,067,175 as of 2016 census, it is Canada's fourth most populous province and the most populous of Canada's three prairie provinces. Its area is about 660,000 square kilometres (250,000 sq mi). Alberta and its neighbour Saskatchewan were districts of the Northwest Territories until they were established as provinces on September 1, 1905. The premier has been Rachel Notley since May 2015.
Four provinces and territories in Canada have legislation that allow municipalities to conduct a municipal census. These include the provinces of Alberta and Saskatchewan and the territories of Nunavut and Yukon. Of these four provinces and territories, municipalities in Alberta were the only ones that exercise the option to conduct a municipal census as of 2006.

A census is the procedure of systematically acquiring and recording information about the members of a given population. The term is used mostly in connection with national population and housing censuses; other common censuses include agriculture, business, and traffic censuses. The United Nations defines the essential features of population and housing censuses as "individual enumeration, universality within a defined territory, simultaneity and defined periodicity", and recommends that population censuses be taken at least every 10 years. United Nations recommendations also cover census topics to be collected, official definitions, classifications and other useful information to co-ordinate international practice.
Contents
- Municipal census results
- Breakdowns
- Lloydminster
- Hamlets
- Shadow population counts
- Notes
- See also
- References
- External links
Alberta had 358 municipalities between April 1 and June 30, 2013, [lower-alpha 2] down from 359 during the same three-month period in 2012. [lower-alpha 3] At least 40 of these municipalities (11.2%) conducted a municipal census in 2013. Alberta Municipal Affairs recognized those conducted by 38 of these municipalities. [6] By municipal status, it recognized those conducted by 8 of Alberta's 17 cities, 16 of 108 towns, 5 of 94 villages, 1 of 51 summer villages and 8 of 64 municipal districts. [6] [lower-alpha 4] In addition to those recognized by Municipal Affairs, censuses were conducted by the Town of Swan Hills and the Municipal District of Greenview No. 16. [7] [8]
Events from the year 2013 in Canada.
Events from the year 2012 in Canada.
Alberta Municipal Affairs is a ministry of the Executive Council of Alberta. Its major responsibilities include assisting municipalities in the provision of local government, administering the assessment of linear property in Alberta, administering a safety system for the construction and maintenance of buildings and equipment, and managing Alberta's network of municipal and library system boards.

Some municipalities achieved population milestones as a result of their 2013 censuses. The cities of Lethbridge and Lloydminster surpassed the 90,000 and the 30,000 marks respectively. Furthermore, the Alberta and Saskatchewan portions of Lloydminster exceeded the 20,000 and 10,000 milestones respectively as well. Okotoks, Alberta's largest town, surpassed 25,000 residents, while the Town of Whitecourt became eligible for city status by eclipsing 10,000 people. The Town of Blackfalds and the Municipal District of Taber each surpassed the 7,000-mark and the Town of Wainwright grew beyond 6,000.

Lethbridge is a city in the province of Alberta, Canada, and the largest city in southern Alberta. It is Alberta's fourth-largest city by population after Calgary, Edmonton and Red Deer, and the third-largest by land area after Calgary and Edmonton. The nearby Canadian Rockies contribute to the city's warm summers, mild winters, and windy climate. Lethbridge lies southeast of Calgary on the Oldman River.

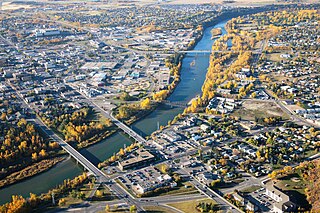
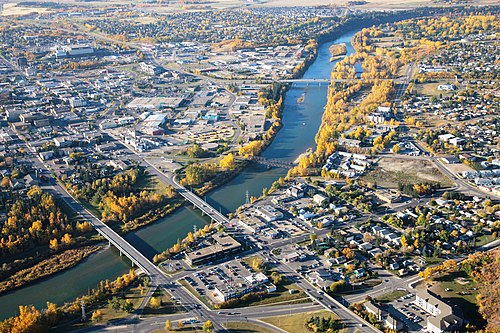
Lloydminster is a Canadian city which has the unusual geographic distinction of straddling the provincial border between Alberta and Saskatchewan. The city is incorporated by both provinces as a single city with a single municipal administration.

Saskatchewan is a prairie and boreal province in western Canada, the only province without a natural border. It has an area of 651,900 square kilometres (251,700 sq mi), nearly 10 percent of which is fresh water, composed mostly of rivers, reservoirs, and the province's 100,000 lakes.